Energy & Commodity Risk
Model carbon exposure, hedge payoffs, and correlated or mean-reverting price decks — the way energy prices actually behave
Four parameter-driven models for commodity price and hedging. No table goes into the visual — you describe each price as a distribution and the simulation produces the range. Two of them model several commodities at once, because Brent, WTI and Henry Hub do not move independently and pretending they do understates the risk.
Answer the question: "What does our carbon bill and hedge book look like next year across the whole range of prices — not just at the one price in the budget?"
The four models on this page
| Model | What it computes | Key inputs |
|---|---|---|
| Carbon Cost | Emissions above the free allowance, priced at an uncertain carbon price | Emissions (tCO2e) · CO₂ price · Free allowance |
| Hedging Payoff | Effective realised price under a swap, put or collar | Price · Structure · Strike · Premium · Floor · Cap |
| Price Deck (correlated) | Three commodities simulated together through a correlation matrix | Brent · WTI · Henry Hub · three ρ values |
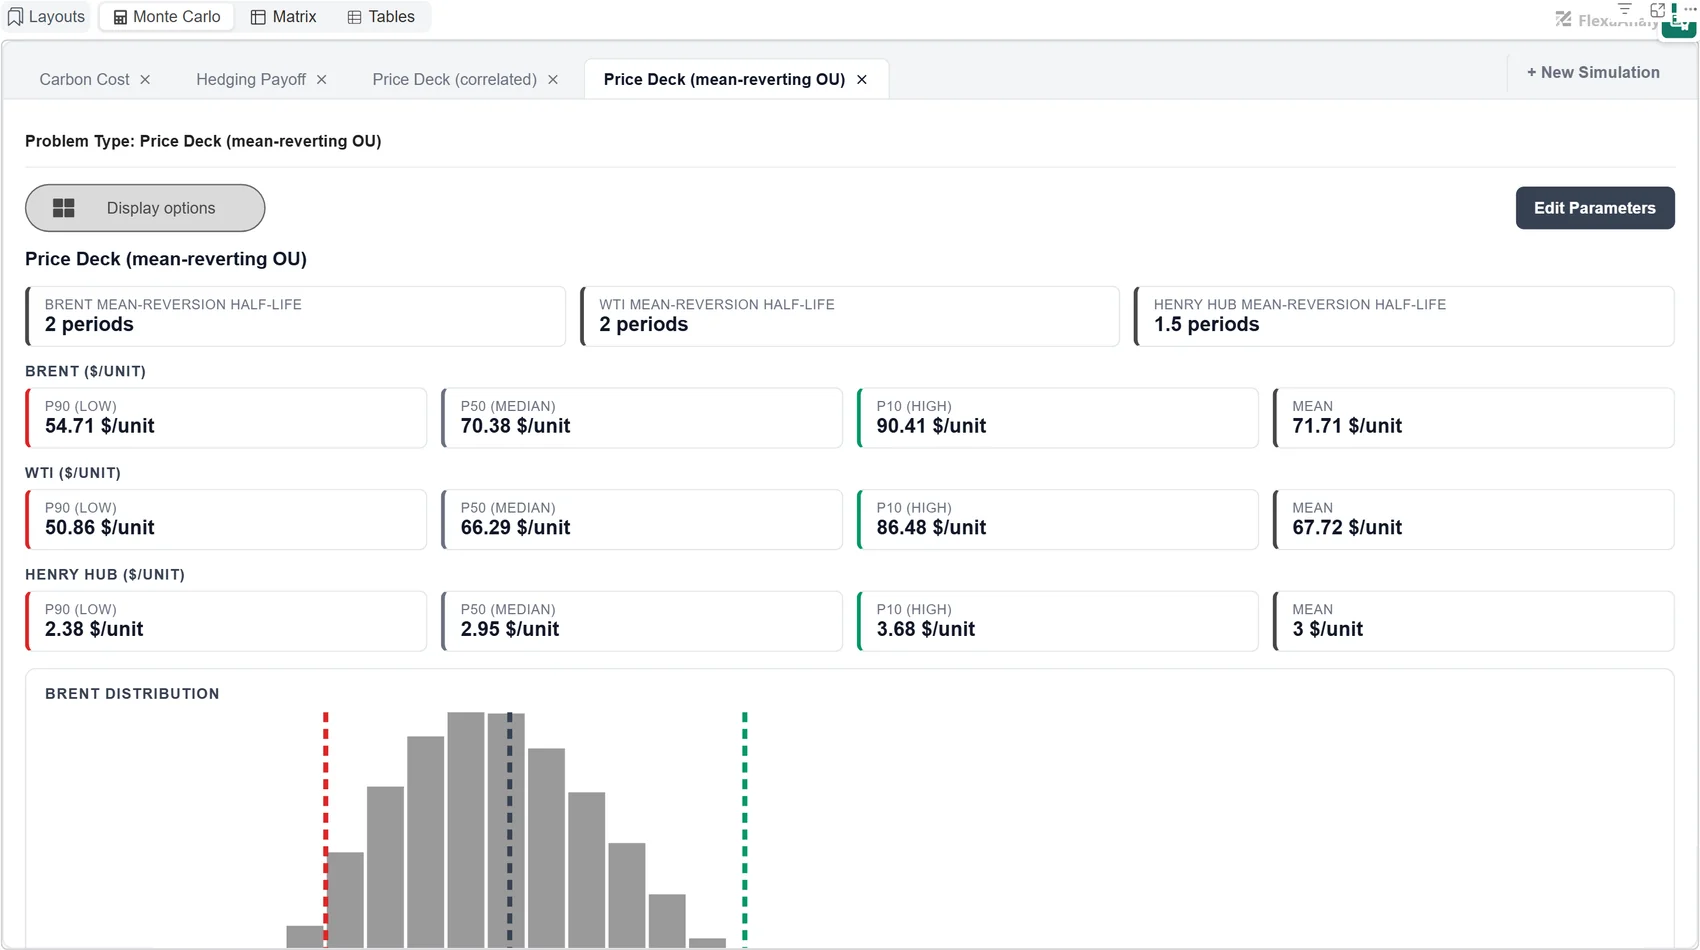
| Price Deck (mean-reverting OU) | Ornstein-Uhlenbeck paths that pull back toward a long-term mean | Spot P0 · Long-term mean L · Half-life · Volatility σ · Horizon |
Carbon Cost
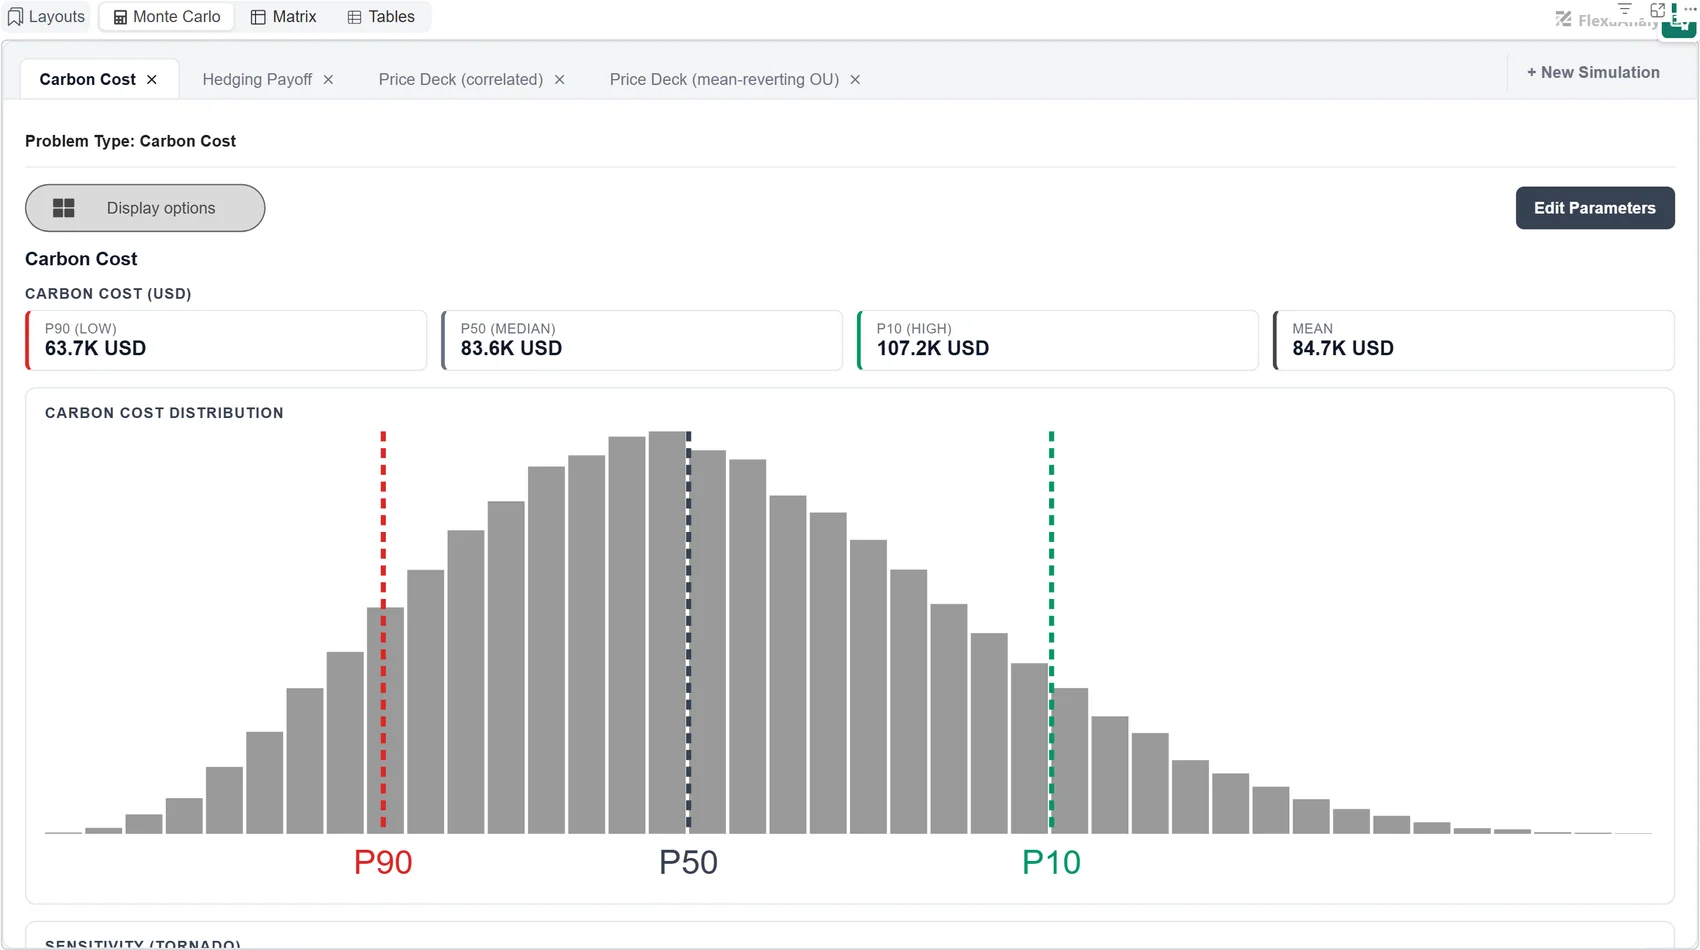
Two uncertain quantities multiplied together: how much you emit and what a tonne costs. The free allowance is subtracted first, so the model shows the cliff that appears once an operation grows past its allocation.
Default parameters:
- ▸Emissions (tCO₂e):PERT(800, 1000, 1300)
- ▸CO₂ price:Triangular(50, 80, 120)
- ▸Free allowance:0
Hedging Payoff
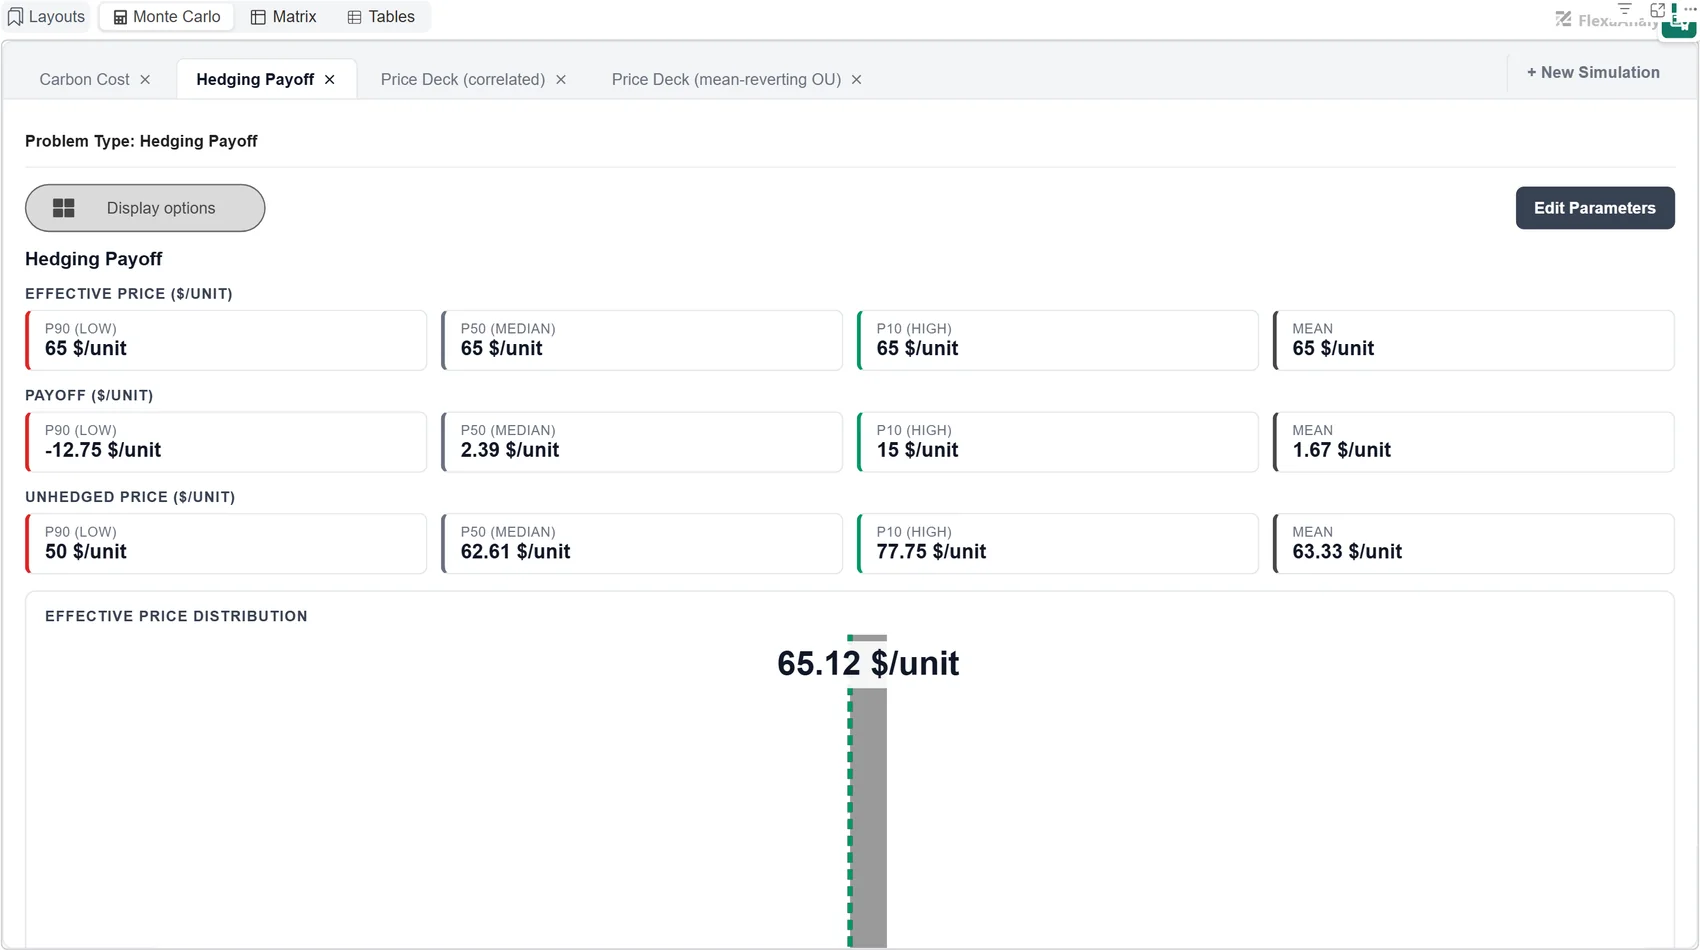
Prices the three structures a producer usually chooses between and reports the effective price each one delivers across the price distribution. Reported side by side, because the interesting question is not what a hedge pays but which shape suits the exposure.
Default parameters:
- ▸Price:Triangular(40, 60, 90)
- ▸Structure:swap / put / collar
- ▸Strike:swap and put
- ▸Premium:put only
- ▸Floor / Cap:collar only
Price Deck (correlated)
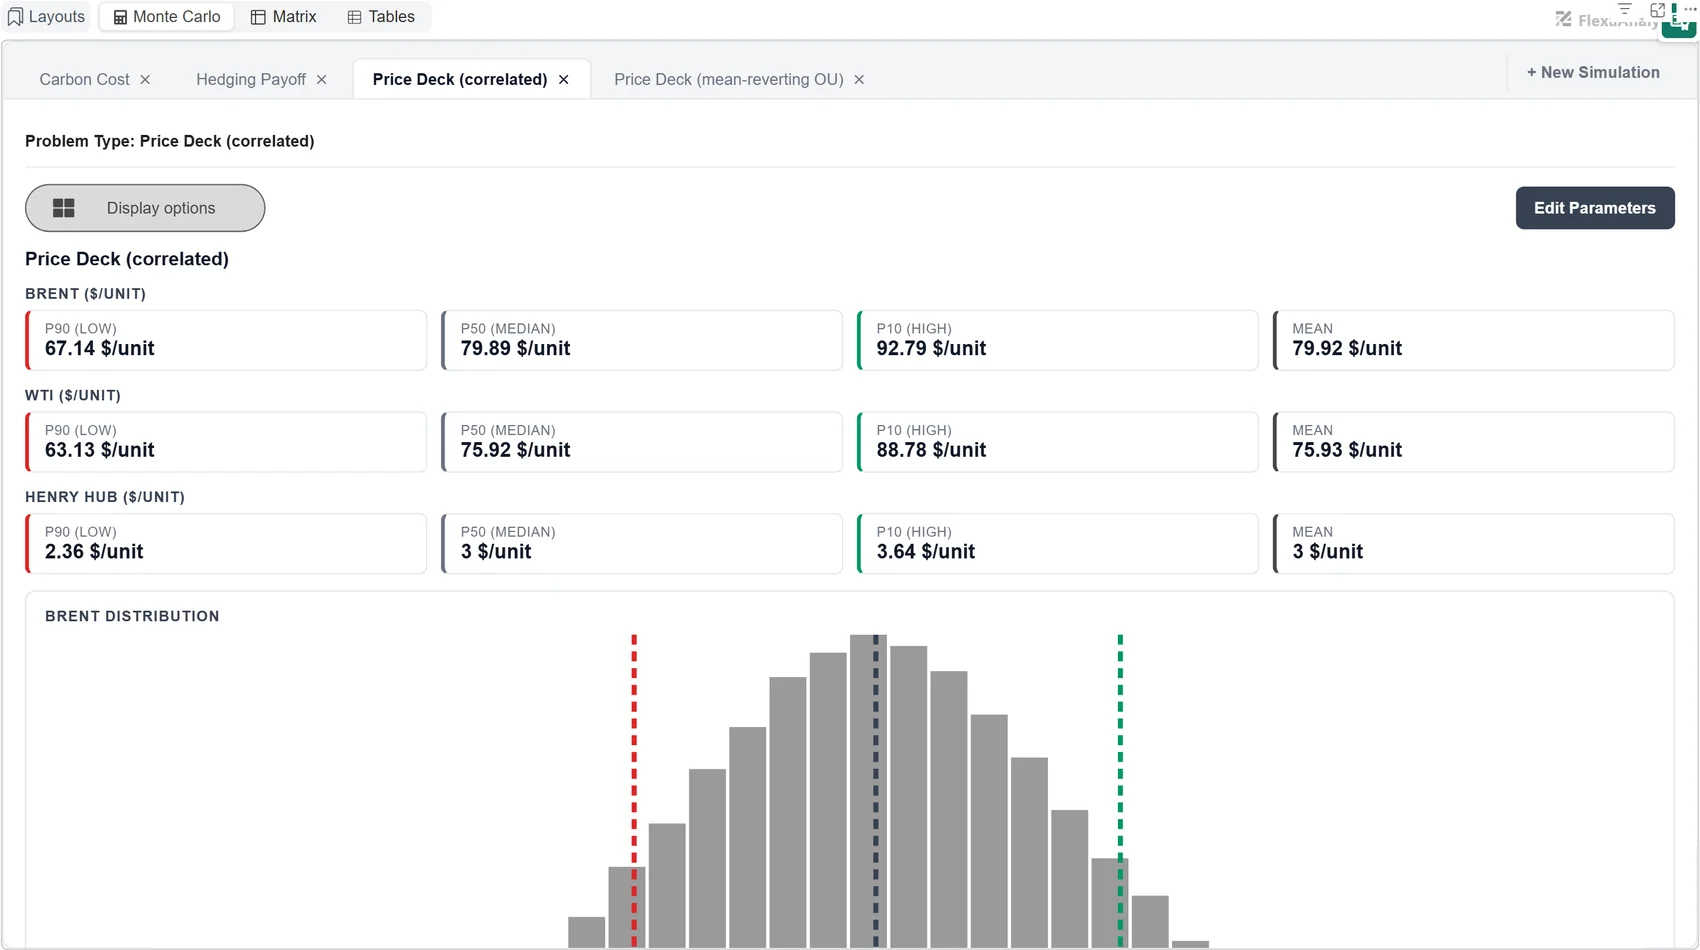
Each commodity is drawn from its own normal distribution, then coupled through a correlation matrix so scenarios stay physically plausible. Brent and WTI at ρ 0.9 move almost in lockstep; gas at 0.3 does its own thing much of the time.
Default parameters:
- ▸Brent:Normal(80, 10)
- ▸WTI:Normal(76, 10)
- ▸Henry Hub:Normal(3, 0.5)
- ▸ρ Brent-WTI / Brent-HH / WTI-HH:0.9 / 0.3 / 0.3
Price Deck (mean-reverting OU)
The model to use over multiple years. A normal draw treats every period as independent, so prices wander off indefinitely; Ornstein-Uhlenbeck pulls them back toward a long-term level at a speed set by the half-life, which is closer to how commodity prices have historically behaved.
Default parameters:
- ▸Brent (P0 / L / half-life / σ):80 / 70 / 2 / 12
- ▸WTI (P0 / L / half-life / σ):76 / 66 / 2 / 12
- ▸Henry Hub (P0 / L / half-life / σ):3 / 3 / 1.5 / 0.5
- ▸Horizon T:5 periods
- ▸ρ Brent-WTI / Brent-HH / WTI-HH:0.9 / 0.3 / 0.3