Power BI Budget Template
Power BI Budget Template: Free PBIX Download + Setup Guide (2026)
1. Three Free Power BI Budget Templates
The following templates are available as PBIX files at flexaintel.com/Power-BI-dashboard-examples-PBIX. Each template includes sample data so you can explore it immediately before connecting your own data.
Template 1 — Budget vs Actuals Report
The most commonly requested layout — Actuals vs Budget with variance columns, filterable by department, GL account, and month. Built on a single-fact-table data model with a Scenario column.
- Budget vs Actuals Matrix with Variance $ and Variance %
- KPI cards: Total Actuals, Budget, Variance, Variance %
- Waterfall chart — budget bridge by department
- Slicers: Department, Month, Cost Center
- Pre-built DAX measures (Actuals, Budget, Variance, Variance %)
- Conditional formatting: green/red by favorable direction
- Flexa Tables visual for self-service variance columns in published report
Template 2 — P&L Income Statement
Full income statement layout with custom row ordering, calculated subtotals (Gross Profit, EBIT), and sign-aware conditional formatting. Replaces the monthly Excel P&L pack.
- P&L Matrix with Revenue, COGS, Gross Profit, OpEx, EBIT rows
- Month columns (Jan–Dec) with YTD total
- MoM and YoY variance columns
- GL Account dimension with SortOrder and FavorableDirection
- SWITCH-based display measure for subtotal rows
- Conditional formatting: favorable direction per line type
Template 3 — Departmental Cost Tracking
Single-department budget dashboard with RLS pre-configured. Each department head sees only their own cost center data. Includes budget remaining gauge and top-5 expense bar chart.
- Gauge chart: Budget used % (MTD and YTD)
- Bar chart: Spend by GL category
- Matrix: GL account detail with variance
- Row-level security (RLS) table pre-configured
- KPI cards: Total Spend, Budget Remaining, Variance
2. What Data Model Each Template Expects
Before connecting your data, understand what schema each template is built on. All three templates share the same core data model:
| Table | Required columns | Notes |
|---|---|---|
FactFinancials | Date, GLCode, CostCenter, Scenario, Amount | Scenario values must be exactly: "Actual", "Budget", "Forecast" |
DimDate | Date, Month, MonthNum, Quarter, Year | Must be a continuous calendar — no gaps |
DimGLAccount | GLCode, GLName, Category, SortOrder, FavorableDirection | FavorableDirection: +1 for revenue lines, -1 for expense lines |
DimCostCenter | CostCenter, DeptName, DeptGroup | Optional for Template 1 and 2; required for Template 3 |
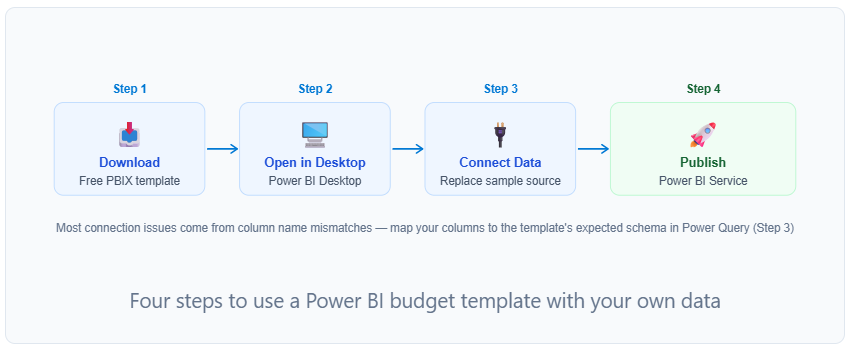
3. How to Connect Your Data in 5 Steps
Download the PBIX from flexaintel.com/Power-BI-dashboard-examples-PBIX and open in Power BI Desktop. You'll see the report with sample data — verify all pages are working before changing anything.
Home tab → Transform data. You'll see the sample data queries (FactFinancials, DimDate, DimGLAccount, DimCostCenter). Do not delete these — modify them in place.
Right-click each query → Data source settings → Change source. Replace the sample Excel file path or SQL connection with your own. If your data comes from multiple sources (e.g., Actuals from SQL, Budget from Excel), you'll combine them in Power Query with an Append Queries step before loading into FactFinancials.
Your data likely has different column names than the template expects. In Power Query, use Rename Column to map your columns to the template's expected names. The critical ones are: your date column → Date, your GL code column → GLCode, your amount column → Amount, your scenario/type column → Scenario.
-- Common column name mappings
Your column     →  Template expects
"PostingDate"   →  Date
"AccountCode"   →  GLCode
"Value"         →  Amount
"DataType" → Scenario (then replace values: "Actual"/"Budget")Close & Apply in Power Query. Check the Matrix visual on each page — if it shows data, the connection worked. If measures return blank, open the DAX measure definitions (click any measure in the Fields pane → Edit) and verify the table and column names match your data.
= List.Dates(#date(2024,1,1), 730, #duration(1,0,0,0)) to generate a continuous date range.
4. How to Customise Without Breaking DAX
The most common way users break a template is renaming tables or columns after loading data — the DAX measures still reference the old names and return errors. Follow these rules when customising:
Safe to change
- Visual formatting (colors, fonts, borders, backgrounds)
- Slicer options and layout positions
- Adding new pages (doesn't affect existing measures)
- Adding new visuals that use existing measures
- Report title and text box content
- Adding new DAX measures (additive — doesn't break existing ones)
Requires care
- Renaming columns: If you rename a column in Power Query after loading, update every DAX measure that references it. Use Find & Replace in DAX (View → DAX editor) to find all references.
- Adding GL Account rows: New GL accounts need a corresponding row in DimGLAccount with a SortOrder value. If you skip this, the new account appears at the bottom of the Matrix outside the P&L hierarchy.
- Changing the Scenario column values: If you change "Actual" to "Actuals" in Power Query, update the DAX measure filter from
"Actual"to"Actuals"in every measure that references it.
Don't do this
- Deleting tables from the model: Even if a table looks unused, it may be referenced by a measure or relationship. Delete only after verifying all dependences.
- Changing relationship cardinality: The templates are built on specific many-to-one relationships. Changing these breaks all cross-filter behavior.
5. Adding Variance Columns Without DAX
The templates include pre-built DAX variance measures for the most common scenarios (Actuals vs Budget, MoM, YoY). But Finance teams frequently need to compare periods the template didn't anticipate — Q1 vs Q2, or this month vs same month two years ago.
Instead of writing new DAX measures each time, Flexa Tables (included in Templates 1 and 2) lets end users add variance columns directly in the published Power BI report:
For teams that need the full pivot flexibility (restructuring rows and columns after publishing), see the Power BI pivot table guide. For period-over-period variance specifically, see the variance analysis guide.
6. Four Common Template Mistakes to Avoid
Mistake 1 — Connecting data before exploring the sample
Always explore the template with sample data first. Understand what each page shows and where each DAX measure is used before replacing the data source. This saves hours of debugging after the connection.
Mistake 2 — Loading Actuals and Budget as separate fact tables
These templates are built on a single fact table with a Scenario column. If you load Actuals and Budget as separate tables and try to join them, the DAX measures break. If your source data is in separate tables, use Power Query's Append Queries to combine them into one table with a Scenario column before loading.
-- Power Query: Append Actuals and Budget into one table
let
    Actuals = Excel.Workbook(...)[Actuals]{[Item="Sheet1"]}[Data],
    ActualsWithScenario = Table.AddColumn(Actuals, "Scenario", each "Actual"),
    Budget = Excel.Workbook(...)[Budget]{[Item="Sheet1"]}[Data],
    BudgetWithScenario = Table.AddColumn(Budget, "Scenario", each "Budget"),
    Combined = Table.Combine({ActualsWithScenario, BudgetWithScenario})
in
    Combined
Mistake 3 — Using the wrong date granularity
If your Actuals are at transaction level (daily) but your Budget is at monthly level, the join between FactFinancials and DimDate works at different grains. Aggregate Actuals to monthly level in Power Query before loading — this also improves report performance significantly.
Mistake 4 — Skipping the DimGLAccount SortOrder column
If you add new GL accounts to your data without adding them to DimGLAccount with a SortOrder value, they appear at the bottom of the P&L Matrix outside the hierarchy. Maintain DimGLAccount as a controlled dimension — add new accounts with the correct SortOrder before refreshing data.
Download free Power BI budget templates
PBIX files for budget vs actuals, P&L income statement, and departmental cost tracking — pre-built with DAX measures and Flexa Tables visual. No email required.
Browse Free Templates →FAQ
Where can I download a free Power BI budget template?
Flexa Intel offers free Power BI budget templates (PBIX files) at flexaintel.com/Power-BI-dashboard-examples-PBIX. Templates include budget vs actuals, P&L income statement, and departmental cost tracking — pre-built with DAX measures and Flexa Tables visual.
How do I connect my data to a Power BI budget template?
Open the PBIX in Power BI Desktop → Home → Transform data → right-click each query → Data source settings → change source. Map your column names to the template's expected schema (Date, GLCode, Scenario, Amount) using Rename Column in Power Query. Close & Apply, then verify the Matrix visual shows your data.
What should a Power BI budget template include?
A complete budget template should include: a FactFinancials table with Scenario column, DimDate and DimGLAccount dimension tables, DAX measures for Actuals/Budget/Variance/Variance%, a Matrix visual with conditional formatting, KPI cards, and slicers for time period and department. Templates with Flexa Tables also let end users add variance columns in the published report without modifying the PBIX.
Can I use a Power BI budget template without knowing DAX?
Yes — if the template includes pre-built DAX measures, you only need to connect your data and ensure column names match. For adding new variance types without writing DAX, Flexa Tables (AppSource) lets end users add variance columns directly in the published report.
What is the difference between a Power BI budget template and a financial dashboard template?
A budget template is specifically built for Actual vs Budget comparison — it includes a Scenario dimension, variance measures, and period comparisons. A financial dashboard template is broader, covering P&L, cash flow, and executive KPIs. Budget templates are used by FP&A and Controllers; financial dashboard templates are used for board reporting. See the financial dashboard examples guide for the full breakdown.


