
Power BI HR Analytics Dashboard Template (Free PBIX Download)
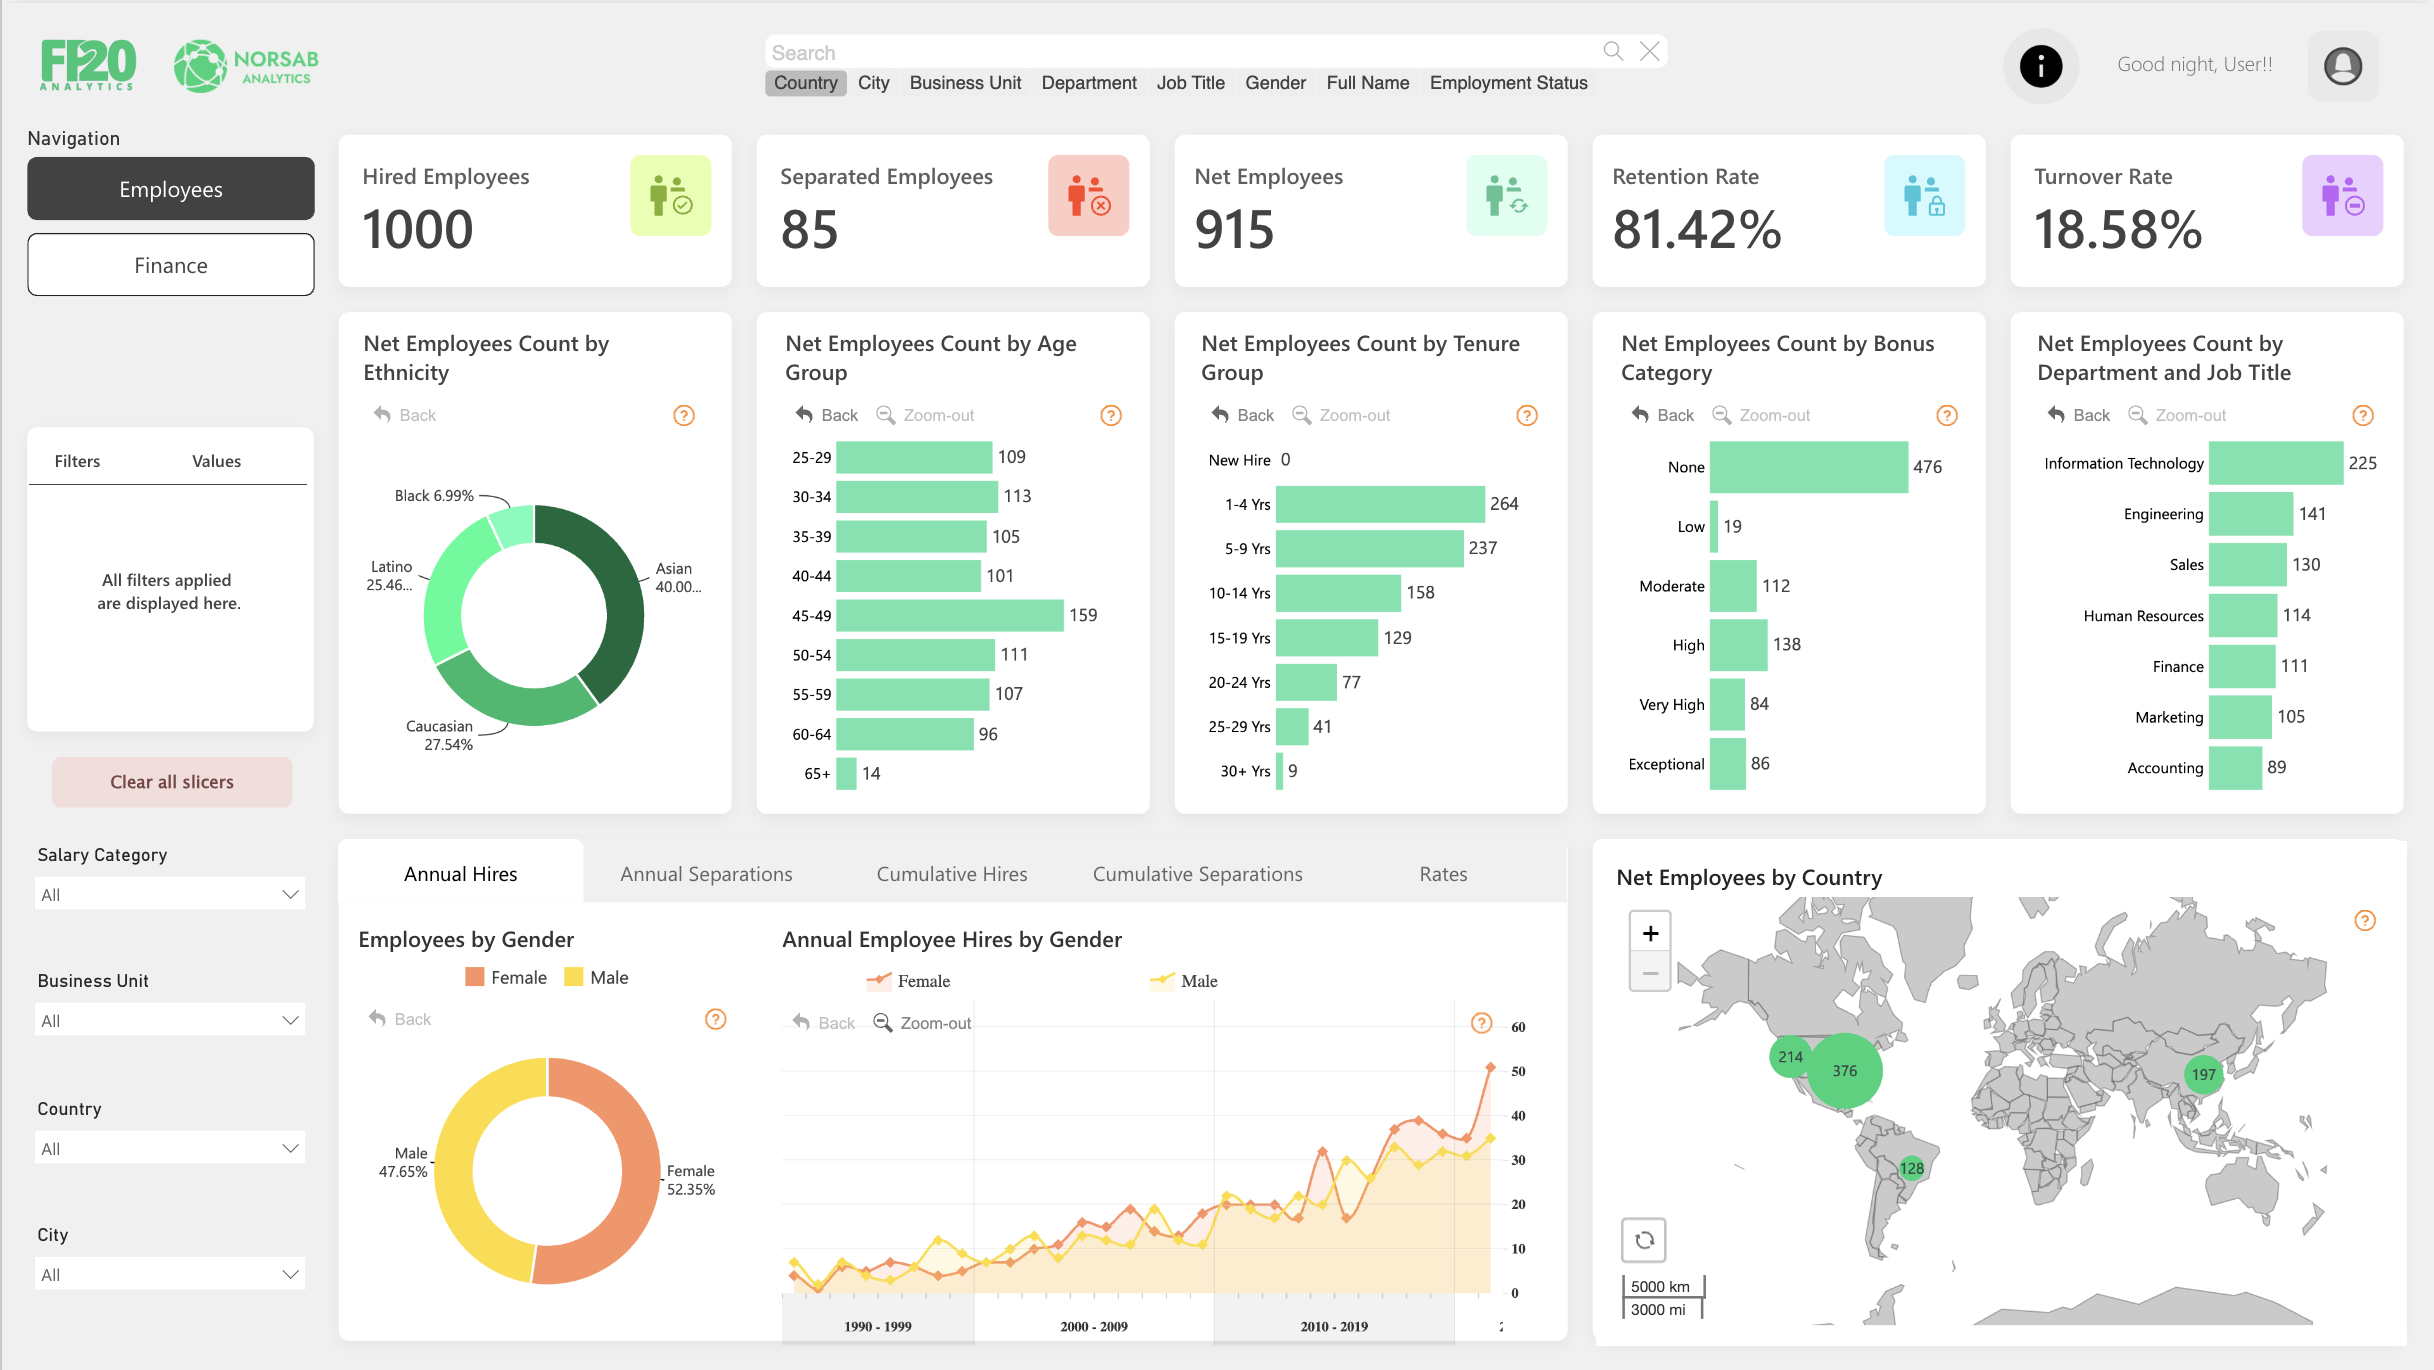
This dashboard gives HR leaders a complete workforce snapshot — from headcount and turnover rates to demographic composition, tenure distribution, and bonus allocation — built for organizations managing multi-country, multi-department employee populations. It serves HR Directors, People Analytics teams, and CHROs who need to track workforce stability, diversity equity, and compensation structure in a single interactive view. The multi-tab time series (Annual Hires, Separations, Cumulative, Rates) adds longitudinal depth rarely found in standard HR reports.
1. What's Inside This Template
KPI Banner — Workforce Health at a Glance
| MetricValueSignal | ||
| Hired Employees | 1,000 | Total workforce baseline |
| Separated Employees | 85 | Exits in period |
| Net Employees | 915 | Active headcount |
| Retention Rate | 81.42% | Share of workforce retained |
| Turnover Rate | 18.58% | Share who separated |
The 8.5% separation rate (85/1,000) driving an 18.58% turnover rate suggests annualized churn — meaning the 85 separated employees represent roughly one cycle of turnover against a rolling workforce count.
Donut Chart — Net Employees by Ethnicity
| EthnicityShare | |
| Asian | ~40.00% |
| Caucasian | ~27.54% |
| Latino | ~25.46% |
| Black | ~6.99% |
Asian employees form the largest single ethnic group at 40%, nearly 1.5× Caucasian representation. Black representation at 6.99% is the lowest — a DEI gap worth monitoring against industry or regional benchmarks.
Horizontal Bar — Net Employees by Age Group
| Age GroupCount | |
| 25–29 | 109 |
| 30–34 | 113 |
| 35–39 | 105 |
| 40–44 | 101 |
| 45–49 | 159 |
| 50–54 | 111 |
| 55–59 | 107 |
| 60–64 | 96 |
| 65+ | 14 |
The 45–49 cohort is the single largest age band at 159 — strikingly higher than adjacent groups — indicating a bulge of mid-career employees likely hired in a prior growth wave. This cohort will approach retirement age within 15–20 years, creating a succession planning risk.
Horizontal Bar — Net Employees by Tenure Group
| TenureCount | |
| New Hire | 0 |
| 1–4 Yrs | 264 |
| 5–9 Yrs | 237 |
| 10–14 Yrs | 158 |
| 15–19 Yrs | 129 |
| 20–24 Yrs | 77 |
| 25–29 Yrs | 41 |
| 30+ Yrs | 9 |
Zero new hires in the current snapshot is significant — it means all 1,000 employees have at least 1 year of tenure. The workforce is front-loaded in the 1–9 year range (501 out of 915 net employees = 54.8%), suggesting a relatively young-tenured but not entry-level workforce.
Horizontal Bar — Net Employees by Bonus Category
| Bonus CategoryCount | |
| None | 476 |
| Low | 19 |
| Moderate | 112 |
| High | 138 |
| Very High | 84 |
| Exceptional | 86 |
52.1% of employees receive no bonus — the majority. Among those who do, the distribution skews toward High/Exceptional (308 combined) rather than Low/Moderate (131 combined), suggesting a bimodal compensation structure: either employees receive substantial bonuses or none at all.
Horizontal Bar — Net Employees by Department & Job Title
| DepartmentCount | |
| Information Technology | 225 |
| Engineering | 141 |
| Sales | 130 |
| Human Resources | 114 |
| Finance | 111 |
| Marketing | 105 |
| Accounting | 89 |
IT is the largest department at 225 — 59% larger than Engineering (141) and nearly 2.5× Accounting (89). This confirms a technology-heavy organization, likely a SaaS or tech-services company.
Donut Chart — Employees by Gender
| GenderShare | |
| Female | 52.35% |
| Male | 47.65% |
Gender balance is notably close to parity, with a slight female majority — uncommon in tech-heavy organizations and worth highlighting as a DEI strength.
Line Chart — Annual Employee Hires by Gender (1990–2019)
Both male and female hire trends show a sharp upward trajectory from 2010–2019, with female hires (orange) marginally outpacing male hires (yellow) in recent years. The hiring acceleration post-2010 indicates rapid organizational growth in the last decade of the dataset.
Geographic Map — Net Employees by Country
| RegionEmployee Count | |
| Cluster 1 (Americas) | 376 |
| Cluster 2 (Americas) | 214 |
| Cluster 3 (Asia-Pacific) | 197 |
| Cluster 4 (Americas/Other) | 128 |
The Americas dominate headcount, with the largest cluster at 376. Asia-Pacific at 197 is the second major region. The organization is predominantly Western-hemisphere with a meaningful APAC presence.
Multi-Tab Time Series
Tabs cover Annual Hires, Annual Separations, Cumulative Hires, Cumulative Separations, and Rates — enabling trend analysis across the full employment lifecycle, not just point-in-time snapshots.
2. Key Insights
- 18.58% turnover is above the healthy benchmark of 10–15% for most industries. With 85 separations against 1,000 hired, every percentage point of turnover reduction represents ~10 fewer exits. If average replacement cost is $15,000–$25,000 per employee, bringing turnover to 15% would save $500K–$850K annually.
- The 45–49 age bulge (159 employees — the largest single cohort) is a hidden succession risk. This group will hit traditional retirement age (65+) within 16–20 years, and with only 9 employees currently at 30+ years tenure, institutional knowledge transfer is already thin. No succession pipeline is visible in the dashboard.
- Zero new hires in the current snapshot combined with a 1–4 year tenure majority (264 employees) suggests a hiring freeze or data period limitation. The 1–4 year cohort was likely hired 2020–2023, meaning the organization grew rapidly then stopped. This warrants a conversation about whether the freeze is strategic or budget-driven.
- 52% of employees receive no bonus — yet the bonus-eligible group skews heavily toward High and Exceptional tiers. This all-or-nothing bonus structure risks disengaging the unbonused majority while creating retention risk at the top, where high-bonus earners are also the most recruitable by competitors.
- Black employees at 6.99% represent a DEI gap that may not be visible in aggregate metrics. The organization appears diverse at the headline level (4 ethnicities), but the 6× gap between Asian (40%) and Black (6.99%) representation within the same workforce suggests uneven hiring pipelines by ethnicity.
- Female employees hold a 52.35% majority in a tech-heavy organization (IT = 25% of headcount) — a significant demographic achievement given that women typically represent 26–28% of tech workforces globally. This is either a genuine DEI win or reflects female concentration in non-technical roles within IT — the dashboard doesn't disaggregate gender by department, which is the critical next question.
3. Who This Template Is For
- HR Directors and CHROs at mid-to-large organizations who need a board-ready workforce dashboard that combines headcount, turnover, diversity metrics, and compensation structure without requiring custom development.
- People Analytics Managers who want a PBIX template they can connect to their HRIS (Workday, BambooHR, SAP SuccessFactors) and immediately surface retention risk, demographic gaps, and tenure distribution for quarterly business reviews.
- Compensation & Benefits Analysts who need to visualize bonus category distribution across the workforce and identify whether the current structure aligns with retention goals and equity standards.
4. How to Use
- Download the PBIX file from the Flexa Intel gallery.
- Open in Power BI Desktop (2023 or later recommended for map visuals).
- Connect your data source — typically an HRIS export (Workday, BambooHR, SAP SuccessFactors, or a flat HR SQL table) with fields for employee ID, hire date, separation date, department, job title, gender, ethnicity, country, tenure, and compensation/bonus tier.
- All visuals update automatically — KPI cards, demographic donuts, age/tenure/bonus bars, gender trend lines, geographic map, and all five time-series tabs recalculate from your connected data.
This dashboard visualizes workforce demographics beautifully but lacks a structured department-level table showing headcount, turnover rate, average tenure, gender split, and bonus distribution side by side per team. Flexa Tables is a Microsoft-certified Power BI visual built for exactly this — multi-column HR reporting with conditional formatting by performance tier, expandable department-to-job-title hierarchies, and sortable columns that make weekly headcount reviews and leadership briefings dramatically faster.
Other Templates
If you find this website helpful, share it with friends and colleagues to boost their Power BI skills and work efficiency!
Like this site? Share it