Power BI HR Analytics Dashboard Template (Free PBIX Download)
Introduction: This Power BI HR Analytics dashboard gives HR managers and People Analytics teams a 30-year view of workforce movement — from hiring acceleration to termination spikes — alongside current workforce health metrics like retention rate, average salary, tenure, and age. Built as a two-section Summary page with a separate HR Metrics tab, it covers both historical trends and present-state workforce composition in one report.
What's Inside This Template
Section 1 — Headcount
Summary KPIs (left card):
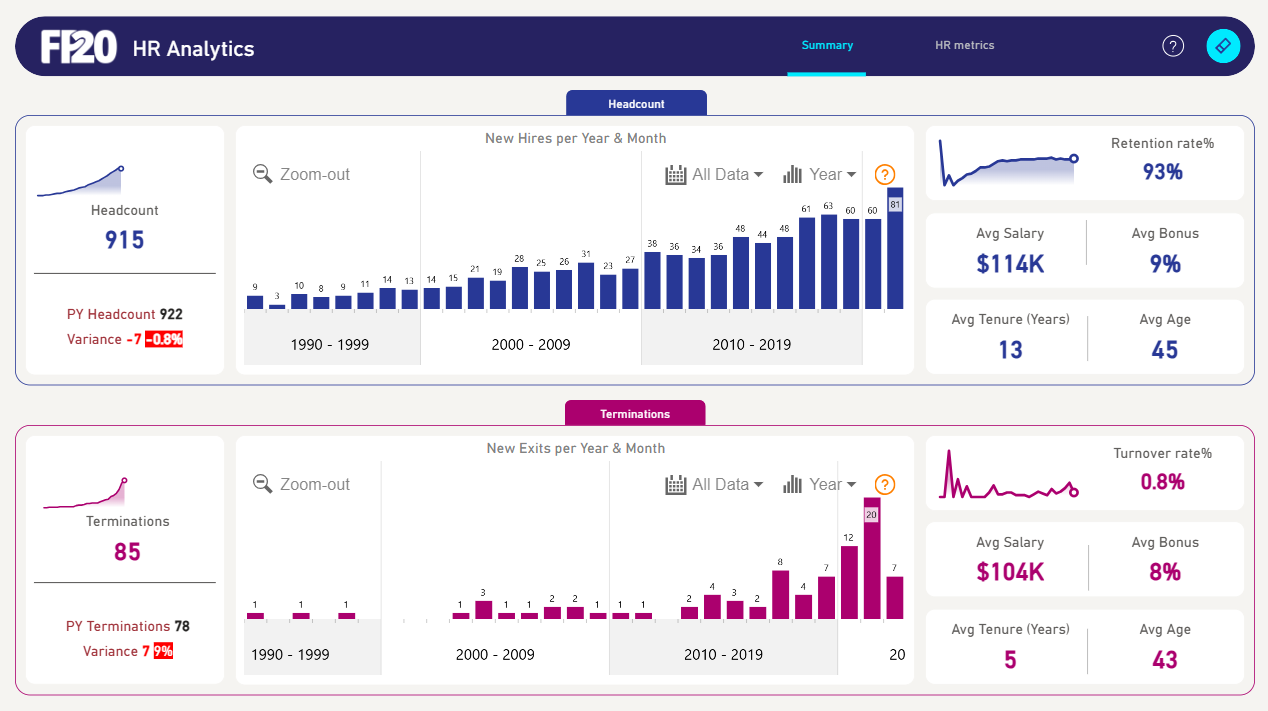
- Current headcount: 915
- Prior year headcount: 922
- Variance: -7 (-0.8%) — marginal net reduction, the organization is in a near-stable headcount state
New Hires per Year & Month (bar chart, 1990–2019): Three decades of hiring history reveal a clear growth trajectory:
- 1990–1999: Flat, low-volume hiring — 3 to 15 hires per year, typical of an early-stage or slow-growth organization
- 2000–2009: Gradual ramp — 14 to 31 hires per year, consistent expansion phase
- 2010–2019: Sharp acceleration — peaks at 81 hires in the most recent year, with consistent 60+ hire years from 2016 onward
The trend confirms the organization shifted from steady-state to aggressive hiring in the 2010s decade, nearly tripling annual hire volume compared to the 2000s average.
Workforce Health KPIs (right card):
- Retention Rate: 93% — strong; industry benchmark for mid-large organizations typically sits at 85–90%, so 93% is above average
- Avg Salary: $114K — indicates a professional/knowledge-worker workforce, not entry-level labor
- Avg Bonus: 9% — moderate performance-linked compensation, typical of corporate white-collar roles
- Avg Tenure: 13 years — exceptionally high; suggests a loyal, experienced workforce with low voluntary attrition
- Avg Age: 45 — a mature workforce, which correlates with the 13-year tenure; this organization has retained people hired in their early 30s
Section 2 — Terminations
Summary KPIs (left card):
- Current year terminations: 85
- Prior year terminations: 78
- Variance: +7 (+9%) — terminations are rising YoY at a rate that warrants monitoring, even though absolute turnover rate remains low
New Exits per Year & Month (bar chart, 1990–2019):
- 1990–1999: Near-zero exits — 0 to 1 per year, consistent with a small or early-stage organization
- 2000–2009: Minimal, stable exits — 1 to 3 per year
- 2010–2019: Sharp spike — peaks at 20 exits in a single year, with 12 and 7 in adjacent years
The spike in exits in the most recent period mirrors the hiring surge — a larger workforce naturally produces more absolute terminations. However, the rate matters more than the count.
Termination Profile KPIs (right card):
- Turnover Rate: 0.8% — extremely low; this is an annualized figure and suggests voluntary/involuntary exits are well-controlled despite the absolute number increase
- Avg Salary of terminated employees: $104K — $10K below the active workforce average ($114K), suggesting the organization is not losing its highest-paid talent disproportionately
- Avg Bonus: 8% — slightly below active workforce (9%), consistent with the salary gap
- Avg Tenure of terminated employees: 5 years — significantly lower than active workforce tenure (13 years); exits are concentrated among relatively newer employees, not long-tenured staff
- Avg Age of terminated employees: 43 — close to active workforce avg age (45), so age is not a differentiating factor in who leaves
Key Insights
- The organization retains experienced talent but struggles with newer hires. Active workforce avg tenure is 13 years vs 5 years for terminated employees — the exit risk window is clearly the first 5 years of employment. Onboarding and early-career engagement programs are the highest-leverage retention investment.
- Hiring volume tripled in the 2010s but termination rate stayed at 0.8% — this means the organization successfully scaled headcount without proportionally scaling attrition. A strong indicator of organizational health and culture stability during a growth phase.
- Termination YoY variance of +9% (78 → 85) against headcount decline of -0.8% (922 → 915) means the organization is not backfilling all exits. If this trend continues, headcount will erode faster unless the hire rate accelerates again. HR should flag this as a leading indicator.
- $114K avg salary with 13-year avg tenure points to a highly specialized, experienced workforce. Replacing these employees is expensive — both in recruitment cost and institutional knowledge loss. The 93% retention rate is protecting significant organizational value.
- The Turnover Trend sparkline (top right, Terminations section) shows a volatile pattern with a recent uptick — despite the low 0.8% rate, the directional trend is worth tracking monthly rather than annually to catch inflection points early.
- Two-tab structure (Summary + HR Metrics) suggests the second tab contains ratio-level analysis — likely cost-per-hire, headcount by department, or compensation bands. The Summary page shown here is designed for CHRO/VP-level consumption; the HR Metrics tab likely serves HR operations teams.
Who This Template Is For
- HR Managers and CHROs who need a board-ready workforce summary combining hiring trends, attrition, and compensation benchmarks
- People Analytics teams building standardized HR reporting across a multi-decade employee dataset
- HR Business Partners monitoring headcount and turnover variance at the organizational level
How to Use
- Download the PBIX file
- Open in Power BI Desktop
- Connect your HR data source — the model requires an employee table with hire date, termination date, salary, bonus, tenure, and age fields
- All visuals, KPI cards, and trend lines update automatically
Soft CTA:
"Need to add a detailed headcount breakdown table with variance columns and conditional formatting by department or cost center? Flexa Tables is a Microsoft-certified Power BI visual purpose-built for structured tabular reporting."
Other Templates
 Free Human Resources
Power BI HR Analytics Dashboard Template (Free PBIX Download)
 Free Supply Chain & Logistics
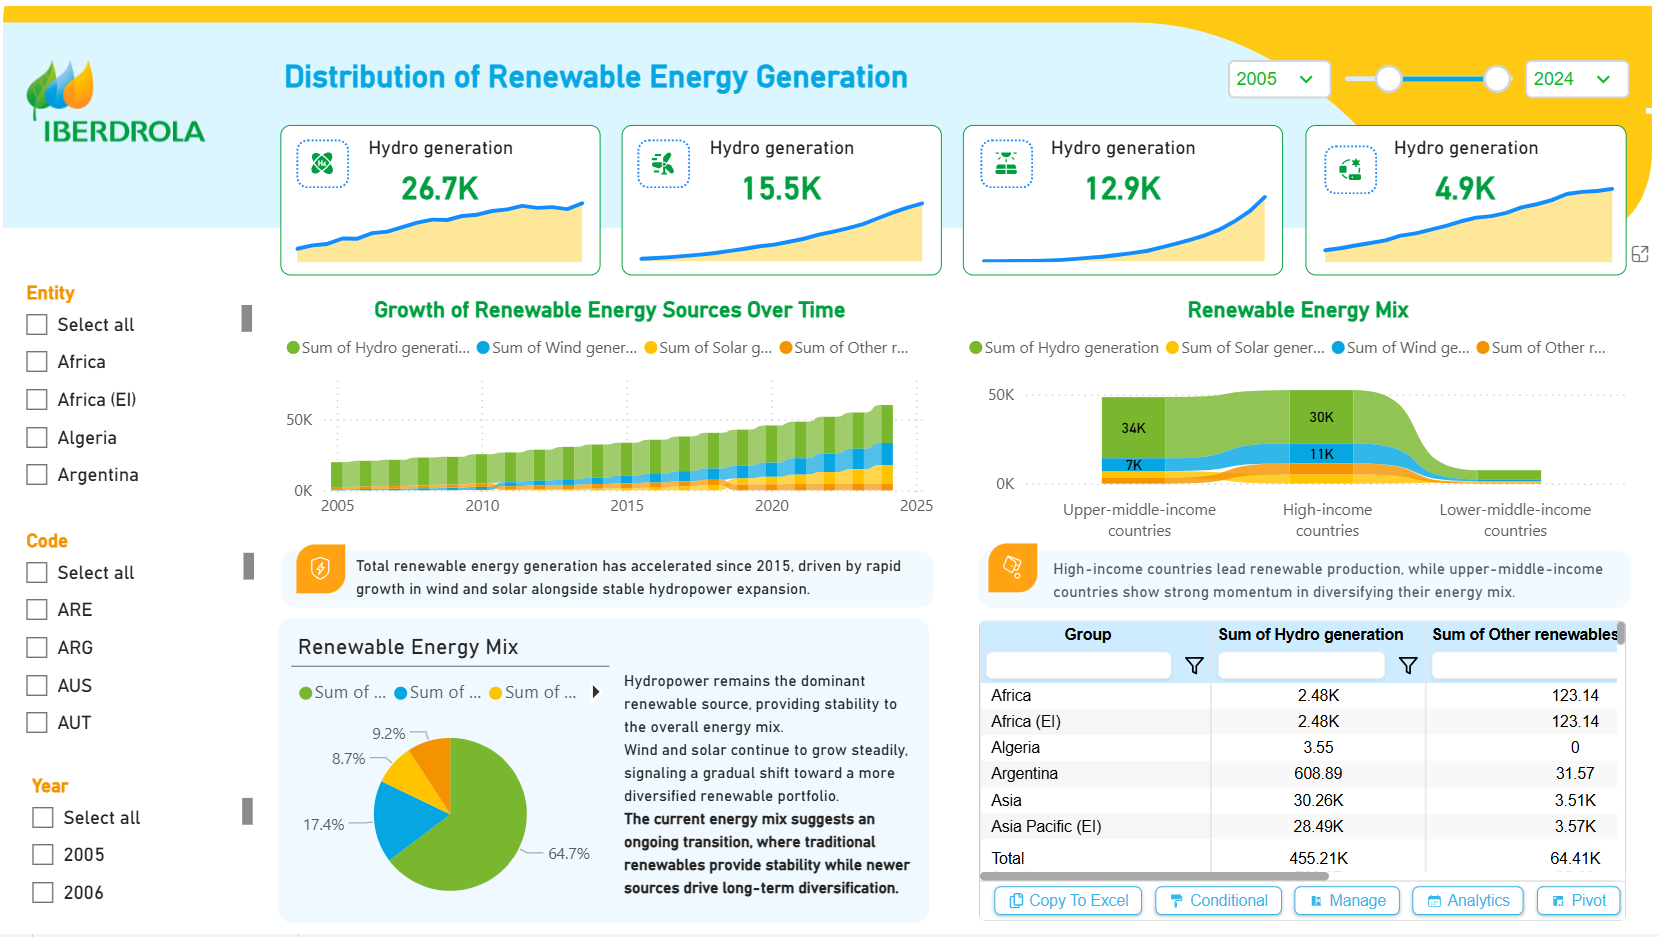
IBERDROLA Distribution of Renewable Energy Generation Dashboard – Key Insights (2005–2024)
 Free Sales & Revenue
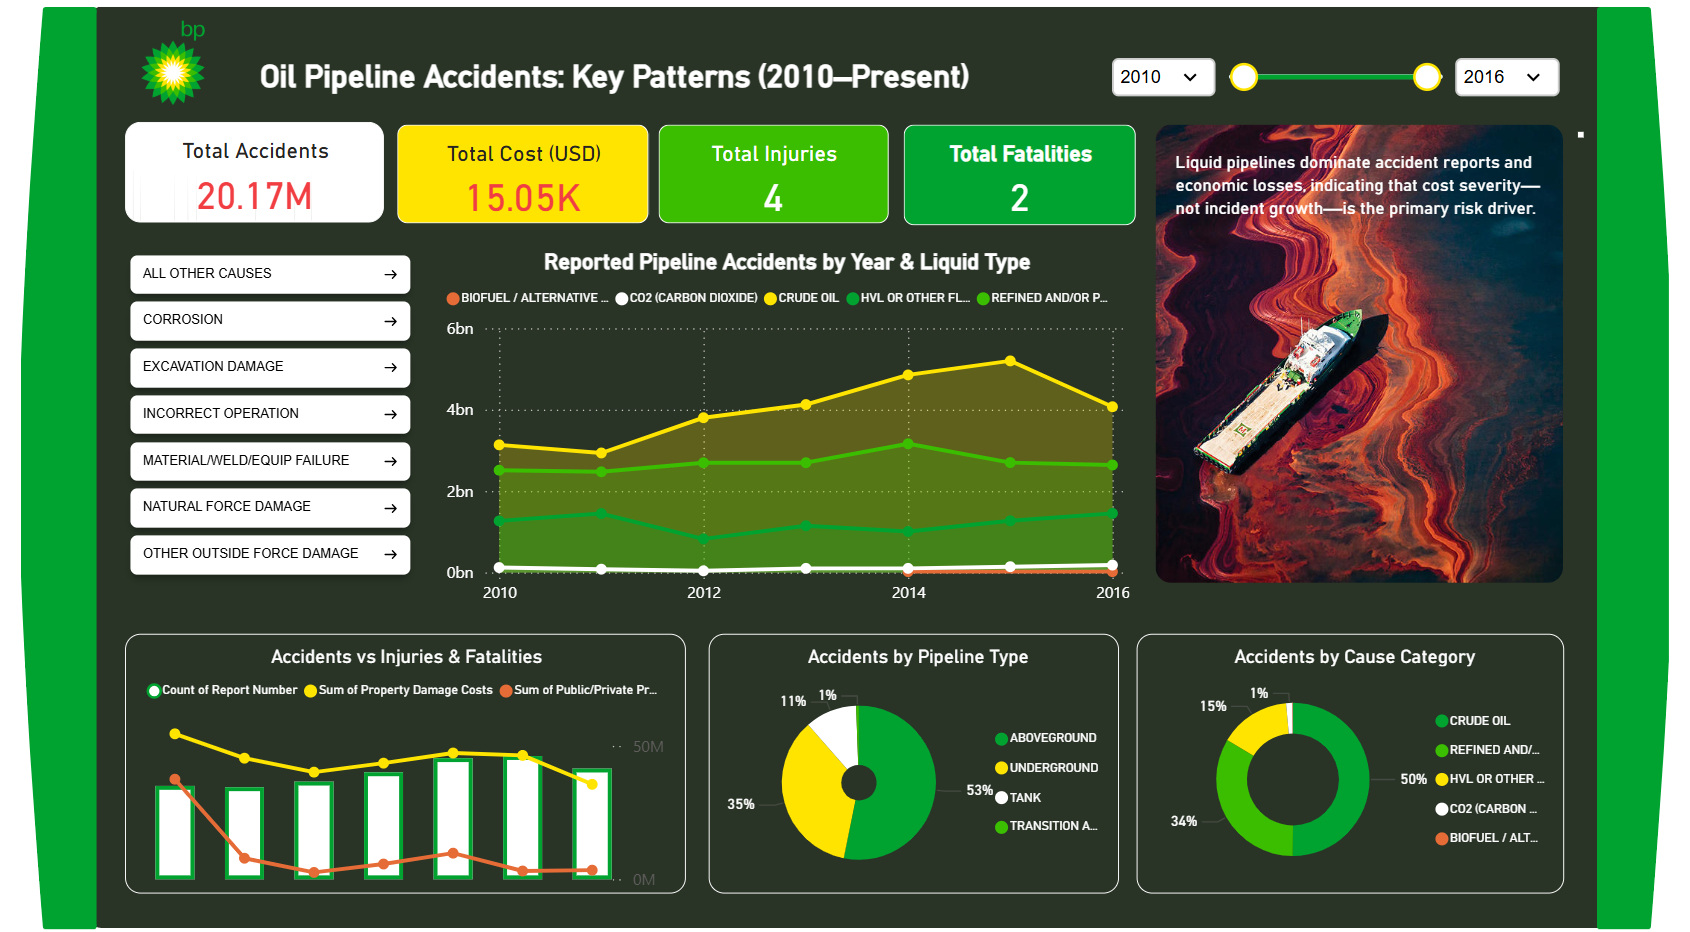
BP Oil Pipeline Accidents: Key Patterns (2010–Present) – Key Insights
If you find this website helpful, share it with friends and colleagues to boost their Power BI skills and work efficiency!
Like this site? Share it