
Inventory Control Dashboard – Stock, Turnover & Movement Analysis
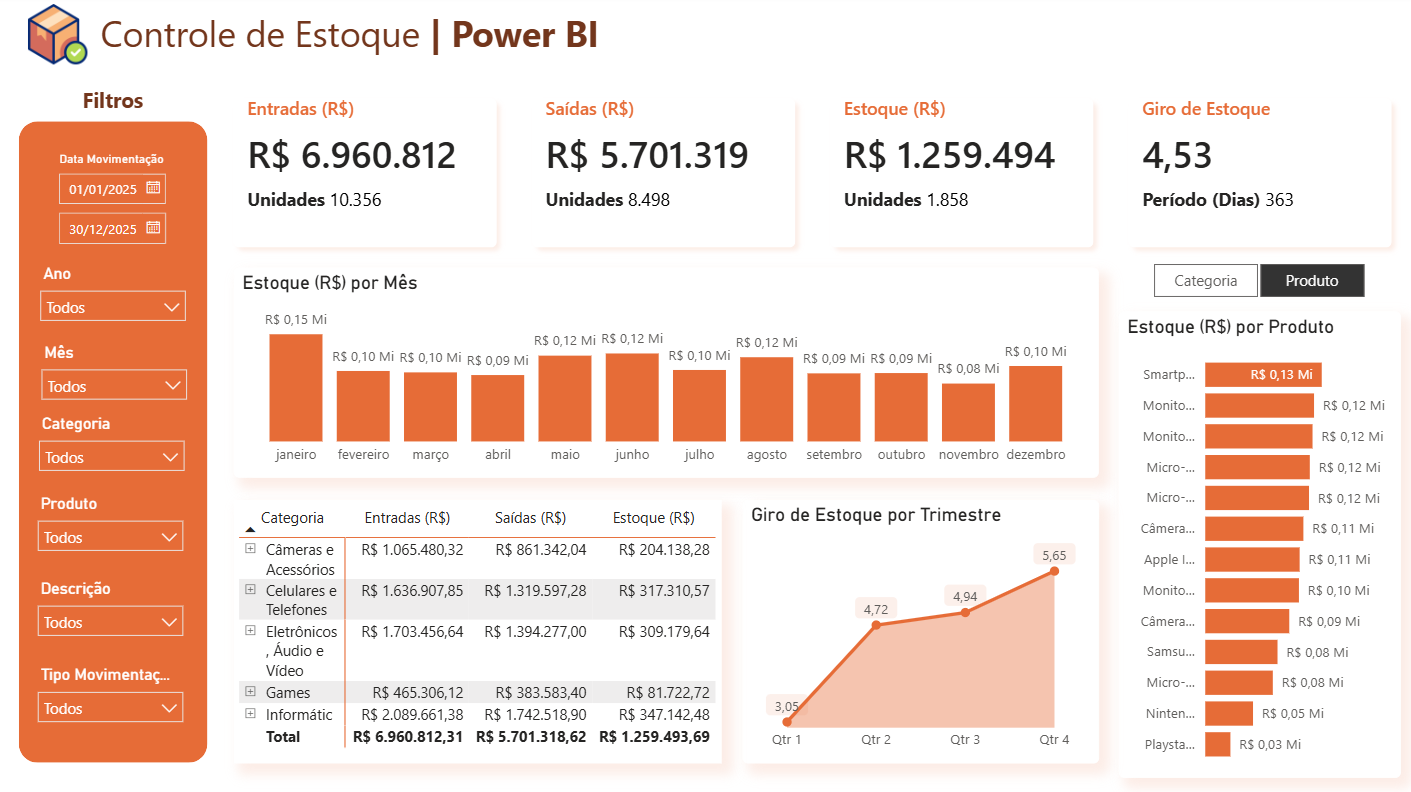
This Power BI Inventory Control Dashboard provides a complete view of stock movements, inventory value and turnover performance.
Designed for inventory, supply chain, operations and warehouse teams, the dashboard helps monitor inbound and outbound movements, understand current stock levels and identify products or categories with higher inventory concentration.
Key analyses included:
- Total inbound inventory value
- Total outbound inventory value
- Current inventory value
- Inventory units
- Stock turnover ratio
- Monthly inventory value
- Quarterly inventory turnover
- Inventory by product
- Inventory by category
- Inbound vs. outbound movements
- Detailed inventory movement analysis
- Product and category ranking
- Date, year, month, category and product filters
- Interactive inventory segmentation
The dashboard helps teams improve stock visibility, monitor inventory efficiency and identify opportunities to reduce excess stock or improve product turnover.
Ideal for warehouse management, retail, distribution, manufacturing, e-commerce, procurement and supply chain operations.
Reviews
No reviews yet — be the first to review this template.
Other Templates
If you find this website helpful, share it with friends and colleagues to boost their Power BI skills and work efficiency!
Like this site? Share it