
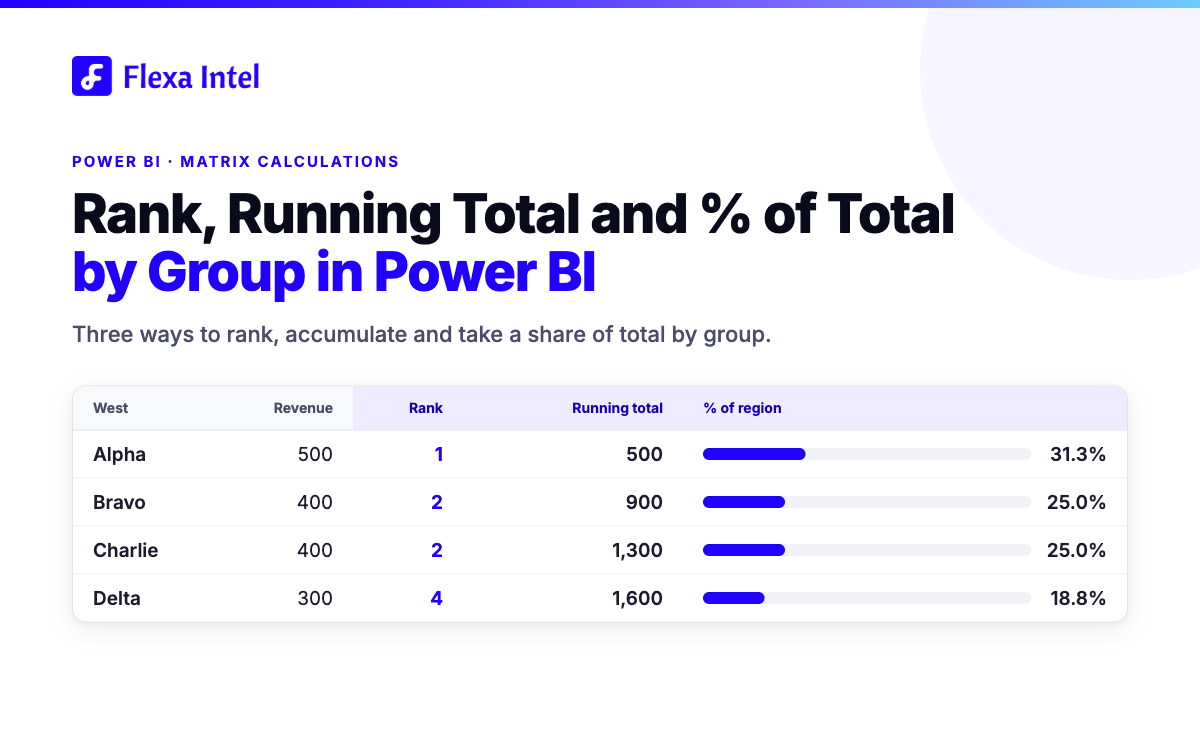
POWER BI · MATRIX CALCULATIONS
Rank, Running Total and % of Total by Group in Power BI
QUICK ANSWER
There are three ways to rank, accumulate and take a share of total by group in a Power BI matrix. DAX measures (RANKX, a CALCULATE running total, DIVIDE with ALLSELECTED) work in any visual, but each calculation is its own measure. Visual calculations are shorter, but the report author creates them in edit mode, so a reader of the published report cannot add one. Quick Calculations in Flexa Tables are picked per value column inside the visual, with no extra measure in the model. In all three, a rank or a running total needs a base measure, and in Flexa Tables the Total row stays blank for both.
IN THIS ARTICLE
1. Why each rank and share becomes another measure
2. The foundation all three approaches share
4. Approach 2: visual calculations
5. Approach 3: Quick Calculations in Flexa Tables
6. Ties, top 10 per group and the Total row
1. Why each rank and share becomes another measure
A matrix of Revenue by Region and Product invites three follow-up questions. Which products rank first in each region? How much of the region have the first few products added up to? What share of the region does each product carry?
Each one is a different calculation over the same number. In a classic model each becomes its own measure: one for the rank, one for the running total, one for the share of the parent, one for the share of the grand total. Repeat that for each metric in the report and the model fills up with measures that exist to read one number in a different way.
The question comes up on the Fabric Community forum under titles such as "Running Total with Matrix", "Cumulative of a measure based on Ranking" and "Percent of Total". The logic is not hard. What makes each version fiddly is the matrix context it has to survive: subtotals, slicers and the sort order the reader sees.
DAX MEASURES
Each calculation is a measure you write and keep in the model.
IN THE MODEL
fxRevenuefxRank in RegionfxRunning Total in Regionfx% of RegionIN THE TABLE
| Product | Revenue | Rank in Region | Running Total in Region | % of Region |
|---|---|---|---|---|
| Alpha | 500 | 1 | 500 | 31.3% |
| Bravo | 400 | 2 | 900 | 25.0% |
| Charlie | 400 | 2 | 1,300 | 25.0% |
4 measures, 4 value columns
QUICK CALCULATIONS IN FLEXA TABLES
The calculation is chosen on the value column.
IN THE MODEL
RevenueNothing else to write.
IN THE TABLE
| Product | Revenue Rank ↓ Down ⌄ |
|---|---|
| Alpha | 1 |
| Bravo | 2 |
| Charlie | 2 |
1 measure, the calculation switches from a list
Figure 1. Where the calculation lives. With DAX it sits in the model as one measure per column. In Flexa Tables it is chosen on the value column. Illustration, sample data.
2. The foundation all three approaches share
Each option below starts from one base measure and a matrix with Region and Product on rows, sorted by Revenue in descending order within each region:
Revenue = SUM ( Sales[Amount] )
The examples use the sample data below. It includes a tie on purpose (Bravo and Charlie in West). The matrix has Year on columns, filtered to 2026, because % of Grand Total in Flexa Tables needs a field in Columns as well as Rows.
| Region | Product | Revenue | Rank (ties skip) | Running total in region | % of region | % of grand total |
|---|---|---|---|---|---|---|
| West | Alpha | 500 | 1 | 500 | 31.3% | 16.9% |
| West | Bravo | 400 | 2 | 900 | 25.0% | 13.6% |
| West | Charlie | 400 | 2 | 1,300 | 25.0% | 13.6% |
| West | Delta | 300 | 4 | 1,600 | 18.8% | 10.2% |
| East | Echo | 600 | 1 | 600 | 44.4% | 20.3% |
| East | Foxtrot | 450 | 2 | 1,050 | 33.3% | 15.3% |
| East | Golf | 300 | 3 | 1,350 | 22.2% | 10.2% |
Figure 2. Sample data used in the examples: Revenue by Region and Product, with a tie in West (Bravo and Charlie).
The grand total is 2,950. The approaches agree on rank and shares. They differ in who has to write the calculation, who can change it later, and how the tied rows are treated in the running total (section 6).
WEST · EACH BAR SPANS THE REGION TOTAL OF 1,600
1Alpha· 500 = 31.3% of West · running total 500
2Bravo· 400 = 25.0% of West · running total 900
2Charlie· 400 = 25.0% of West · running total 1,300
4Delta· 300 = 18.8% of West · running total 1,600
Added by the rows above This product Rest of West
Figure 3. The West rows from Figure 2. The width of the blue part is the product's share of the region, and the bar ends where the running total stands. Bravo and Charlie tie at rank 2. Sample data.
3. Approach 1: DAX measures
WORKS IN ANY VISUAL
The default pattern is one measure per calculation. Each one hard-codes the grouping it works within, here Region and Product:
Rank in Region =
IF (
    HASONEVALUE ( Sales[Product] ),
    RANKX ( ALLSELECTED ( Sales[Product] ), [Revenue], , DESC, SKIP )
)

Running Total in Region =
VAR _rank = [Rank in Region]RETURN
    IF (
        HASONEVALUE ( Sales[Product] ),
        CALCULATE (
            [Revenue],
            FILTER ( ALLSELECTED ( Sales[Product] ), [Rank in Region] <= _rank )
        )
    )

% of Region =
DIVIDE (
    [Revenue],
    CALCULATE ( [Revenue], ALLSELECTED ( Sales[Product] ) )
)

% of Grand Total =
DIVIDE (
    [Revenue],
    CALCULATE ( [Revenue], ALLSELECTED ( Sales[Region], Sales[Product] ) )
)
A few details decide whether these behave:
ALLSELECTED keeps slicer selections, so the shares add up to what the reader sees. ALL ignores slicers and divides by the full model total.
The HASONEVALUE guard returns BLANK on subtotal and total rows. Without it, a total row would be ranked against the products beneath it.
RANKX skips after a tie by default (1, 2, 2, 4). Pass DENSE to get 1, 2, 2, 3.
The running total as written gives tied rows the same value: Bravo and Charlie both show 1,300, because both have a rank of 2 and the filter keeps rank 2 or better. Splitting ties needs a tie-breaker such as a second sort key.
This approach is explicit and easy to debug: one cell, one named measure, usable in any visual. The cost is the count and the lock-in. That is four measures for Revenue, so twelve once Cost and Profit need the same treatment (a calculation on the example, not a benchmark). Each measure also hard-codes Region and Product. If a reader wants the same ranking by Product within Month, someone edits DAX and republishes.
4. Approach 2: visual calculations
CREATED IN EDIT MODE
Power BI has its own answer to this. A visual calculation is a DAX calculation defined and run on a visual instead of being added to the semantic model. It refers to what is already on the visual, so it does not depend on filter context, and it knows the visual's structure. For the same matrix:
Running Total in Region = RUNNINGSUM ( [Revenue], HIGHESTPARENT )

% of Grand Total = DIVIDE ( [Revenue], COLLAPSEALL ( [Revenue], ROWS ) )

% of Region = DIVIDE ( [Revenue], COLLAPSE ( [Revenue], ROWS ) )
RUNNINGSUM with HIGHESTPARENT starts the running total again for each region. Ranking uses the RANK function, which takes the same SKIP and DENSE tie options as RANKX and can be reset at the parent level so the rank stays inside each region. Each calculation is a single line, and none of them names the Sales table or its relationships.
It is a fair alternative to a measure. Two limits matter for who owns the view:
The report author creates it. Visual calculations are added while editing the report. Someone reading a published report cannot add a running total or a rank of their own.
It lives on one visual. A calculation is not a model object, so a card, a chart or another matrix cannot reuse it. Those need their own copy, or a measure.
That makes visual calculations a good fit when one author builds one matrix and decides which calculations it carries.
5. Approach 3: Quick Calculations in Flexa Tables
PICKED PER VALUE COLUMN
Flexa Tables, a Microsoft-certified custom visual on AppSource, has a tab called Quick Calculations. It turns a value column into a share, a running total, a rank or a movement against a baseline. The choice is made per value column, so one table can show an amount in one column and a share in the next, with no second measure in the model. The Flexa Tables documentation lists each option.
To set it up on the sample matrix:
Figure 4. The Quick Calculations tab with the calculation list open on a value column. Illustration based on the Flexa Tables interface.
Each calculation reads the table the way the reader sees it: down a group of sibling rows or along the columns of a row, after the active filters. What each one returns in the sample matrix:
| Quick Calculation | What it returns in the sample matrix |
|---|---|
| Rank ↓ Down | The product's position by Revenue within its region, largest to smallest by default, with a choice of how ties are numbered (section 6) |
| Running Total ↓ Down | Revenue added up in the order shown, so each row adds the ones above it and the last row of each region arrives at that region's total |
| % of Parent Row ↓ | The product's share of its own region (Alpha is 31.3% of West). It needs a row hierarchy of at least two fields |
| % of Grand Total | The product's share of the whole table (Alpha is 16.9% of 2,950). It needs fields in both Rows and Columns |
There are also % of Row Total → and % of Column Total ↓, a → Across direction for Rank and Running Total, and Diff From, which compares a value with the previous or first row. Diff From is covered in How to Show Variance in a Power BI Table. A percentage can also print the amount beside the ratio (Value + Percent).
GOOD TO KNOW
Running Total follows the displayed sort order, so re-sorting the table re-accumulates it, while a Rank does not move when you re-sort. A blank value carries the running figure forward rather than breaking the curve.
What this removes: the extra measure per calculation. Rank, running total and both shares come from one Revenue measure, and a second metric such as Cost gets the same options without new DAX. What it does not remove: the base measure and a sensible model underneath it. The calculations also live inside the visual, so a card or chart elsewhere in the report that needs the same rank still needs a measure or a visual calculation of its own. Flexa Tables works in the published report and does not need DAX for these calculations. For the pivoting side of the same visual, see pivot tables in Power BI.
FLEXA TABLES · 30-DAY FREE TRIAL
Rank, running total and % of total without a measure per calculation
Pick the calculation on the value column of your Power BI table. Install from Microsoft AppSource.
Start free trial on AppSource →See the demo6. Ties, top 10 per group and the Total row
Three details decide whether a rank report can be trusted.
Ties. West has two products at 400. How they are numbered changes the numbers below them:
| REVENUE | COMPETITION | DENSE | UNIQUE |
|---|---|---|---|
| 500 | 1 | 1 | 1 |
| 400 | 2 | 2 | 2 |
| 400 | 2 | 2 | 3 |
| 300 | 4 | 3 | 4 |
The shaded rows are the tie.
Figure 5. The four West rows numbered three ways. Sample data.
Competition numbering (1, 2, 2, 4) is how Excel RANK and DAX RANKX number ties, and it is the default in RANKX. Dense (1, 2, 2, 3) is one keyword away in DAX. Unique numbering needs a tie-breaker in DAX, such as a second sort key. Flexa Tables offers all three as a method on the Rank line. Decide which one your readers expect before you publish: a "rank 3 or better" filter keeps three rows in West under Competition or Unique, and four under Dense.
Figure 6. The Rank line in Quick Calculations with the three tie methods open. Illustration based on the Flexa Tables interface.
Running total on tied rows. A running total adds up in the order shown, so the tied rows get different values: 900 for Bravo and 1,300 for Charlie. The DAX measure in section 3 filters on rank instead of position, so it shows 1,300 on both. Neither is wrong, but they disagree, and a reader comparing two reports will notice.
Top 10 per group. The usual request is "the ten best products in each region", not "ten rows in total". The Top N filter in the Filters pane ranks one field across the visual rather than inside each region, so per-group top 10 in DAX means a rank measure like the one in section 3 plus a filter on it.
In Flexa Tables, set the value column to Rank and filter the Rank column header to 10 or less. Each rank is calculated within its own group, and the header filter keeps the rows whose printed number matches, so the filter keeps each region's top 10 rather than the top 10 rows of the table. One consequence is documented: the rows that survive the filter are not re-ranked or re-accumulated, so a Running Total column next to a filtered Rank still shows the figure from before the filter.
The Total row. A rank or a running total of a total is not a meaningful number, so Flexa Tables leaves it empty. The percentage modes fill in the grand-total row, while Running Total, Rank and Diff From leave it blank: a running total has already reached the full figure in the last row, and a rank has nothing to rank the total against.
| Revenue | Rank | Running total | % of grand total | |
|---|---|---|---|---|
| Golf (last East row) | 300 | 3 | 1,350 | 10.2% |
| Total row | 2,950 | blank | blank | filled in |
Figure 7. What the Total row shows in the sample matrix: blank for Rank and Running total, filled in for a percentage mode. Sample data.
LIMIT
The DAX measures in section 3 return BLANK on the Total row through the HASONEVALUE guard. If your report needs a number there, it needs a different calculation, not a rank.
7. Which approach fits your report
DAX measures
CREATED BY
Model author
REUSABLE
In any visual
BEST FIT
Numbers that cards and charts share, with a stable grouping
Visual calculations
CREATED BY
Report author, in edit mode
REUSABLE
No, lives on one visual
BEST FIT
One matrix built and owned by one report author
Quick Calculations
CREATED BY
Picked on the value column inside the visual
REUSABLE
No, lives inside the visual
BEST FIT
Tables that need the same few calculations across many value columns
The approaches combine well. Keep a measure for any number a card or chart needs, and use Quick Calculations in the table where readers rank, accumulate and compare. For the comparison side of the same problem, see Calculation Groups vs Separate Measures for Variance in Power BI, and for the variance columns built into the visual, variance analysis in Power BI.
8. Related guides
9. FAQ
How do I rank within a group in Power BI?
Use RANKX over ALLSELECTED of the inner field, so the outer group's filter stays in place. In a visual calculation, use RANK and reset it at the parent level.
How do I get a running total that resets for each group?
In a visual calculation, use RUNNINGSUM with a reset such as HIGHESTPARENT. In a measure, add up the rows that sort at or before the current one inside the group.
What is the difference between % of parent total and % of grand total?
% of parent total divides a value by the total of its own group, such as a product's share of its region. % of grand total divides it by the total of the whole table.
How are ties handled in a Power BI rank?
RANKX skips after a tie by default, giving 1, 2, 2, 4. DENSE gives 1, 2, 2, 3. Unique numbering needs a tie-breaker such as a second sort key.
Does the Total row show a rank or a running total in Flexa Tables?
No. In Flexa Tables, Rank and Running Total leave the grand-total row empty, while the percentage modes fill it in.


