
Power BI for Consultants: Building Client Reports That Stay Self-Service (2026)
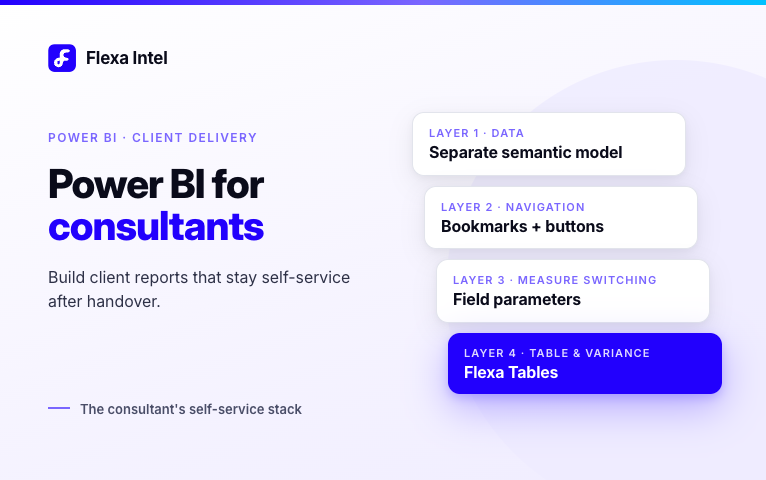
The highest-leverage thing a Power BI consultant can do for a client — and for their own time — is build reports that Finance can actually maintain after handover. That means: a separate semantic model, bookmarks for standard views, field parameters for measure switching, and Flexa Tables for self-service variance and pivot. When clients can add their own MoM/YoY columns and restructure table layouts themselves, the most common post-delivery change requests stop entirely.
Every Power BI consultant has had this experience: you deliver a polished report, the client loves it, handover goes smoothly. Three weeks later, the first change request arrives. Then another. By month two, you're spending 20% of your time on changes that should be taking the client 30 seconds each.
The problem is almost never a client training issue. It's a design issue. Native Power BI reports lock their layout and variance configuration at publish time — clients can filter and drill, but they can't restructure the table or add a variance column themselves. Every layout change that Finance needs has to go through the developer.
This guide covers how to design client deliverables that minimize post-delivery requests without compromising report quality or data governance.
The Root Cause of Post-Delivery Change Requests
Most ongoing change requests from Finance clients fall into three categories:
"Can you add a column showing this month vs last month?" — Variance columns require DAX in native Power BI. Client cannot add them post-publish.
"Can you restructure this table to show by Division instead of Department?" — Matrix layout is locked post-publish. Client cannot drag fields themselves.
"Can you add a view for the CFO that only shows the top-level summary?" — Requires a new bookmark or new report page. Client cannot create bookmarks without Editor access and training.
Requests 1 and 2 are the most frequent — and both are solvable at the design stage without any ongoing consultant involvement if you add the right tool to the report.
The Consultant's Self-Service Stack
The goal is not to eliminate client dependency on the consultant entirely — genuine data model changes, new data sources, and complex DAX always need a developer. The goal is to eliminate the low-value dependency: layout changes and period comparisons that Finance should own.
Separate semantic model
Publish the dataset independently from the report. Reports connect via Live Connection. When the model needs updating, only the dataset is republished — connected reports update automatically.
Eliminates: dataset republish breaking report connections
Bookmarks + button navigation
Configure 3–5 standard views as bookmarks (board summary, department detail, GL drill). Add a button navigation bar. Finance switches between views with one click.
Eliminates: "can you set up a view for the CFO" requests
Field parameters
Let Finance switch which measure is displayed (Revenue, Margin, EBITDA, Headcount) using a slicer — without DAX or Desktop. One setup, infinite flexibility.
Eliminates: "can you show margin instead of revenue" requests
Flexa Tables
Add drag-and-drop table restructuring and one-click MoM/YoY/Budget vs Actuals variance directly in the published report. Finance adds and removes columns themselves.
Eliminates: variance columns + layout restructuring requests
With all four layers in place, the change requests that remain are genuinely developer-level: new data sources, new calculated measures, row-level security changes, or structural model changes. Those belong on a retainer or project scope — not on your calendar every Monday morning.
What to Deliver — The Complete Consultant Handover
| Deliverable | Who maintains it after handover | How to set it up |
|---|---|---|
| Semantic model (dataset) | Consultant (on retainer or project basis) | Publish dataset separately in Power BI Service. Client admins manage access, consultant handles model changes. |
| Published reports + bookmarks | Client (Viewer access) with bookmark navigation | 3–5 bookmarks configured, button nav bar on canvas, client switches views independently. |
| Flexa Tables visual | Client Finance team — fully self-service | Installed from AppSource in the report. Finance drags fields and adds variance themselves. |
| Data dictionary | Client reads, consultant updates on model changes | One page per key measure: definition, formula logic, data source, refresh schedule. |
| Handover video (15–20 min) | Client watches, shares internally | Screen recording covering: slicer use, bookmark switching, Flexa Tables variance and layout, export to Excel. |
| Self-service boundary guide | Finance keeps as reference | One-page doc: what Finance can do themselves (Flexa Tables, slicers, bookmarks) vs what needs a consultant ticket (new data, new DAX measures). |
| Workspace access transfer | Client IT admin manages | Add client as workspace Admin. Remove consultant access or downgrade to Member after handover period. |
The Handover Process — Step by Step
- 1
Confirm workspace ownership transfer 2 weeks before delivery. Identify who at the client will be workspace Admin (usually IT or a senior BI analyst). Add them now so they have time to verify access. Do not wait until the day of handover.
- 2
Document all data connections. List every data source, the authentication method, who owns the credentials, and the refresh schedule. Include what breaks if credentials expire. This single document eliminates the most common post-handover panic: "the report stopped refreshing."
- 3
Record the handover video before the live session. A 15–20 minute screen recording covering the report end-to-end is more valuable than the live session — Finance users watch it repeatedly, share it with new team members, and reference it when they forget how something works. Record it in the final report, not a demo version.
- 4
Run a 30-minute live session with Finance users — not IT. IT does not use the report. Finance does. Run the handover session with the actual report consumers. Cover: slicer use, bookmark switching, how to use Flexa Tables to add variance and restructure the table, and what to do if something looks wrong.
- 5
Define the post-handover support model clearly in writing. Ambiguity about what is included post-delivery leads to unpaid work. State explicitly: what is covered (bug fixes for 30 days), what is not (new features, new data sources), and how to raise a request (email, not Slack).
- 6
Schedule a 4-week check-in call. A 30-minute call at the 4-week mark catches the most common post-delivery issues before they become urgent. It also surfaces new requirements that become the next project scope — rather than scope creep on the current one.
Building Repeatable Report Templates
The most efficient consultants build once and reuse across clients. A well-structured Power BI template file (.pbit) with your standard layout, colour scheme, and Flexa Tables pre-installed can cut initial build time by 30–40% on Finance reporting engagements.
What to include in your Finance reporting template
- Standard page layout with slicer panel (date, department, scenario) on the left
- Flexa Tables visual pre-configured on the main report page
- Bookmark navigation bar with placeholder bookmarks (Board Summary, Detail, GL Drill)
- Colour theme file (
.json) matching your or the client's brand - Placeholder measures for common Finance calculations (MoM, YoY, Budget vs Actuals) that clients connect to their own data
- A "Template Guide" page in the report explaining what each section does — visible to the client in Desktop, hidden in Service
Flexa Tables in client templates: At $2.99/user/month with no minimum users and no annual commitment, Flexa Tables is practical to include in every Finance client engagement regardless of team size. A 3-person Finance team adds $8.97/month — typically absorbed in the first avoided change request. No enterprise contract, no vendor approval process, installs from AppSource in 2 minutes.
Handling the Custom Visual Licensing Conversation
When recommending custom visuals to clients, licensing is the most common objection. Here is how to handle it clearly:
For Flexa Tables ($2.99/user/month)
Position it as an infrastructure cost, not a tool cost. "This replaces roughly one change request per month — at your internal rate, that's worth more than the annual license for your entire Finance team." For a 5-user Finance team, the annual cost is $179.40. A single junior developer hour typically costs more than that.
For clients who resist all third-party visuals
Some enterprise clients have IT policies blocking AppSource installs or third-party visual approvals. In that case, use Analyze in Excel as the self-service fallback — it connects the Power BI dataset to an Excel PivotTable without any custom visual. Clients get pivot flexibility, you avoid the licensing conversation.
Always check the client's Power BI tenant settings before proposing custom visuals. Some organizations have AppSource installs blocked at the tenant level — custom visuals must be approved by IT before they appear in Desktop. Flag this during the discovery phase, not at delivery.
Flexa Tables — The Practical Addition to Every Finance Client Engagement
Add Flexa Tables to client reports once — Finance handles variance and layout changes themselves from that point on. No minimum users, no annual commitment, installs from AppSource in 2 minutes.
- Eliminates the most common post-delivery change requests
- Drag and drop table restructuring in Power BI Service — no Desktop
- MoM, YoY, Budget vs Actuals variance — one click, no DAX
- $2.99/user/month — no minimum, monthly billing available
- Microsoft-certified — passes enterprise AppSource review
- Free trial available for client demos
What Should Still Be on a Retainer
Even with the full self-service stack in place, these categories genuinely need ongoing consultant involvement:
- New data sources — connecting to a new ERP, CRM, or database requires Power Query work and data model changes
- New calculated measures — new KPIs or complex ratio metrics that don't exist in the model require DAX in Desktop
- Row-level security changes — as the org chart changes, RLS rules need updating
- Performance optimization — as data volumes grow, slow reports need DAX and model-level fixes
- Semantic model schema changes — when source systems change column names or add new tables
- New report pages for genuinely new analysis — strategic or regulatory requirements that weren't in the original scope
This is a shorter list than most consultants expect — which is the point. When the routine work moves to the client, the retainer scope becomes genuinely interesting work.
Frequently Asked Questions
What should Power BI consultants deliver to clients?
A complete deliverable includes: published semantic model as standalone dataset, published reports with bookmarks configured, Flexa Tables for self-service variance, data dictionary, handover video, self-service boundary guide, and workspace access transfer. The goal is a report Finance can actually maintain after handover.
How do Power BI consultants handle ongoing change requests?
By building reports that minimize post-delivery changes through self-service design: bookmarks for standard views, field parameters for measure switching, and Flexa Tables for table restructuring and variance. When clients handle routine changes themselves, the retainer scope shrinks to genuine data model work.
What custom visuals should Power BI consultants include in client reports?
For Finance-focused reports: Flexa Tables ($2.99/user/month, no minimum, Microsoft-certified) for self-service variance and pivot table restructuring. For IBCS-compliant enterprise reporting: Zebra BI. For basic needs: native visuals only — avoid adding unnecessary licensing complexity.
How do Power BI consultants structure pricing for ongoing support?
Project-based for the initial build, retainer for genuine model changes. The best model: give clients self-service tools at handover so routine changes disappear, making the retainer scope smaller and more valuable.
What is the difference between a Power BI consultant and a Power BI developer?
A developer focuses on technical implementation. A consultant translates business requirements, advises on architecture, and manages client relationships alongside the technical work. Most independent consultants do both.
How do you hand over a Power BI report to a client?
Transfer workspace ownership, document all data connections, record a handover video, run a 30-minute session with Finance users (not IT), define the post-handover support model in writing, and schedule a 4-week check-in. Full steps above.


