Celebrating 10 Years of Power BI: A Journey of Transformation and My Contest Entry
Hello Power BI Community!
As we celebrate 10 amazing years of Power BI since its launch in 2015, I’m excited to share insights from my submission to Microsoft’s Power BI 10-Year Celebration Contest. Having used Power BI since 2009 (even before its official release!), I’ve witnessed its incredible evolution, and this contest is the perfect way to honor that journey. Let me walk you through my dashboard, how I built it, and the stories it tells, along with a heartfelt thank you to the Power BI team!
A Decade of Digital Evolution
Power BI has come a long way since its early days. I’ve been using it since 2009 (even before the official release!), watching it grow from a simple reporting tool into a powerhouse for interactive dashboards and real-time insights. Over the past 10 years, it’s empowered businesses worldwide to make smarter decisions, and I’ve been lucky to be part of that journey.
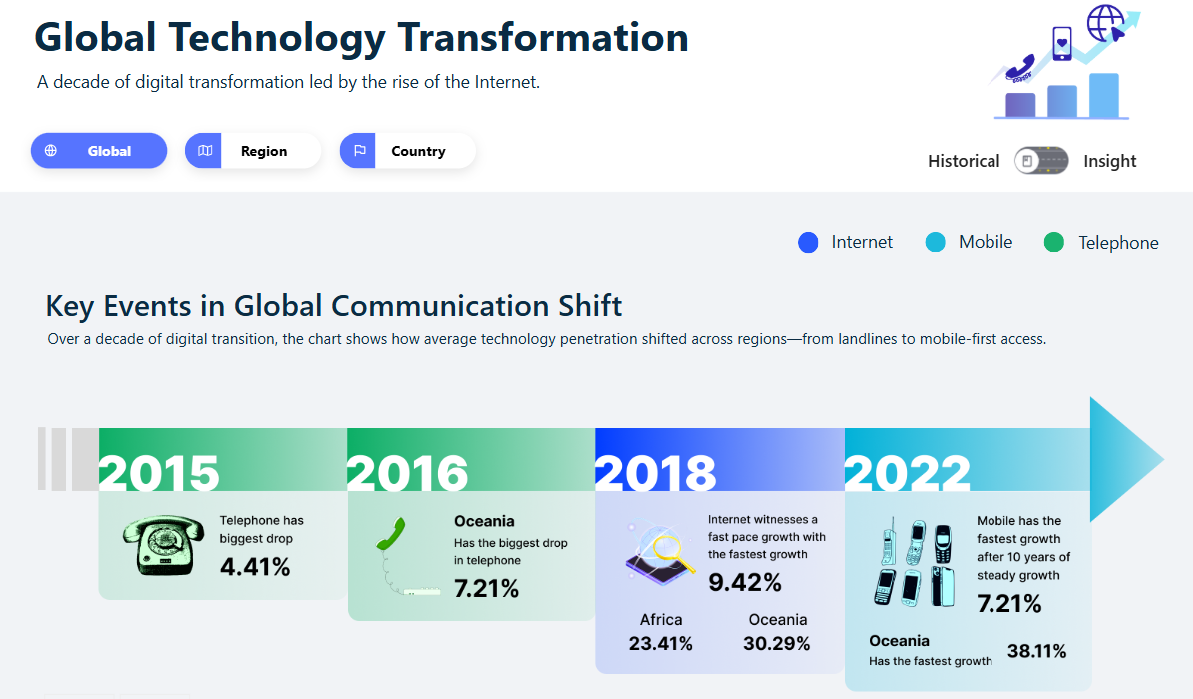
My Power BI report dives into the adoption trends of Internet, Mobile, and Telephone from 2010 to 2022, measured per 100 people, across Global, Regional, and Country levels. Inspired by the contest theme of "Global Technology Adoption - A Decade of Digital Shift" I structured the dashboard to offer two key perspectives at each level:
- Historical View: A long-term trend analysis using timelines to showcase the steady rise in connectivity over the decade.
- Insight View: A deep dive into growth rates, digital divides, and key contributors, brought to life with growth analytics, and dynamic rankings.
Key Insights from the Data
- Global Growth Trends: The historical view shows a remarkable increase in mobile adoption, surpassing 100 per 100 people by 2020, reflecting the smartphone boom. Internet adoption grew steadily but lags in some regions, hinting at persistent infrastructure challenges.
- Regional Digital Divide: The insight view uncovers stark contrasts—North America and Europe lead in Internet penetration, while parts of Africa and Asia show slower growth, emphasizing the need for targeted investments.
- Country-Level Highlights: Dynamic rankings reveal countries like South Korea and Norway as tech adoption leaders, while others show rapid catch-up (e.g., India’s mobile growth), offering a narrative of progress and opportunity.
How I Built the Dashboard
To bring this vision to life, I leveraged Power BI’s evolution over the decade:
- Interactive Design: I used buttons and bookmarks to create a seamless navigation experience, allowing users to switch between Global, Regional, and Country views effortlessly.
- Quick Variance Analysis: Built-in tools helped me highlight year-over-year (YoY) growth rates, making it easy to spot acceleration points (e.g., mobile adoption spikes in 2015-2017).
- Post-Publish Exploration: Powered by Flexa Intel visuals—Flexa Tables, Flexa Design, and Flexa Charts
The process was iterative: I started with raw adoption data, shaped it with Power BI’s modeling tools, and enhanced it with Flexa Intel visuals for clarity and impact. The result is a dashboard that turns complex datasets into compelling stories.
Turning Data into Stories
This report isn’t just numbers, it’s a narrative of progress. The timelines show how technology has connected the world, the diagrams reveal inequalities to address, and the rankings inspire action. It’s a tribute to how Power BI, with tools like Flexa Intel’s, empowers us to highlight patterns and drive change.
A Heartfelt Thank You
As we celebrate 10 years of Power BI, I want to extend my deepest gratitude to the Microsoft team and the Power BI community. Your innovation and support have made this platform a cornerstone of data analytics. To the developers, designers, and supporters behind Power BI—thank you for a decade of tools that turn data into decisions. Here’s to many more years of transformation!
Your Thoughts?
Check out my contest post on LinkedIn here: linkedin.com/in/dangtroy. I’d love to hear your feedback or your own Power BI milestones! What insights have you uncovered in the past 10 years? Share below!


