Vestas Renewable Energy Trends Across Regions Dashboard – Key Insights (2000–2021)
1258 Downloads
Description
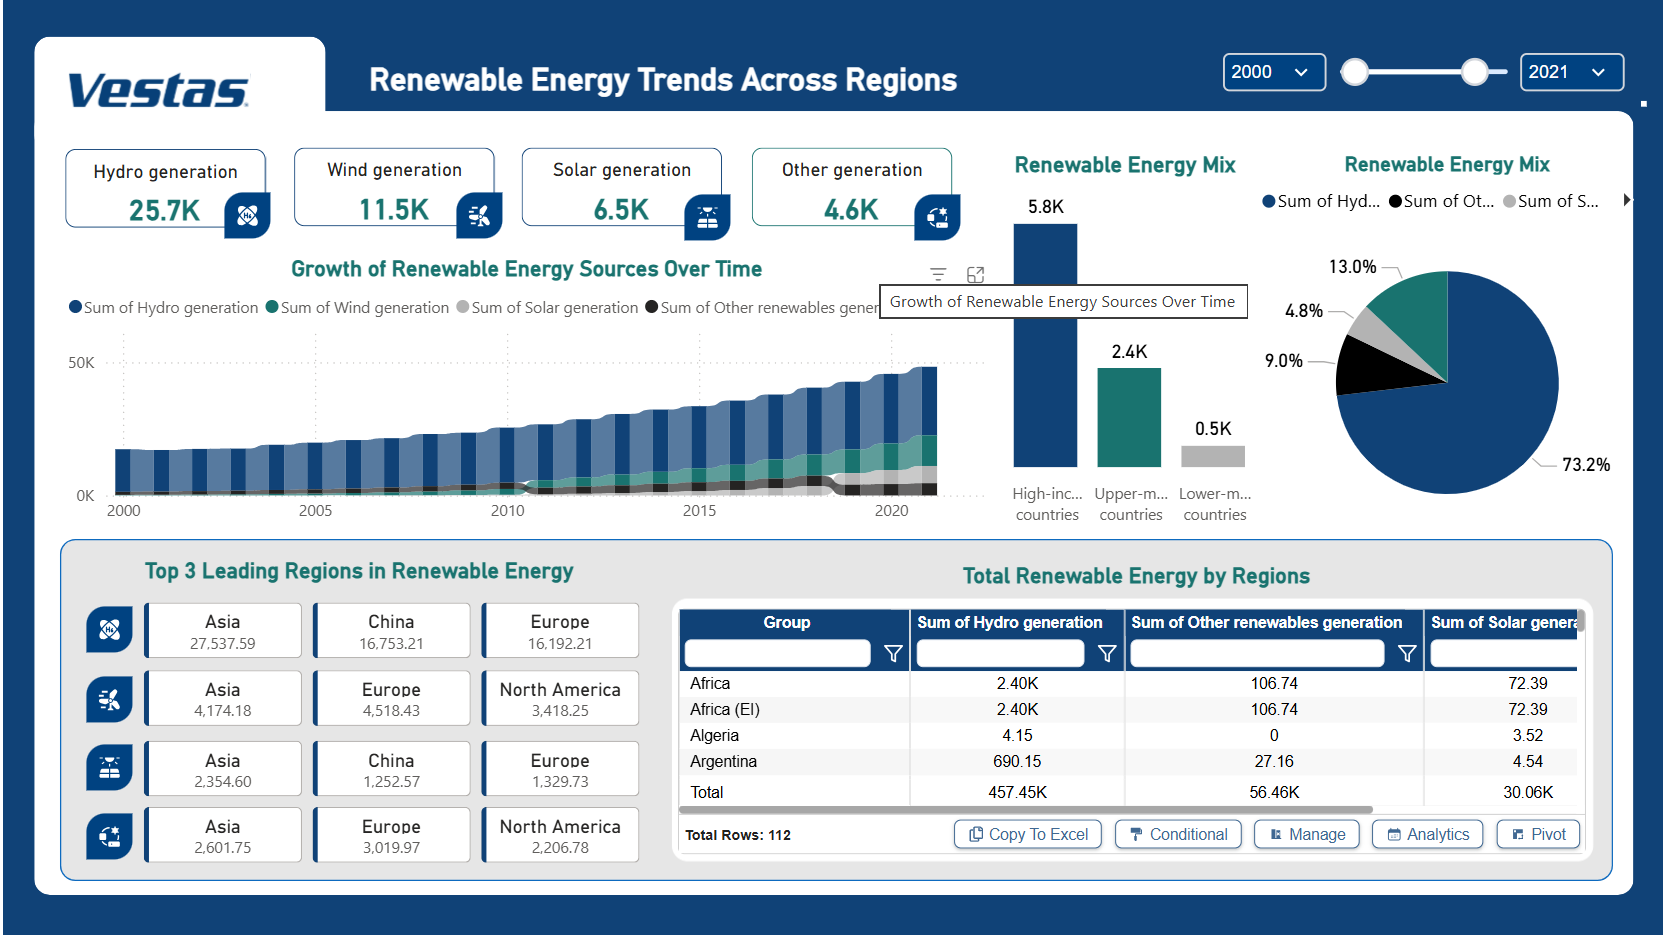
Overall Capacity (2021)
- Total Renewable Generation: ~44K (likely GW)
- Hydro: 25.7K (58%)
- Wind: 11.5K (26%)
- Solar: 6.5K (15%)
- Other renewables: 4.6K (10%)
Renewable Energy Mix
- Hydro: 73.2% (dominant source)
- Wind: 13.0%
- Other: 9.0%
- Solar: 4.8% → Hydro remains the clear backbone, but wind and solar are gaining share.
Growth Trend Over Time
- Steady exponential growth since 2000, accelerating post-2010.
- Hydro (dark blue) historically led, but wind (green) and solar (gray) show rapid recent expansion.
- Total capacity grew from near zero in 2000 to ~44K by 2021.
Top 3 Leading Regions by Source
| Rank | Hydro | Wind | Solar | Other |
| 1 | Asia (27.5K) | Asia (4.7K) | Asia (2.4K) | Asia (2.6K) |
| 2 | China (16.8K) | Europe (4.5K) | China (1.3K) | Europe (3.0K) |
| 3 | Europe (16.2K) | North America (3.4K) | Europe (1.3K) | North America (2.2K) |
→ Asia (especially China) overwhelmingly leads in hydro and solar; Europe is strong in wind and "other" renewables.Income Group Breakdown
- High-income countries: 5.8K (dominant bar)
- Upper-middle-income: 2.4K
- Lower-middle-income: 0.5K → Wealthier nations drive the majority of capacity.
Key Takeaways
- Asia/China Dominance: Asia accounts for the largest share across nearly all renewable sources, with China alone leading in hydro and solar.
- Hydro Reliance: Despite fastest growth in wind and solar, hydro still comprises ~73% of the mix – providing stable baseload but limiting diversification.
- Developed World Leadership: High-income countries hold the bulk of capacity, reflecting capital, policy, and infrastructure advantages.
- Emerging Growth: Wind and solar show the steepest recent trajectories, driven by cost declines and scalability.
- Regional Specialization: Asia excels in scale (hydro/solar), Europe in diversity (wind/other).
Recommendations
- Diversify Beyond Hydro: Accelerate wind and solar deployment to reduce hydro dependency and improve grid flexibility/resilience.
- Focus on Asia Partnerships: Collaborate with China and broader Asia for supply-chain dominance and fastest growth opportunities.
- Support Emerging Markets: Increase financing and technology transfer to upper/lower-middle-income countries to boost their modest shares.
- Leverage Europe/North America Strengths: Scale proven wind and "other" renewable models globally.
- Policy Alignment: Promote storage and grid upgrades to integrate higher shares of variable wind/solar while maintaining hydro's reliability.
Overall: Strong, Asia-led growth in renewables with hydro still dominant, but wind and solar rapidly transforming the mix – high-income regions lead, offering clear pathways for accelerated global transition through targeted investment and diversification.
Other Templates
 Free Supply Chain & Logistics
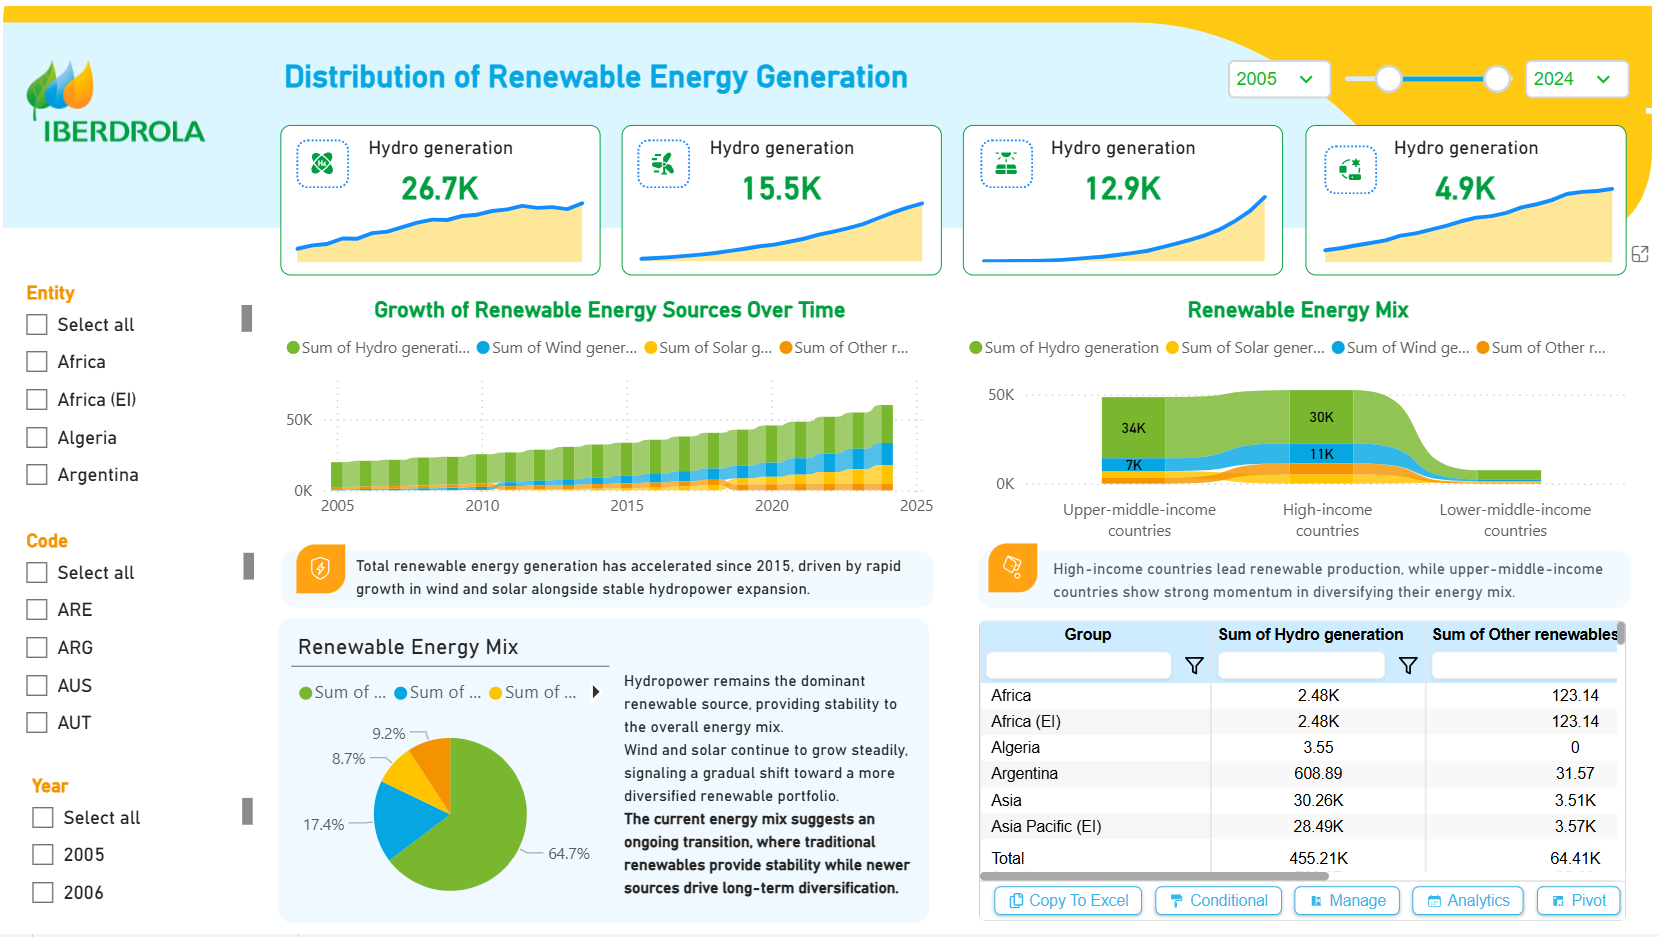
IBERDROLA Distribution of Renewable Energy Generation Dashboard – Key Insights (2005–2024)
968
 Free Sales & Revenue
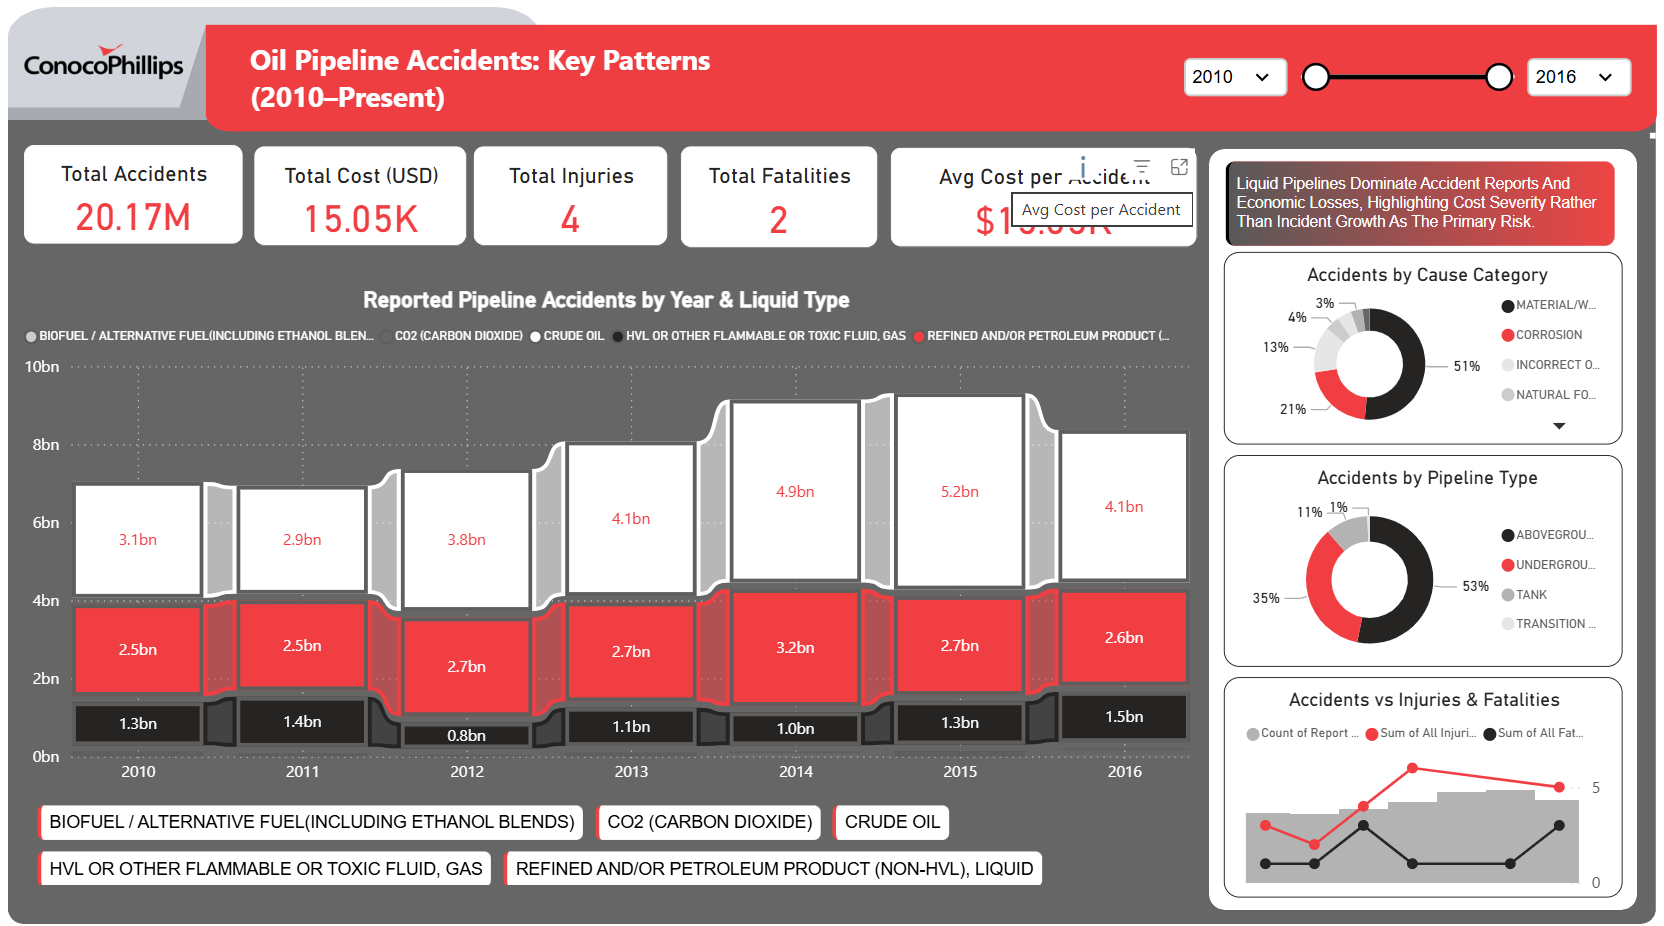
ConocoPhillips Oil Pipeline Accidents: Key Patterns (2010–Present) – Key Insights
871
 Free Operations & Production
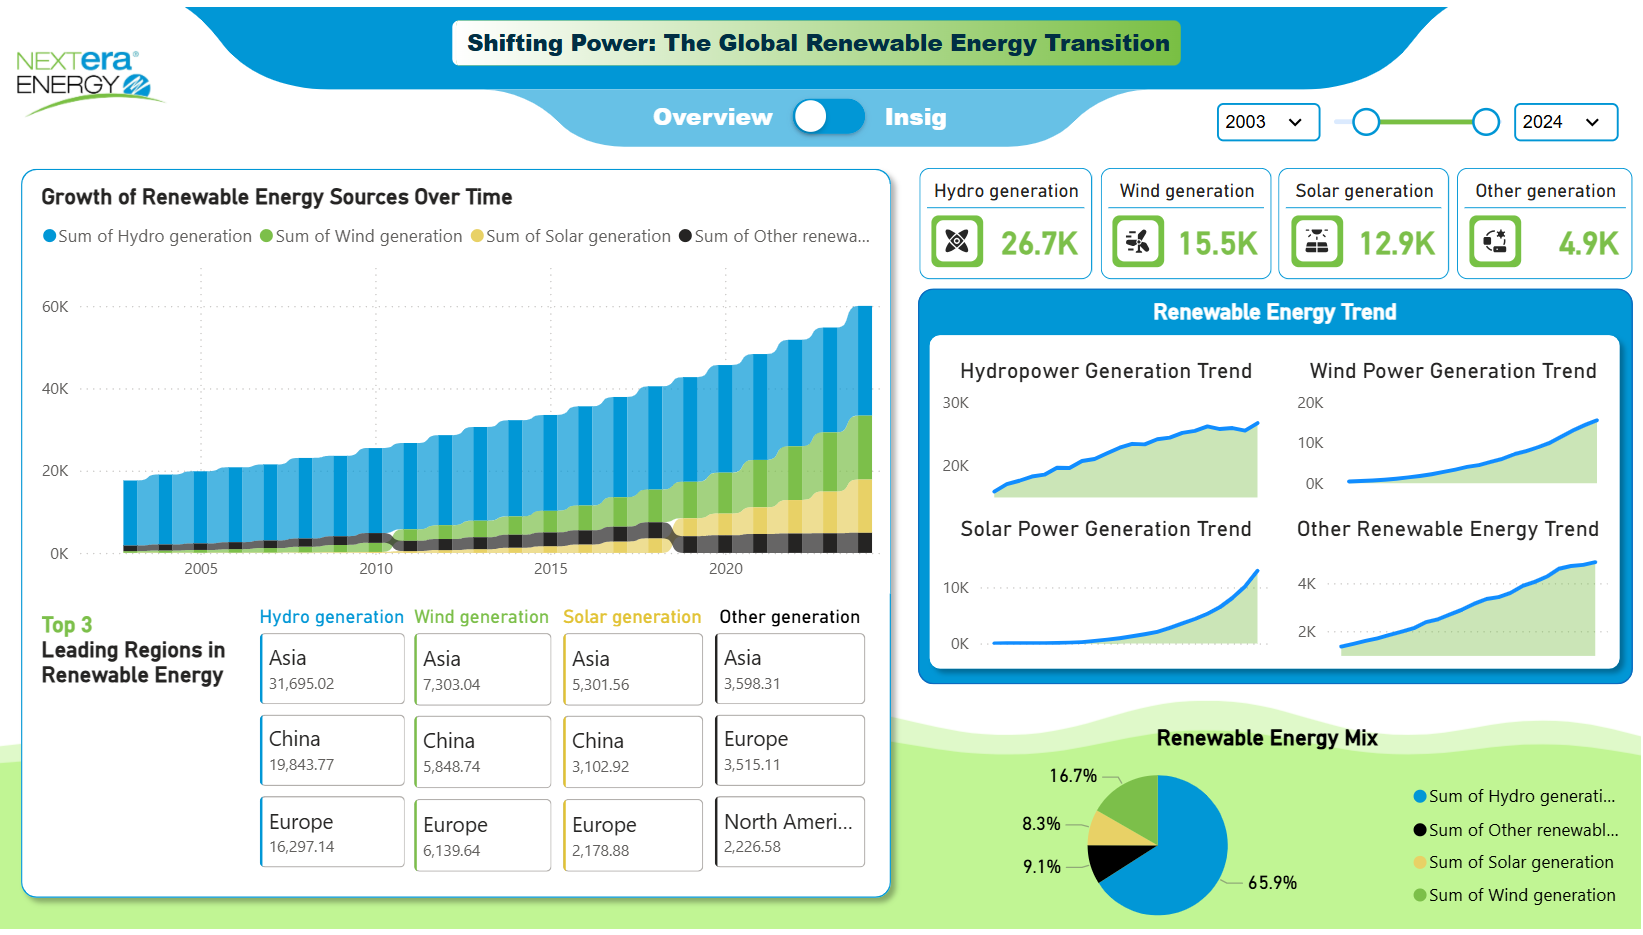
NextEra Energy: Shifting Power – Global Renewable Energy Transition Dashboard Insights (2003–2024)
927
If you find this website helpful, share it with friends and colleagues to boost their Power BI skills and work efficiency!
Like this site? Share it