Superstore US Sale
1083 Downloads
Description
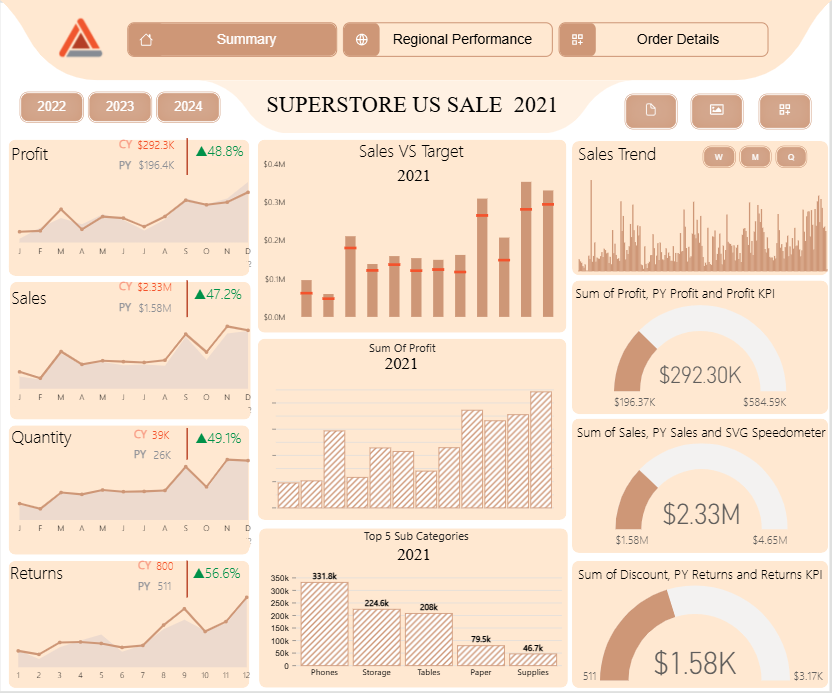
The Superstore US Sale 2021 dashboard provides the following insights:
- Profit: $292.3K, up 48.8% from $196.4K last year.
- Sales: $2.33M, increased by 47.2% from $1.58M.
- Quantity: 39K units, a 49.1% rise from 26K.
- Returns: 800 units, up 56.6% from 511.
- Sales vs Target 2021: Sales fluctuated, with some months exceeding the $0.3M target and others falling below $0.1M.
- Sum of Profit 2021: Profit distribution shows variability, with some months performing strongly.
- Top 5 Sub Categories 2021: Phones lead with 331K, followed by Storage (224K), Tables (208K), Paper (75K), and Supplies (46.7K).
- Sales Trend: Shows a general upward trend with periodic fluctuations.
- Sum of Profit, PY Profit and Profit KPI: Profit reached $292.3K, with a target of $196.37K and a stretch goal of $584.5K.
- Sum of Sales, PY Sales and SVG Speedometer: Sales hit $2.33M, compared to $1.58M last year, with a target of $4.65M.
- Sum of Discount, PY Returns and Returns KPI: Discounts totaled $1.58K, with returns up from $511 to an unspecified current value, and a target of $3.17K.
The dashboard is designed using Flexa Design, Flexa Tables, and Flexa Charts from Flexa Intel.
Other Templates
 Free Sales & Revenue
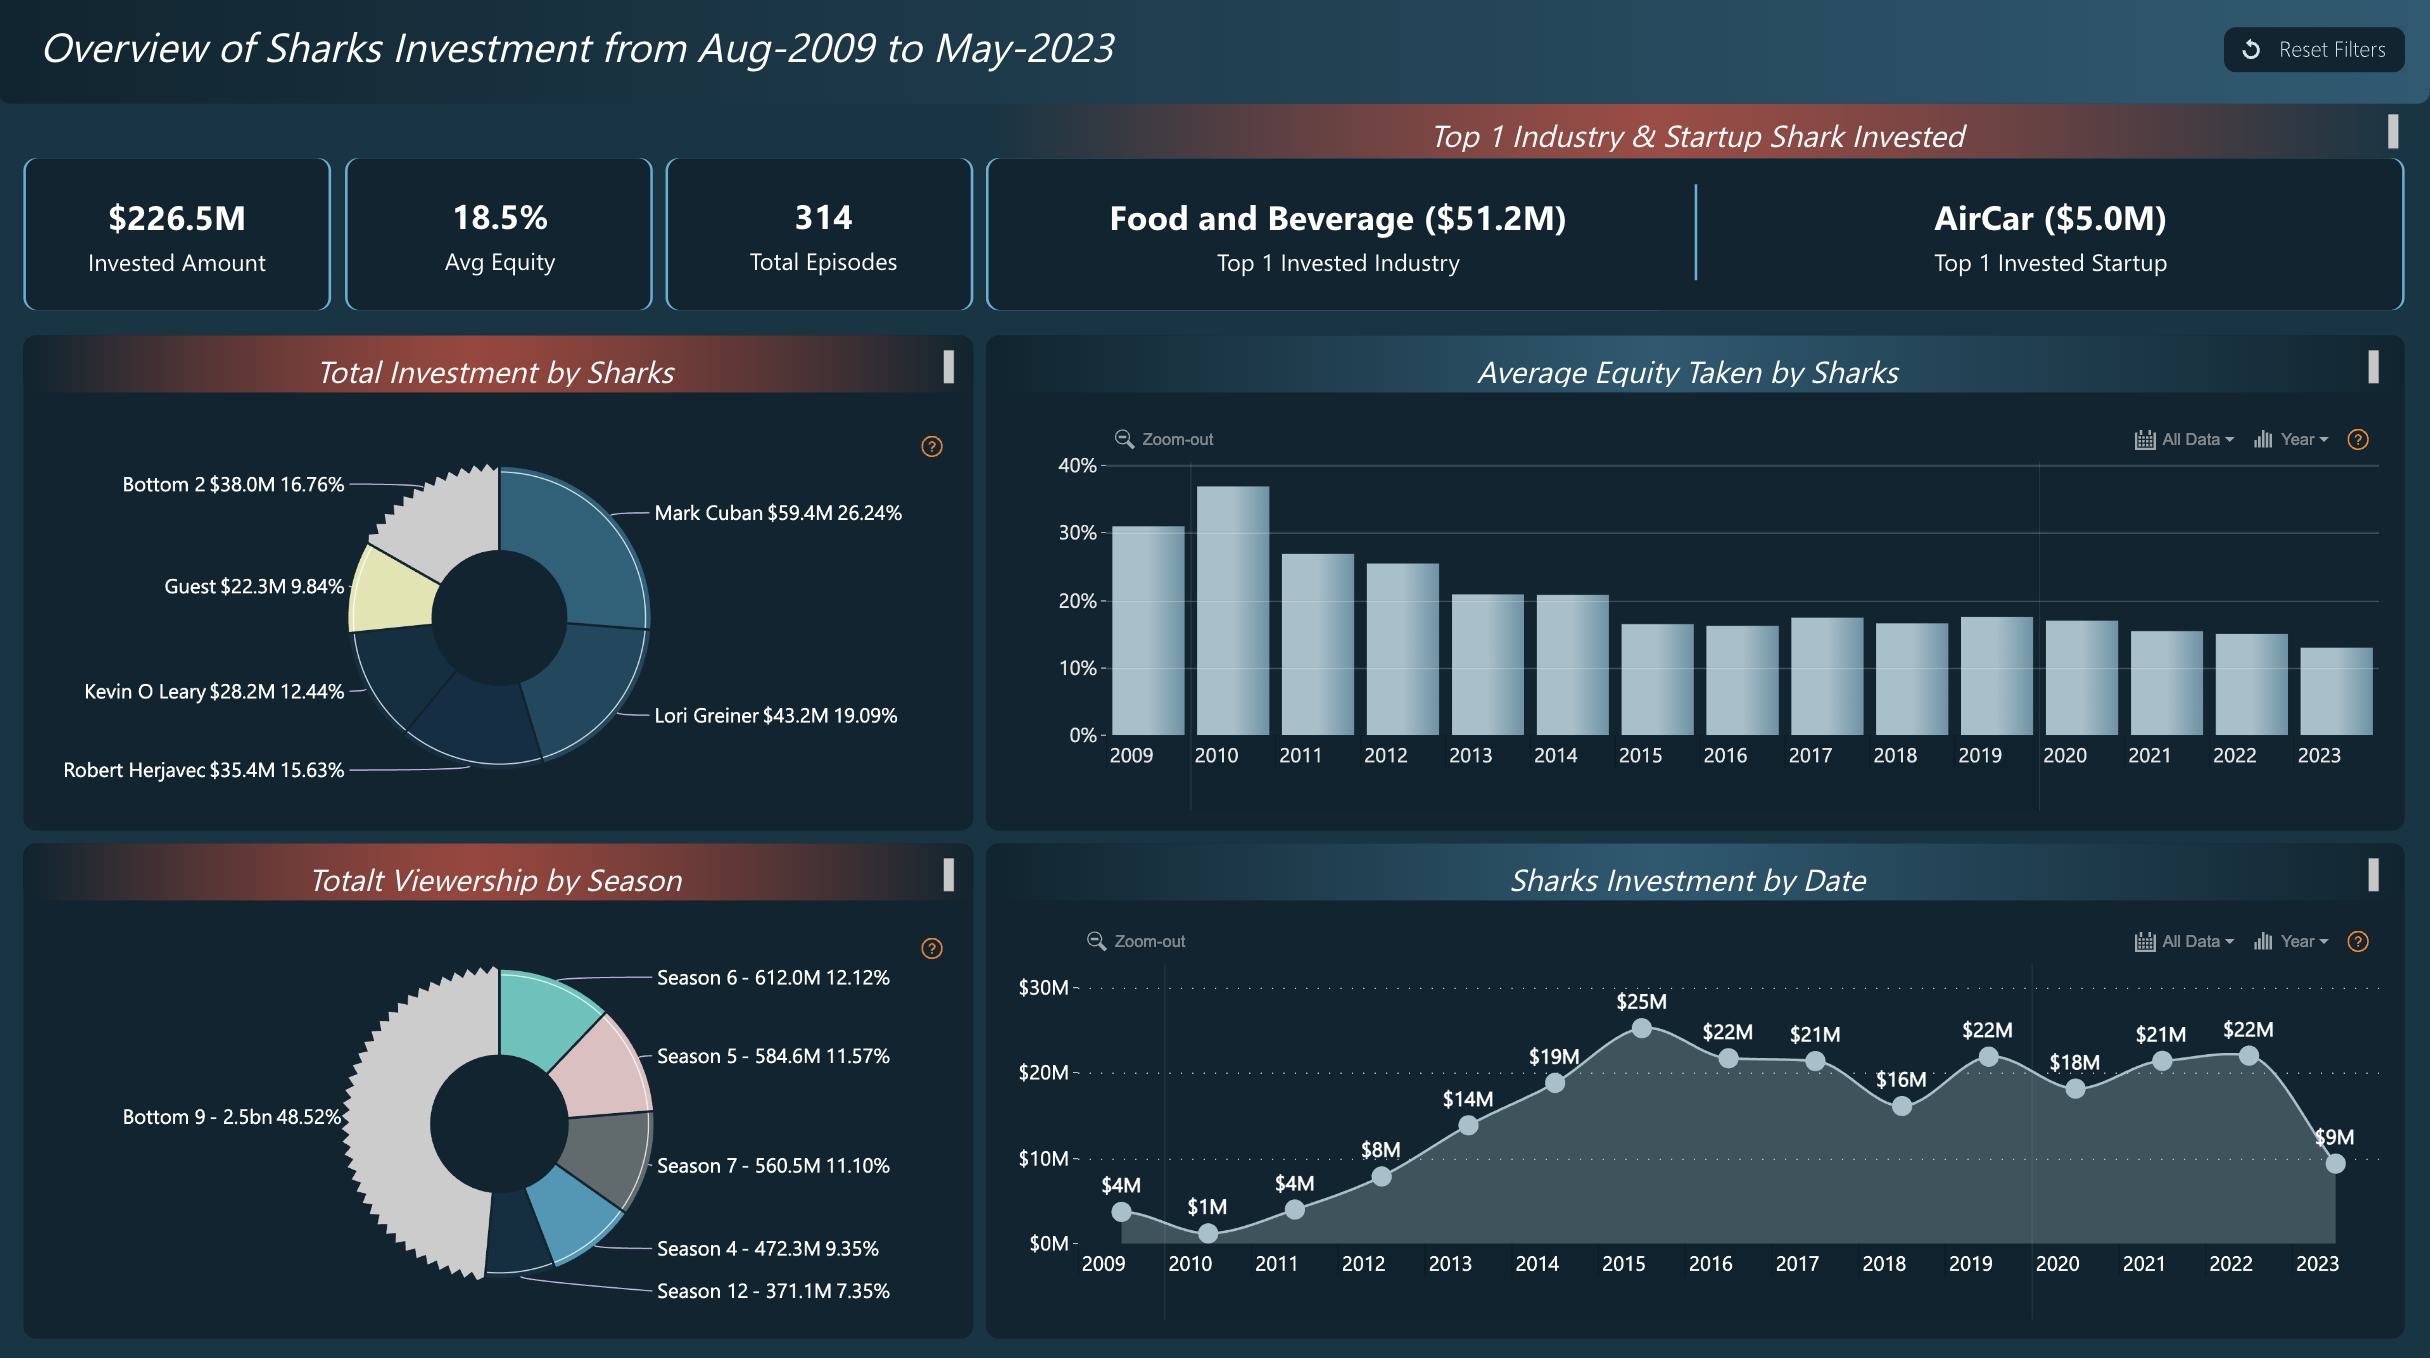
Power BI Shark Tank Investment Dashboard Template (Free PBIX Download)
66
 Free Sales & Revenue
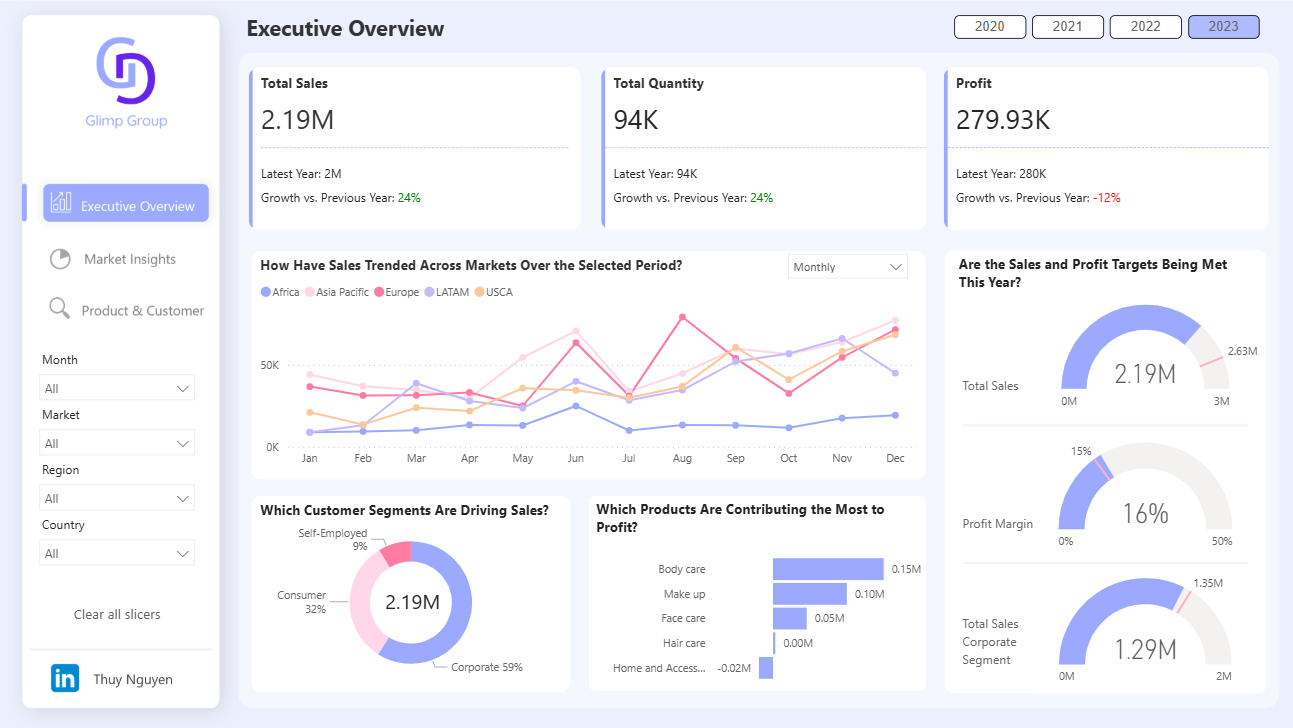
Power BI Executive Overview Dashboard Template — Global Sales & Profit Target Tracking (Free PBIX Download)
146
 $18Sales & Revenue
CRM Microsoft Power BI Dashboard Template
0
If you find this website helpful, share it with friends and colleagues to boost their Power BI skills and work efficiency!
Like this site? Share it