Shell Oil Pipeline Accidents Dashboard (2010–Present) – Key Insights
986 Downloads
Description
Overall Summary
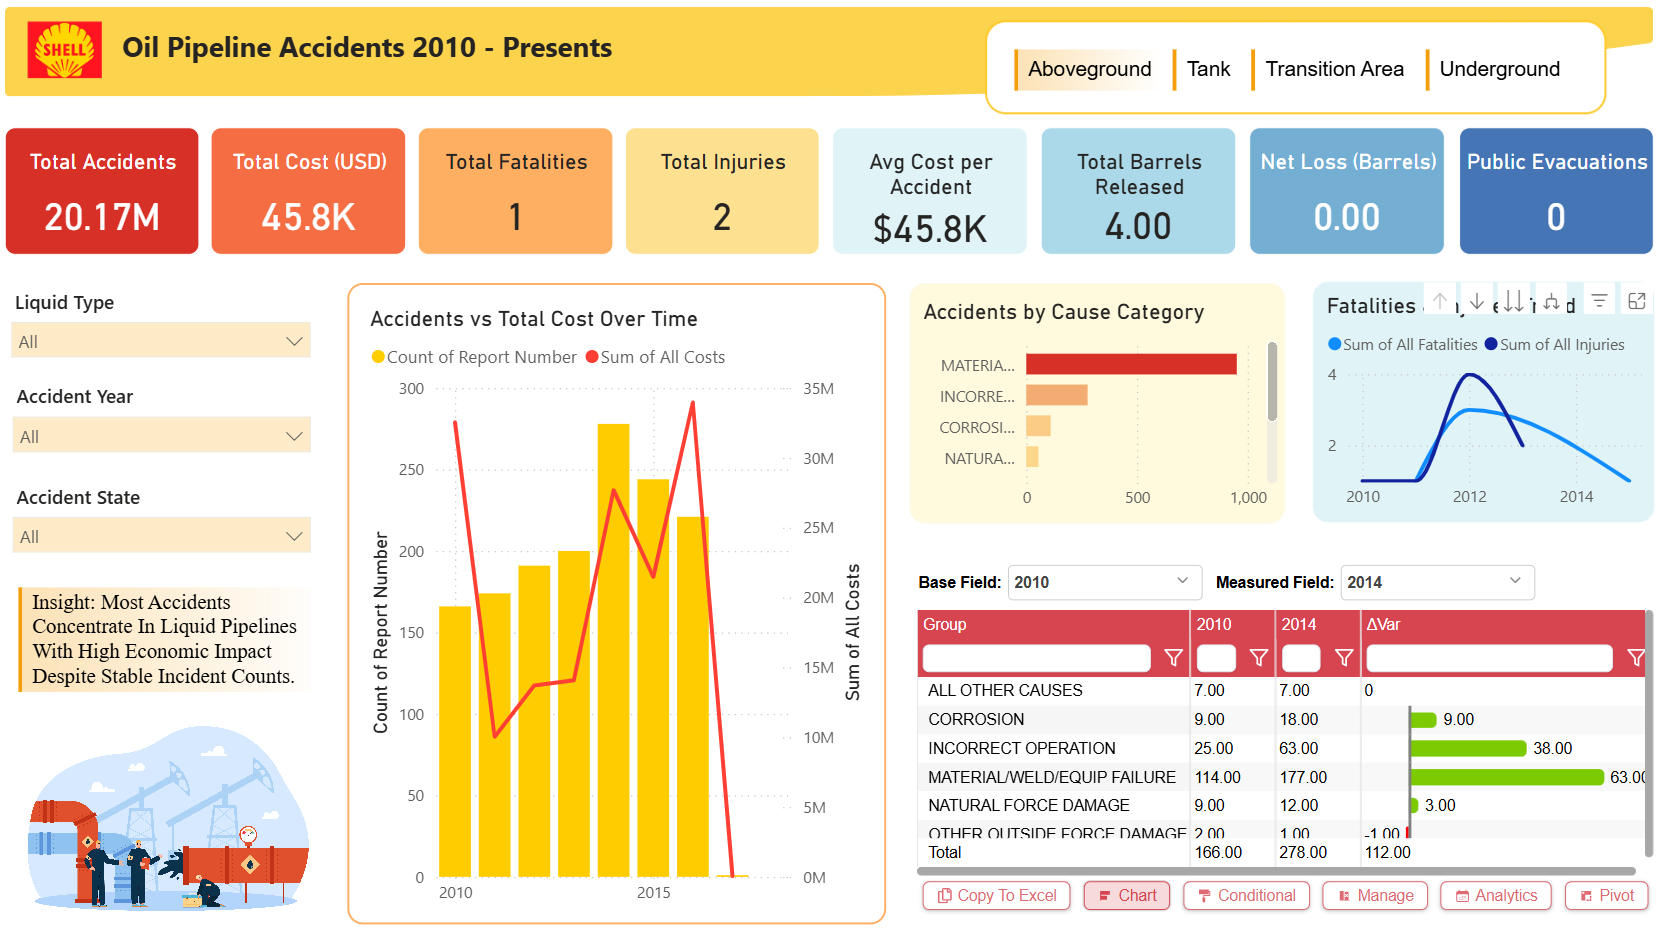
- Total Accidents: 20.17M (likely a data artifact or mislabeling; visual charts suggest ~150–300 incidents over the period – possibly referring to reported events or a different metric).
- Total Cost: $45.8K (very low relative to typical spill costs – may reflect only a subset or average per incident).
- Human Impact: 1 fatality, 2 injuries – remarkably low for the industry.
- Environmental Impact: 4 barrels released, net loss 0 barrels, 0 public evacuations → minimal spills in recorded incidents.
- Average Cost per Accident: $45.8K – indicates mostly minor incidents.
Trends Over Time
- Accident Count: Peaked sharply around 2013–2014 (~280–300 reports), then steadily declined to near zero by late 2010s → significant improvement in safety performance.
- Total Cost: Followed a similar pattern – high in early 2010s (~$30–35M peak), dropping dramatically post-2015 → costs reduced in parallel with incident reduction.
- Fatalities & Injuries: One peak in injuries (~4) around 2012–2013, then near zero.
Causes of Accidents (2010 vs 2014 Variance)
- Material/Weld/Equipment Failure: Largest increase (+63K cost, from $114K to $177K) – biggest cost driver.
- Incorrect Operation: +38K cost rise.
- Corrosion: +9K.
- Natural Force Damage: +3K.
- Other/Outside Force: +1K.
- All Other Causes: No change. → Despite stable or declining incident counts, economic impact rose due to more expensive failure modes (especially equipment/material issues).
Key Insight Highlight
- "Most Accidents Concentrate In Liquid Pipelines With High Economic Impact Despite Stable Incident Counts" → even as incident numbers fell, the remaining incidents became costlier, primarily driven by material/equipment failures.
Key Takeaways
- Strong Safety Improvement: Dramatic reduction in accident frequency and severity since mid-2010s – likely due to better monitoring, maintenance protocols, and technology adoption.
- Minimal Human & Environmental Harm: Extremely low fatalities, injuries, spills, and evacuations reflect effective containment and response measures.
- Rising Cost Per Incident: While incidents declined, average cost increased due to equipment/material failures – aging infrastructure may be a latent risk.
- Focus Area: Material/weld/equipment failure is the dominant and growing cost driver.
Recommendations
- Prioritize predictive maintenance and asset integrity programs targeting material, weld, and equipment vulnerabilities to prevent high-cost failures.
- Continue investment in leak detection, remote monitoring, and rapid-response systems – current low spill volume shows these are working.
- Conduct root-cause analysis on post-2015 cost increases despite fewer incidents to address aging pipeline risks proactively.
- Share best practices across industry (e.g., corrosion prevention, operator training) to sustain the downward trend in incidents.
Overall: Excellent safety record with very low human and environmental impact, but vigilance needed on rising per-incident costs driven by infrastructure-related failures.
Other Templates
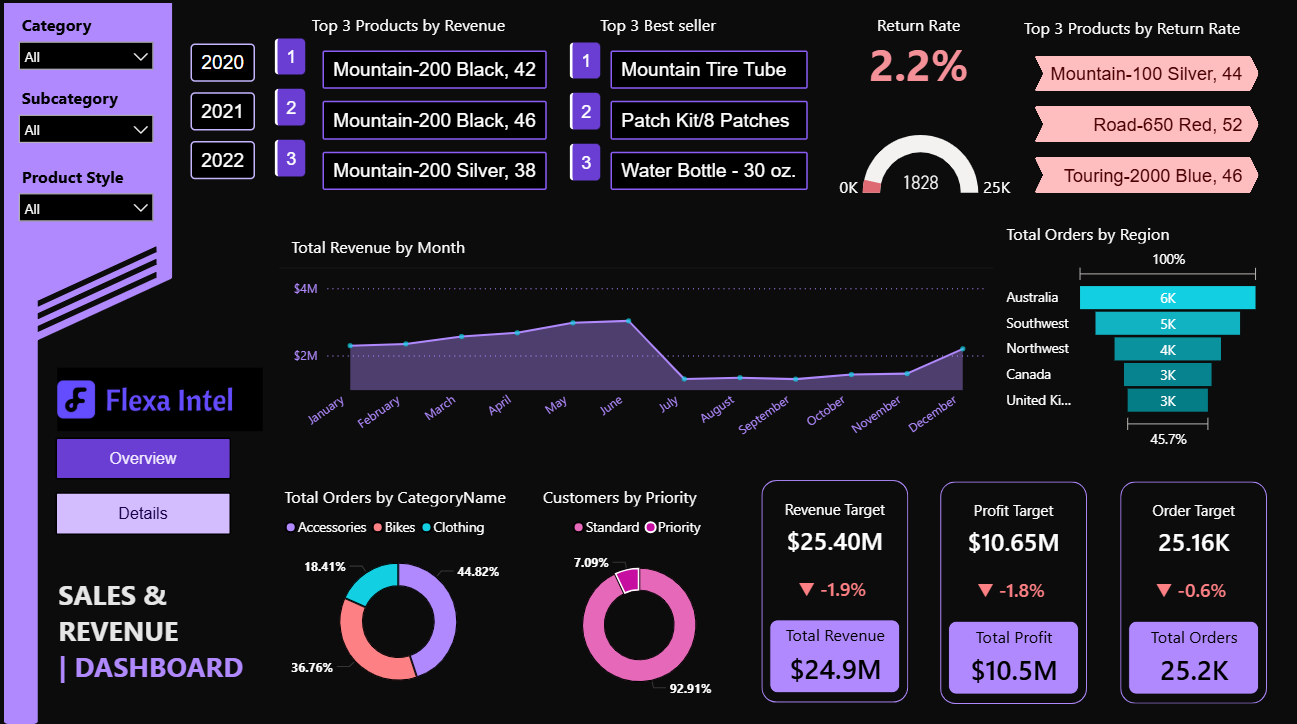 Free Sales & Revenue
Sales & Revenue Dashboard – Key Insights (Full Year 2022)
1.1k
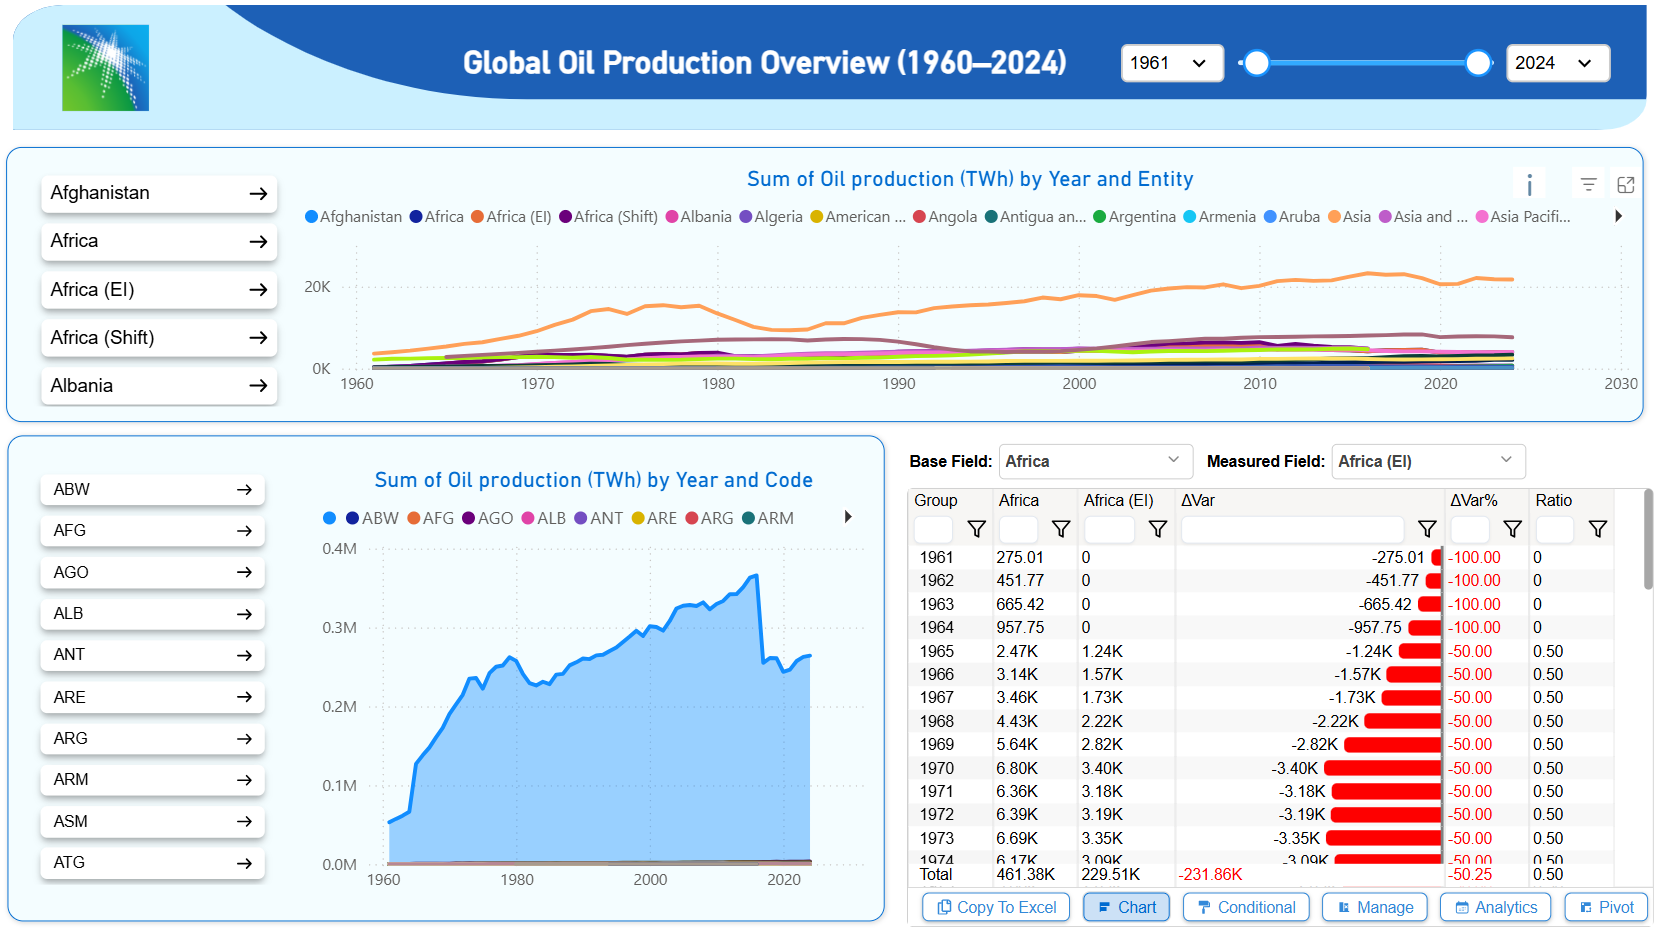 Free Operations & Production
Executive Summary: Global Oil Production Analysis (1960–2024)
793
 Free Sales & Revenue
Superstore US Sale Report
1.1k
If you find this website helpful, share it with friends and colleagues to boost their Power BI skills and work efficiency!
Like this site? Share it