Sales & Revenue Dashboard – Key Insights (Full Year 2022)
1107 Downloads
Description
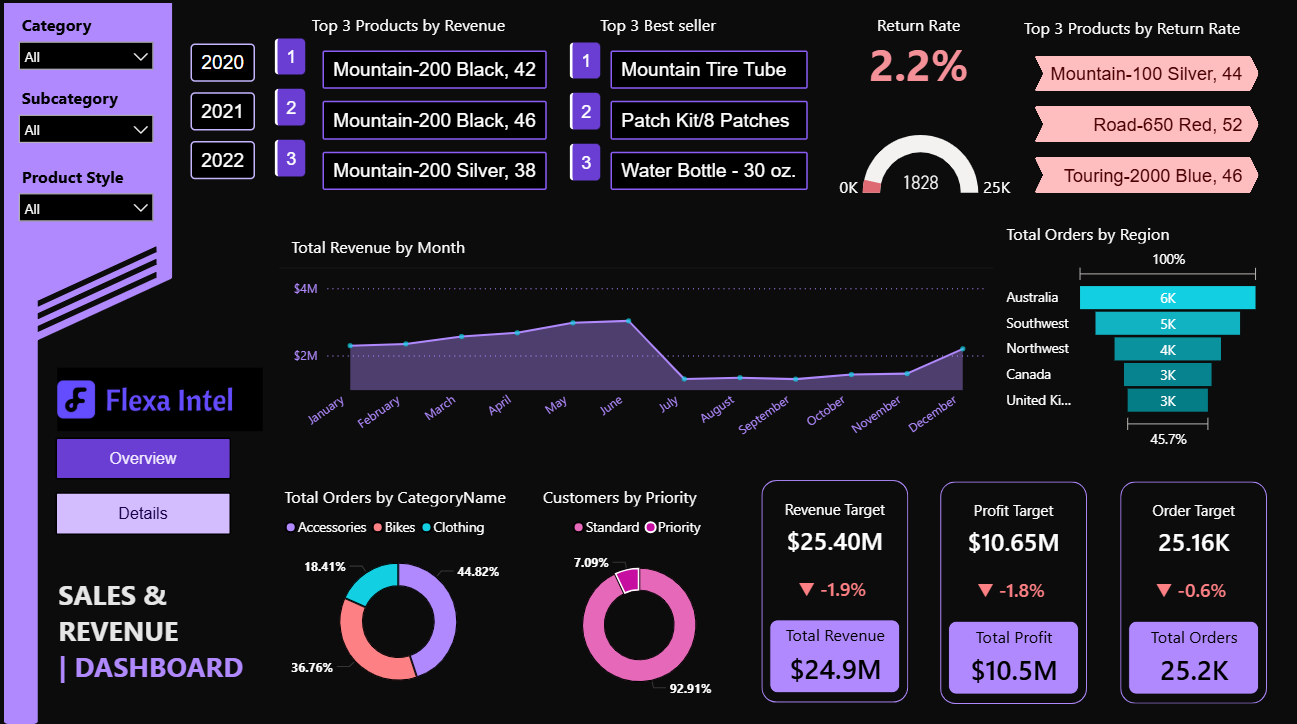
Overall Performance vs Targets
- Total Revenue: $24.9M → -1.9% below target ($25.4M)
- Total Profit: $10.5M → -1.8% below target ($10.65M)
- Total Orders: 25.2K → -0.6% below target (25.16K)
- → Very close to plan, only minor shortfalls.
Top Performers
- Top 3 Products by Revenue (2020–2022):
- Mountain-200 Black, 42
- Mountain-200 Black, 46
- Mountain-200 Silver, 38
- → Mountain-200 series dominates revenue consistently for three years.
- Top 3 Best-Selling Products (by units)
- Mountain Tire Tube
- Patch Kit/8 Patches
- Water Bottle – 30 oz.
- → Low-price, high-volume consumables lead in units.
- Top 3 Products by Return Rate (highest returns)
- Mountain-100 Silver, 44
- Road-650 Red, 52
- Touring-2000 Blue, 46
- → Overall return rate is very healthy at 2.2%, but these three models need quality/packaging attention.
Category & Customer Insights
- Sales Mix by Category:
- Bikes: 44.82%
- Accessories: 36.76%
- Clothing: 18.41%
- → Bikes drive almost half of revenue.
- Customer Priority:
- 92.91% Standard
- 7.09% Priority
- → Very low share of high-value/rush orders.
Regional Orders
- Australia – 6K
- Southwest – 5K
- Northwest – 4K
- Canada – 3K
- United Kingdom – 3K
- → Australia remains the strongest market.
Revenue Trend
- Strong Q1–Q2, peak in May–June, followed by steady decline through the second half of the year → clear seasonal pattern with weak Q4.
Key Takeaways & Recommendations
- Mountain-200 series is the undisputed flagship — protect and expand this line.
- Low-price accessories (tubes, patches, bottles) drive massive unit volume and customer retention — perfect for bundling and loyalty programs.
- Return rate is excellent (2.2%), but three specific models stand out — initiate quality review and improved packaging/testing for Mountain-100 Silver and Road-650 Red.
- Heavy Q3–Q4 revenue drop — launch stronger promotions, early Black Friday, or new model releases in Q4 to smooth seasonality.
- Priority customer segment is tiny (7%) — explore up-sell/cross-sell programs to convert standard customers into higher-value priority buyers.
Overall: Solid, stable business with clear flagship products, very healthy return rate, and predictable seasonality that offers a clear opportunity for Q4 improvement.
The dashboard is designed using Flexa Design, Flexa Tables, and Flexa Charts from Flexa Intel.
Other Templates
 Free Sales & Revenue
Power BI Coffee Shop Sales Dashboard Template (Free PBIX Download)
83
 Free Sales & Revenue
Power BI Shark Tank Analytics Dashboard Template (Free PBIX Download)
67
 Free Sales & Revenue
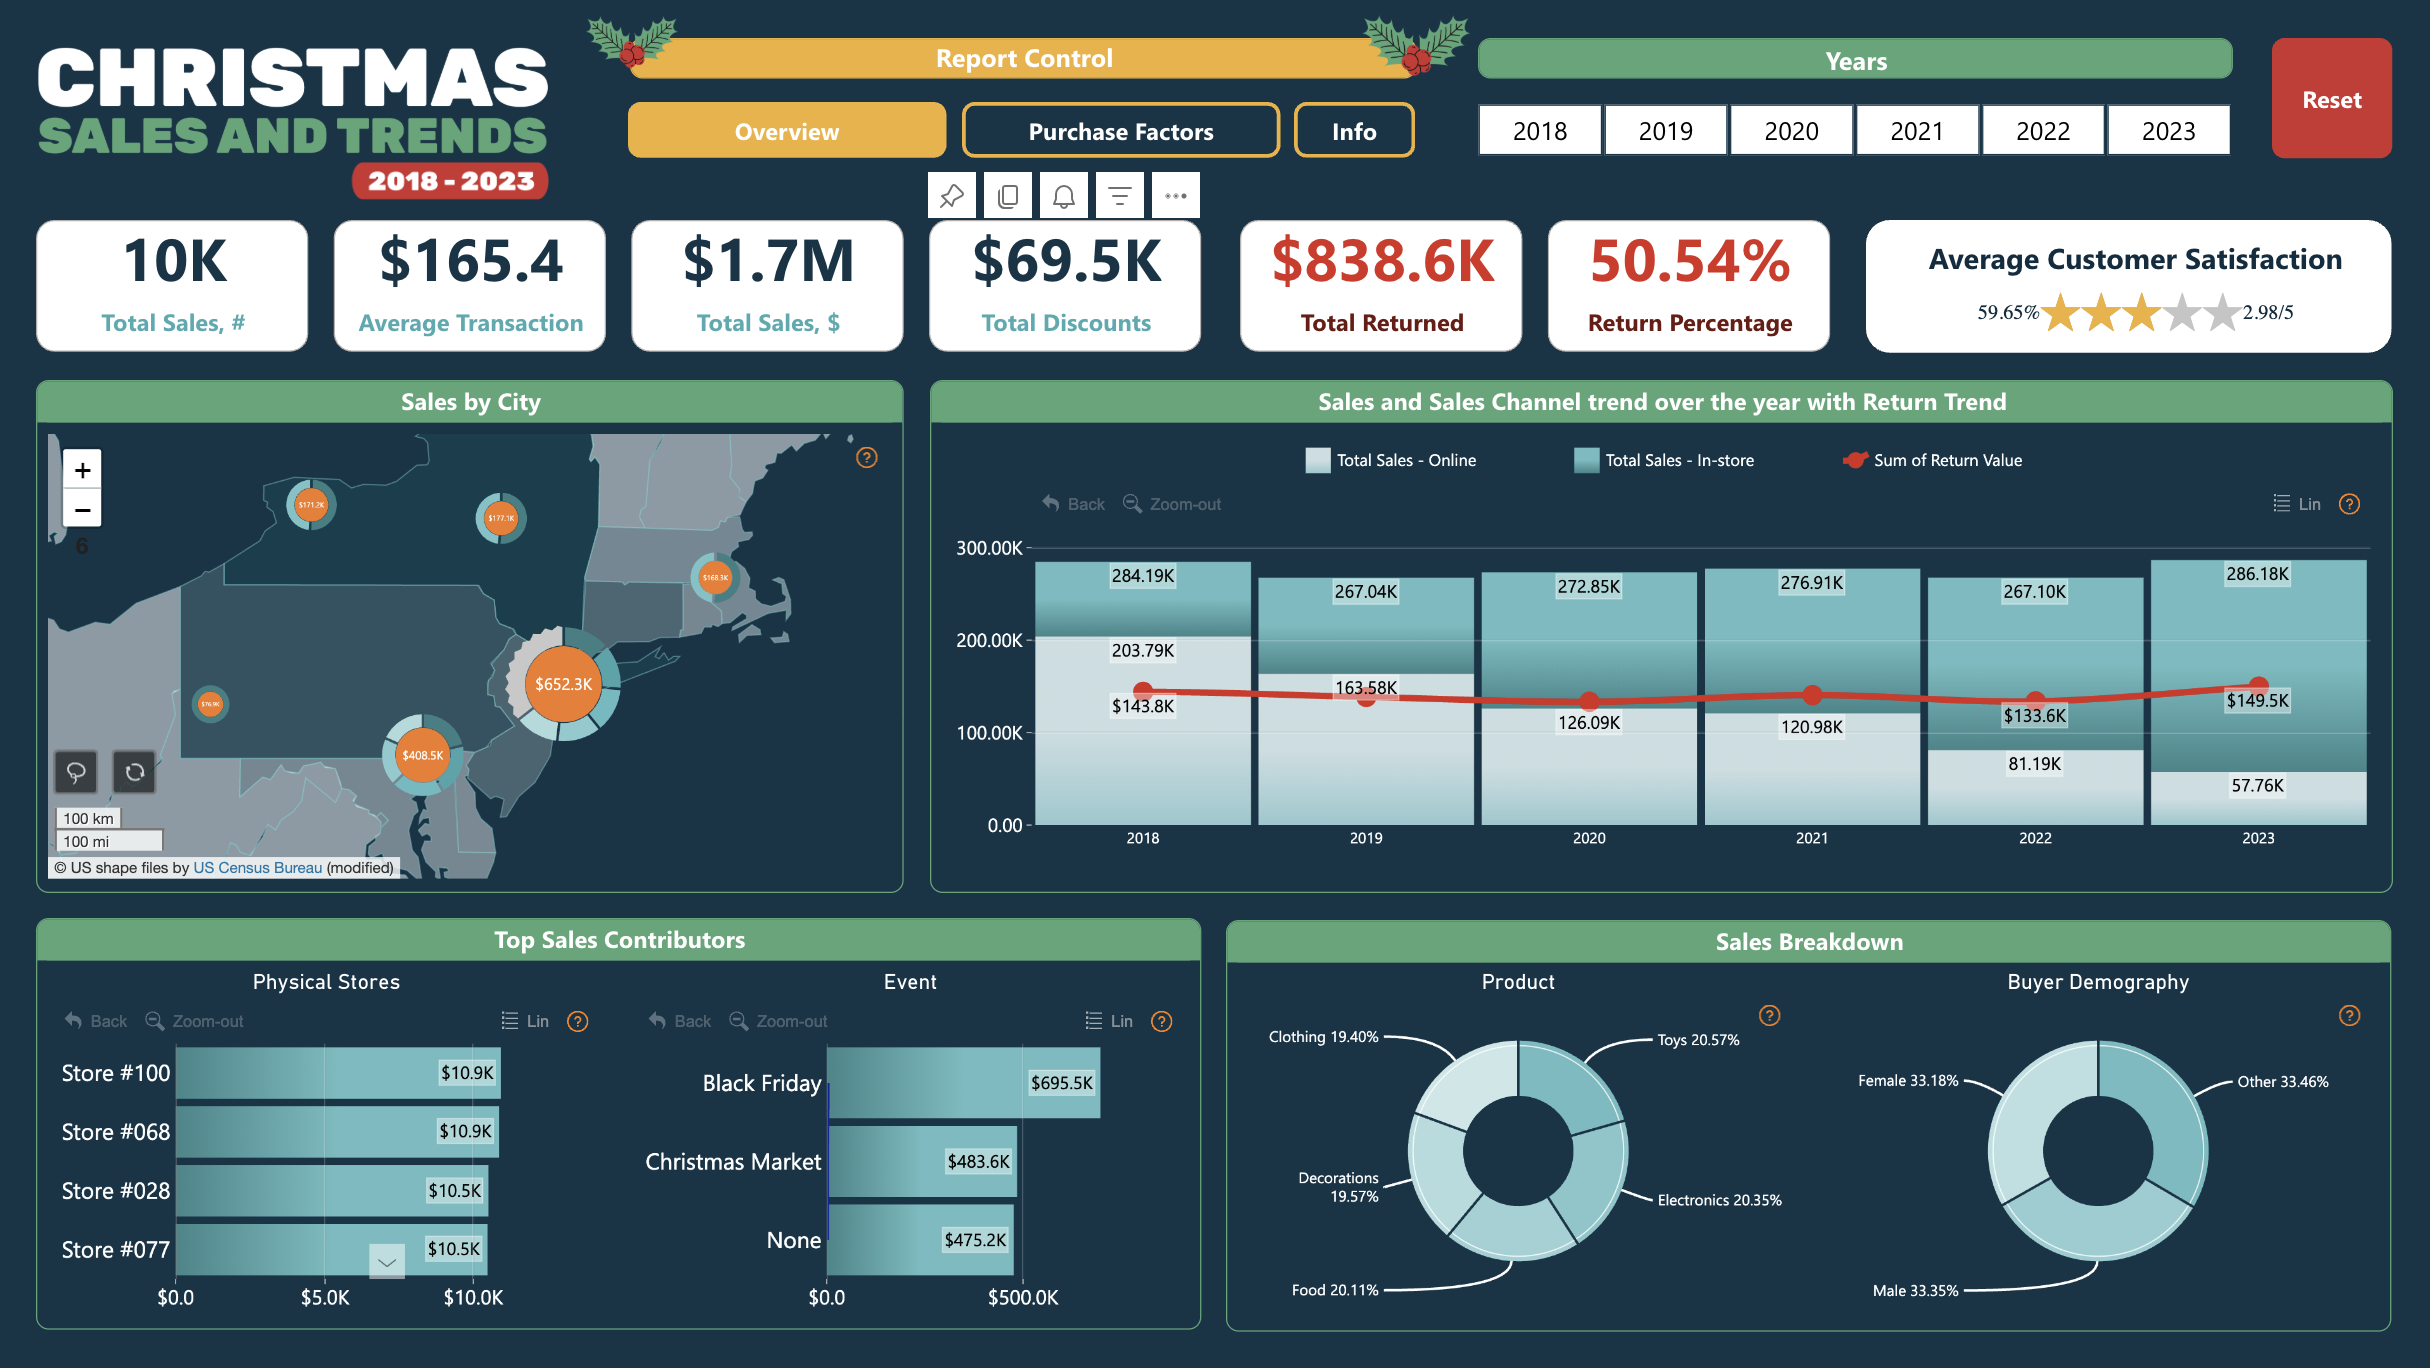
Power BI Christmas Sales & Trends Dashboard Template (Free PBIX Download)
82
If you find this website helpful, share it with friends and colleagues to boost their Power BI skills and work efficiency!
Like this site? Share it