Sales Performance Snapshot dashboard
1256 Downloads
Description
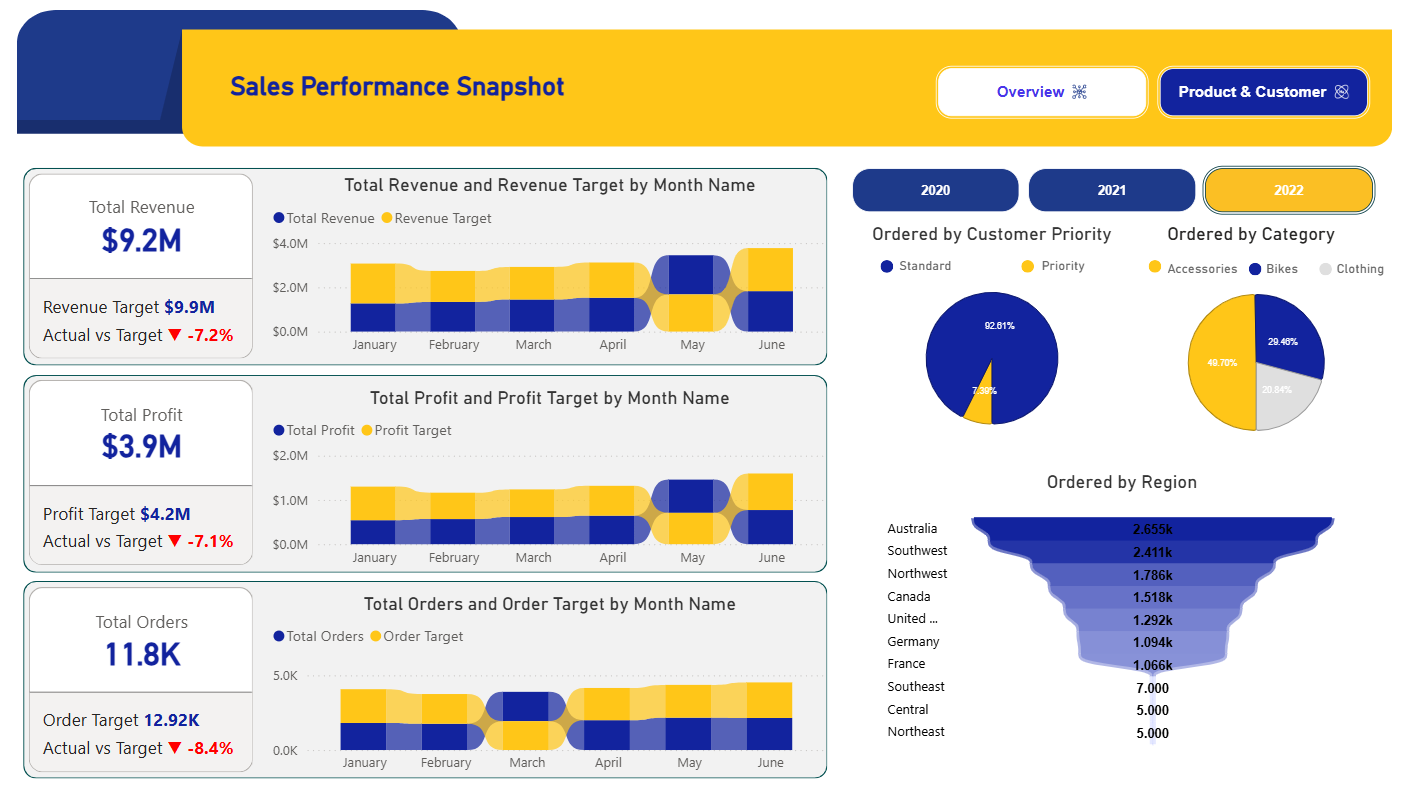
The Sales Performance Snapshot dashboard for 2022 provides the following insights:
- Total Revenue: $9.2M, 7.2% below the $9.9M target.
- Total Profit: $3.9M, 7.1% below the $4.2M target.
- Total Orders: 11.8K, 8.4% below the 12.92K target.
- Revenue & Profit by Month (Jan–Jun):
- Actual revenue consistently underperformed the target, with the largest gap in April–May.
- Profit followed a similar trend, showing underachievement across all months.
- Orders by Month: Order volume missed targets in every month, with the most significant shortfalls in February and May.
- Ordered by Customer Priority:
- 92.61% Standard, 7.39% Priority — indicating low urgency in most orders.
- Ordered by Category:
- Accessories: 49.70%
- Bikes: 29.46%
- Clothing: 20.84% — Accessories dominate sales mix.
- Ordered by Region (Top contributors):
- Australia: 2,655K
- Southwest: 2,411K
- Northwest: 1,786K
- Canada: 1,518K
- United Kingdom: 1,292K
The dashboard is designed using Flexa Design, Flexa Tables, and Flexa Charts from Flexa Intel.
Other Templates
 Free Sales & Revenue
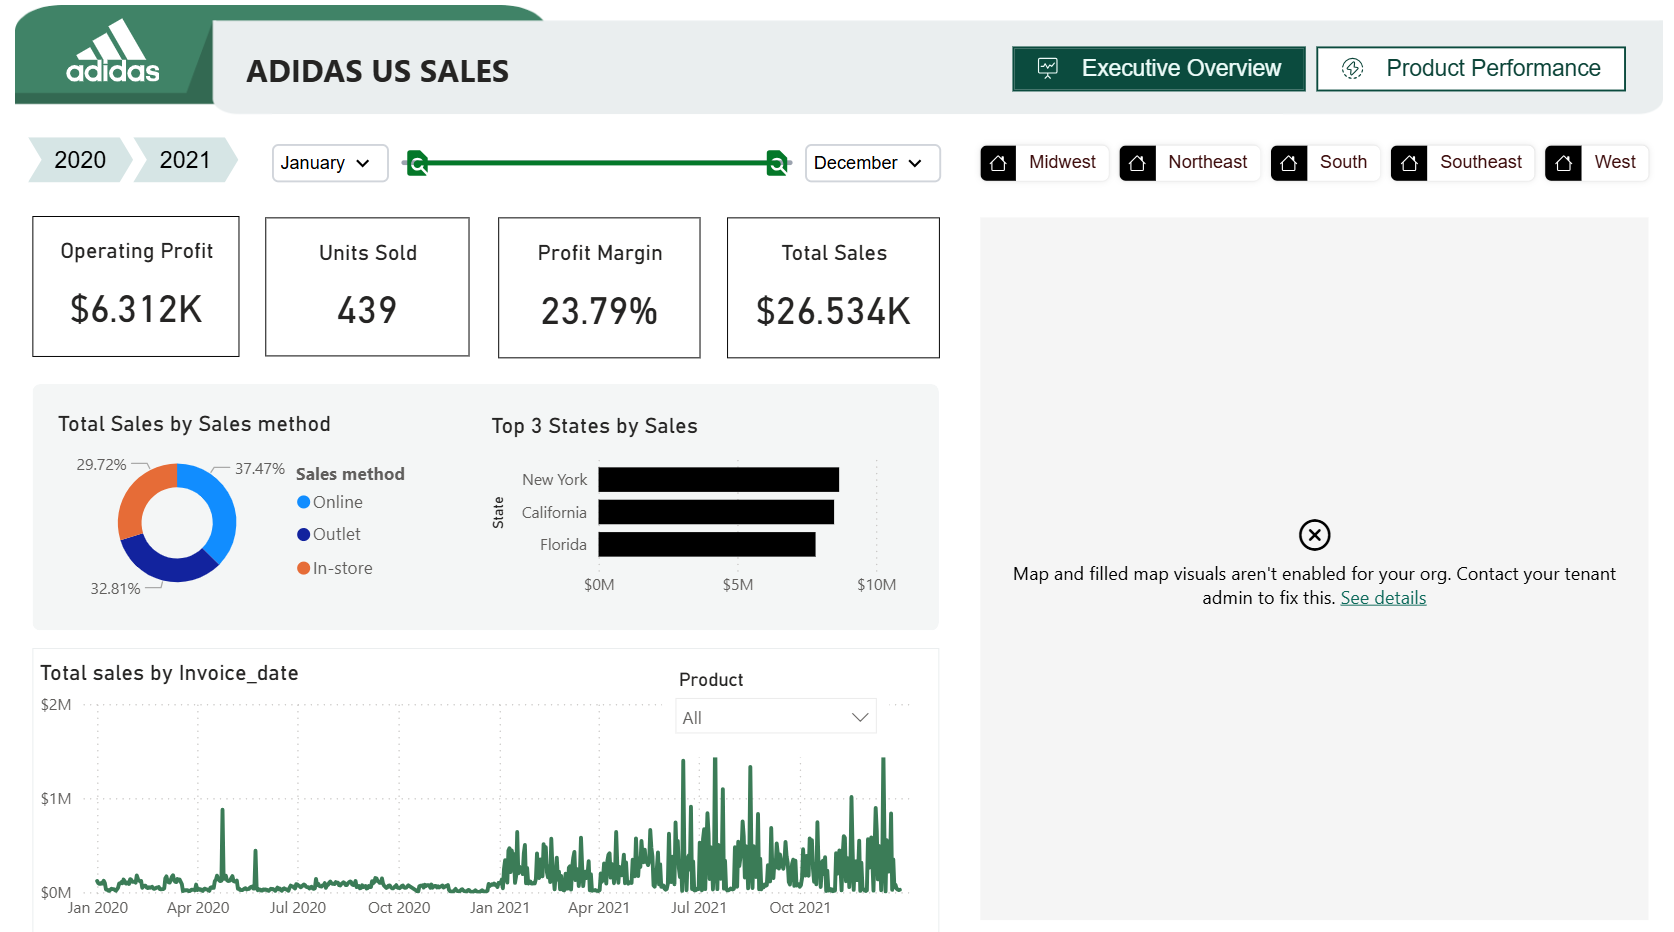
Adidas US Sales (2020–2021)
815
 Free Sales & Revenue
Power BI Used Car Sales Dashboard Template (Free PBIX Download)
65
 Free Sales & Revenue
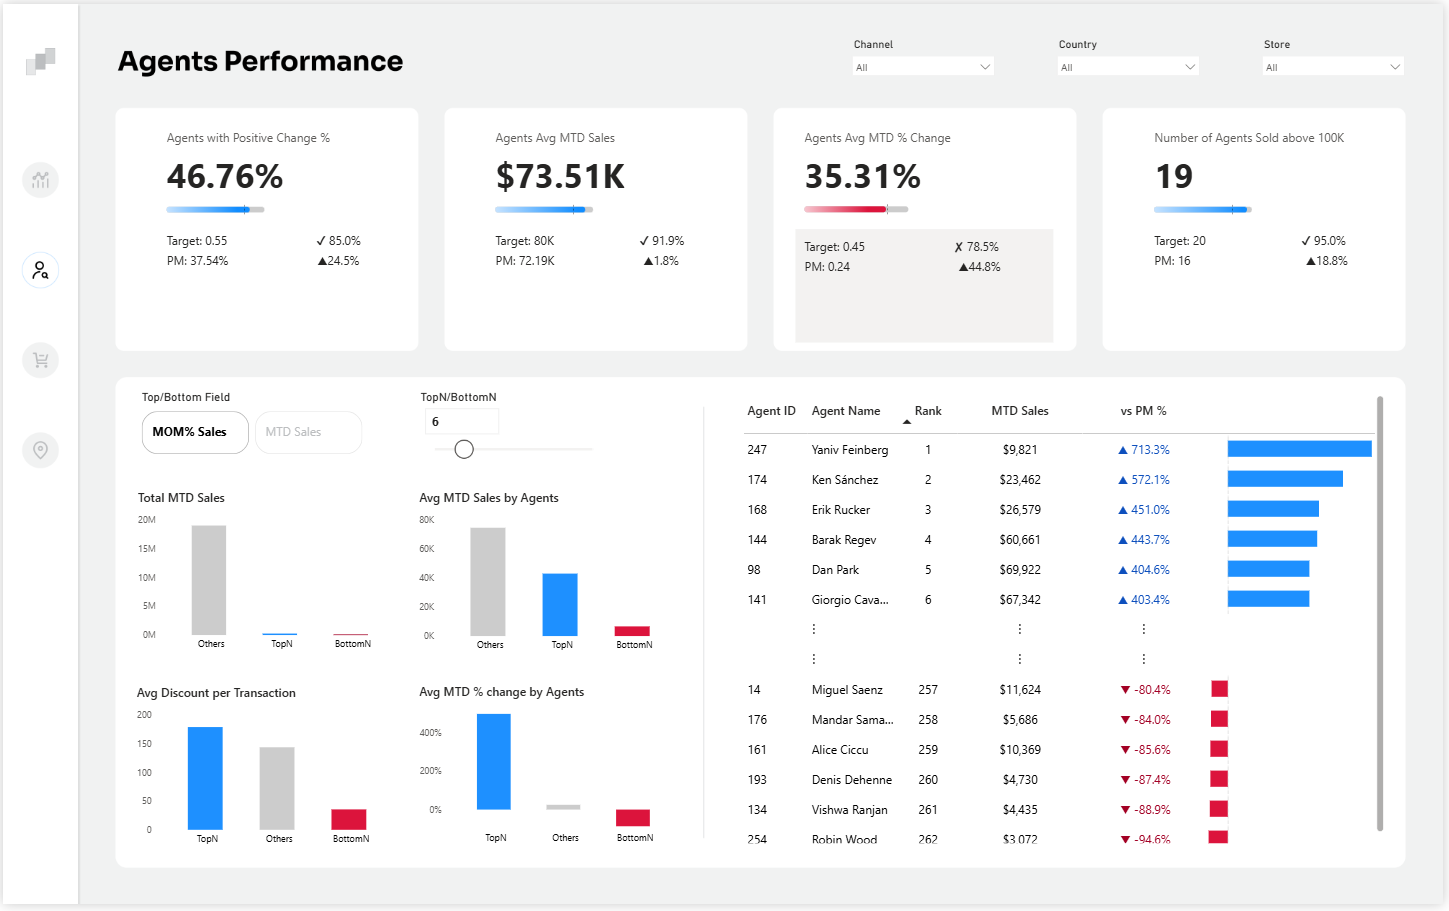
Power BI Sales Agents Performance Dashboard Template (Free PBIX Download)
70
If you find this website helpful, share it with friends and colleagues to boost their Power BI skills and work efficiency!
Like this site? Share it