Power BI Used Car Sales Dashboard Template (Free PBIX Download)

This dashboard tracks €6 billion in used car sales across European markets, segmented by vehicle type, fuel type, geospatial region, and registration year. It serves automotive dealership analysts, market research teams, and regional sales managers who need a multi-dimensional view of inventory performance and buyer demand patterns. The drill-down architecture — Vehicle Type → Fuel Type and Year Category → Year → Month — allows users to move from market-level trends down to segment-level diagnostics in a single report.
1. What's Inside This Template
KPI Banner — Sales
| MetricValue | |
| Total Sales | €6bn |
| Current Year | 47M |
| Current Month | 2M |
The KPI card isolates unit volume (47M YTD) from monetary value (€6bn), enabling price-per-unit calculation without a separate visual. Current Month at 2M implies an annualized run rate significantly below the current year total, suggesting either seasonal softness or mid-year reporting.
Top Navigation — Page Tabs Three tabs: Sales, Volume, Pricing. This report covers the Sales tab. The architecture signals a deliberate separation between revenue measurement (Sales), inventory or transaction count (Volume), and per-unit price benchmarking (Pricing) — appropriate for a multi-stakeholder automotive dataset.
Left Panel — Filter Sidebar Two-tab filter panel (Filters / Values) with dropdowns for: Brand, Model, Vehicle Type, Fuel Type. A "Clear All Filters" CTA is prominently placed. Car/Features/Location sub-tabs suggest the sidebar expands into feature-level filters (mileage, year, trim) and geographic targeting — critical for a marketplace-style dataset.
Geospatial Distribution — Interactive Map (ZoomCharts + OpenStreetMap) Bubble map across Central and Western Europe. Sales concentration visible:
| ClusterEstimated Sales | |
| Germany (Central cluster) | €3bn |
| Belgium/Netherlands | €2bn |
| Germany (East cluster) | €1bn |
| UK/Scandinavia | €694M |
| France (outlier) | €0 (single point) |
Germany dominates with two separate clusters totaling ~€4bn — over 60% of total market revenue. The French cluster showing "0" is a data quality flag worth investigating (see Key Insights).
Bar Chart — Sales across Vehicle Type and Fuel Type Drill-down enabled: Vehicle Type → Fuel Type. Currently showing Vehicle Type level.
| Vehicle TypeSales | |
| Other | €3bn |
| Sedan | €1bn |
| Station Wagon | €523M |
| Coupe | €494M |
| Small car | €456M |
| Convertible | €345M |
| Bus | €311M |
| SUV | €195M |
Toggle button (Vehicles / Brands) indicates this visual can switch to a brand-level breakdown without rebuilding the filter context.
Bar Chart — Sales across Registration Year, Month Drill-down: Year Category → Year → Month.
| Registration DecadeSales | |
| -1 (Unknown) | €209M |
| 1910–19 | €10M |
| 1920–29 | €258K |
| 1930–39 | €2M |
| 1940–49 | €612K |
| 1950–59 | €117M |
| 1960–69 | €53M |
| 1970–79 | €139M |
| 1980–89 | €153M |
| 1990–99 | €3bn |
| 2000–09 | €2bn |
| 2010–19 | €859M |
2. Key Insights
2.1. "Other" vehicle type accounts for 50% of total sales — a classification problem masking real demand signals. The largest bar (€3bn) is the uncategorized "Other" bucket, equal to the entire next seven categories combined. This is not a market insight — it's a data governance issue. Until this bucket is classified, the Vehicle Type dimension is analytically unreliable. Analysts should treat €3bn as a floor for unknown vehicle segments, not a product category.
2.2. The 1990s remains the dominant decade for used car sales at €3bn, outperforming 2010–2019 by 3.5x. Cars registered in 1990–1999 generated €3bn in sales, versus €859M for the more recent 2010–2019 cohort. This counterintuitive result suggests either (a) 1990s vehicles have significantly higher transaction volumes due to lower pricing and higher availability, or (b) the dataset skews toward classic/vintage markets where older vehicles command premium prices in niche segments. Drilling into the Pricing tab would confirm which dynamic is at play.
2.3. Germany controls >60% of total European used car sales revenue. Two geospatial clusters in Germany together represent approximately €4bn of the €6bn total. No other single country approaches this concentration. For any vendor using this data for market entry decisions, Germany is the only mandatory market — all others are supplementary.
2.4. The France "0" cluster is either a data pipeline failure or a genuine market absence. The map shows a single bubble labeled "0" positioned in France/Spain — the only visible zero cluster in the dataset. Given France is the second-largest automotive market in Europe, this almost certainly indicates a data ingestion failure (missing region mapping, NULL country code) rather than actual zero sales. This warrants immediate data quality review before using this report for strategic decisions.
2.5. SUVs generate the lowest revenue (€195M) despite being the fastest-growing segment in new car markets. SUVs rank last among all named vehicle types at €195M — less than Buses (€311M) and Convertibles (€345M). In the new car market, SUVs have dominated sales for the past decade. The divergence suggests the used car dataset either predates the SUV boom (consistent with 1990s registration data dominating) or the European used car market has not yet repriced to reflect SUV's new-car dominance. This is the most actionable gap for dealers building inventory strategy.
2.6. €209M in sales tied to Registration Year "-1" represents untracked inventory worth serious revenue. The -1 bucket (unknown registration year) totals €209M — more than the entire 1950s–1980s combined. This is not a small rounding artifact. These are real transactions where vehicle provenance cannot be verified, which has implications for both regulatory compliance and buyer trust scoring.
3. Who This Template Is For
- Automotive Marketplace Analysts who need to segment multi-country used car transaction data by vehicle type, region, and vehicle age simultaneously — and require drill-down capability from country level down to monthly registration periods without building multiple reports.
- Regional Sales Managers at used car dealerships or auction houses who need a geospatial view of where revenue is concentrated across Europe, combined with vehicle-type mix analysis to guide procurement and pricing strategy by market.
- BI Developers building automotive client dashboards who want a production-ready template with ZoomCharts map integration, multi-level drill-down bar charts, and a filter sidebar architecture they can connect to their own dealership database or marketplace API.
4. How to Use
- Download the PBIX file from the Flexa Intel gallery.
- Open in Power BI Desktop (any version supporting ZoomCharts custom visuals).
- Connect your data source — typical sources include: dealership ERP exports (CSV/Excel), marketplace APIs (AutoScout24, Mobile.de), or a SQL database with vehicle transaction tables containing fields for Vehicle Type, Fuel Type, Brand, Model, Registration Year, Sale Price, and Country/Region.
- Once connected, all KPI cards, the geospatial map, and both drill-down bar charts update automatically based on your live transaction data and any active filter selections.
The drill-down bar charts show category-level totals clearly, but the report lacks a structured tabular breakdown where analysts can compare vehicle type performance side-by-side with prior-period variance, rank, and conditional formatting by performance tier. Flexa Tables is a Microsoft-certified Power BI visual that adds sortable, color-coded tabular reporting with multi-level row hierarchy — ideal for building a vehicle type × brand × region summary table that complements the visual charts already in this template.
Other Templates
 Free Sales & Revenue
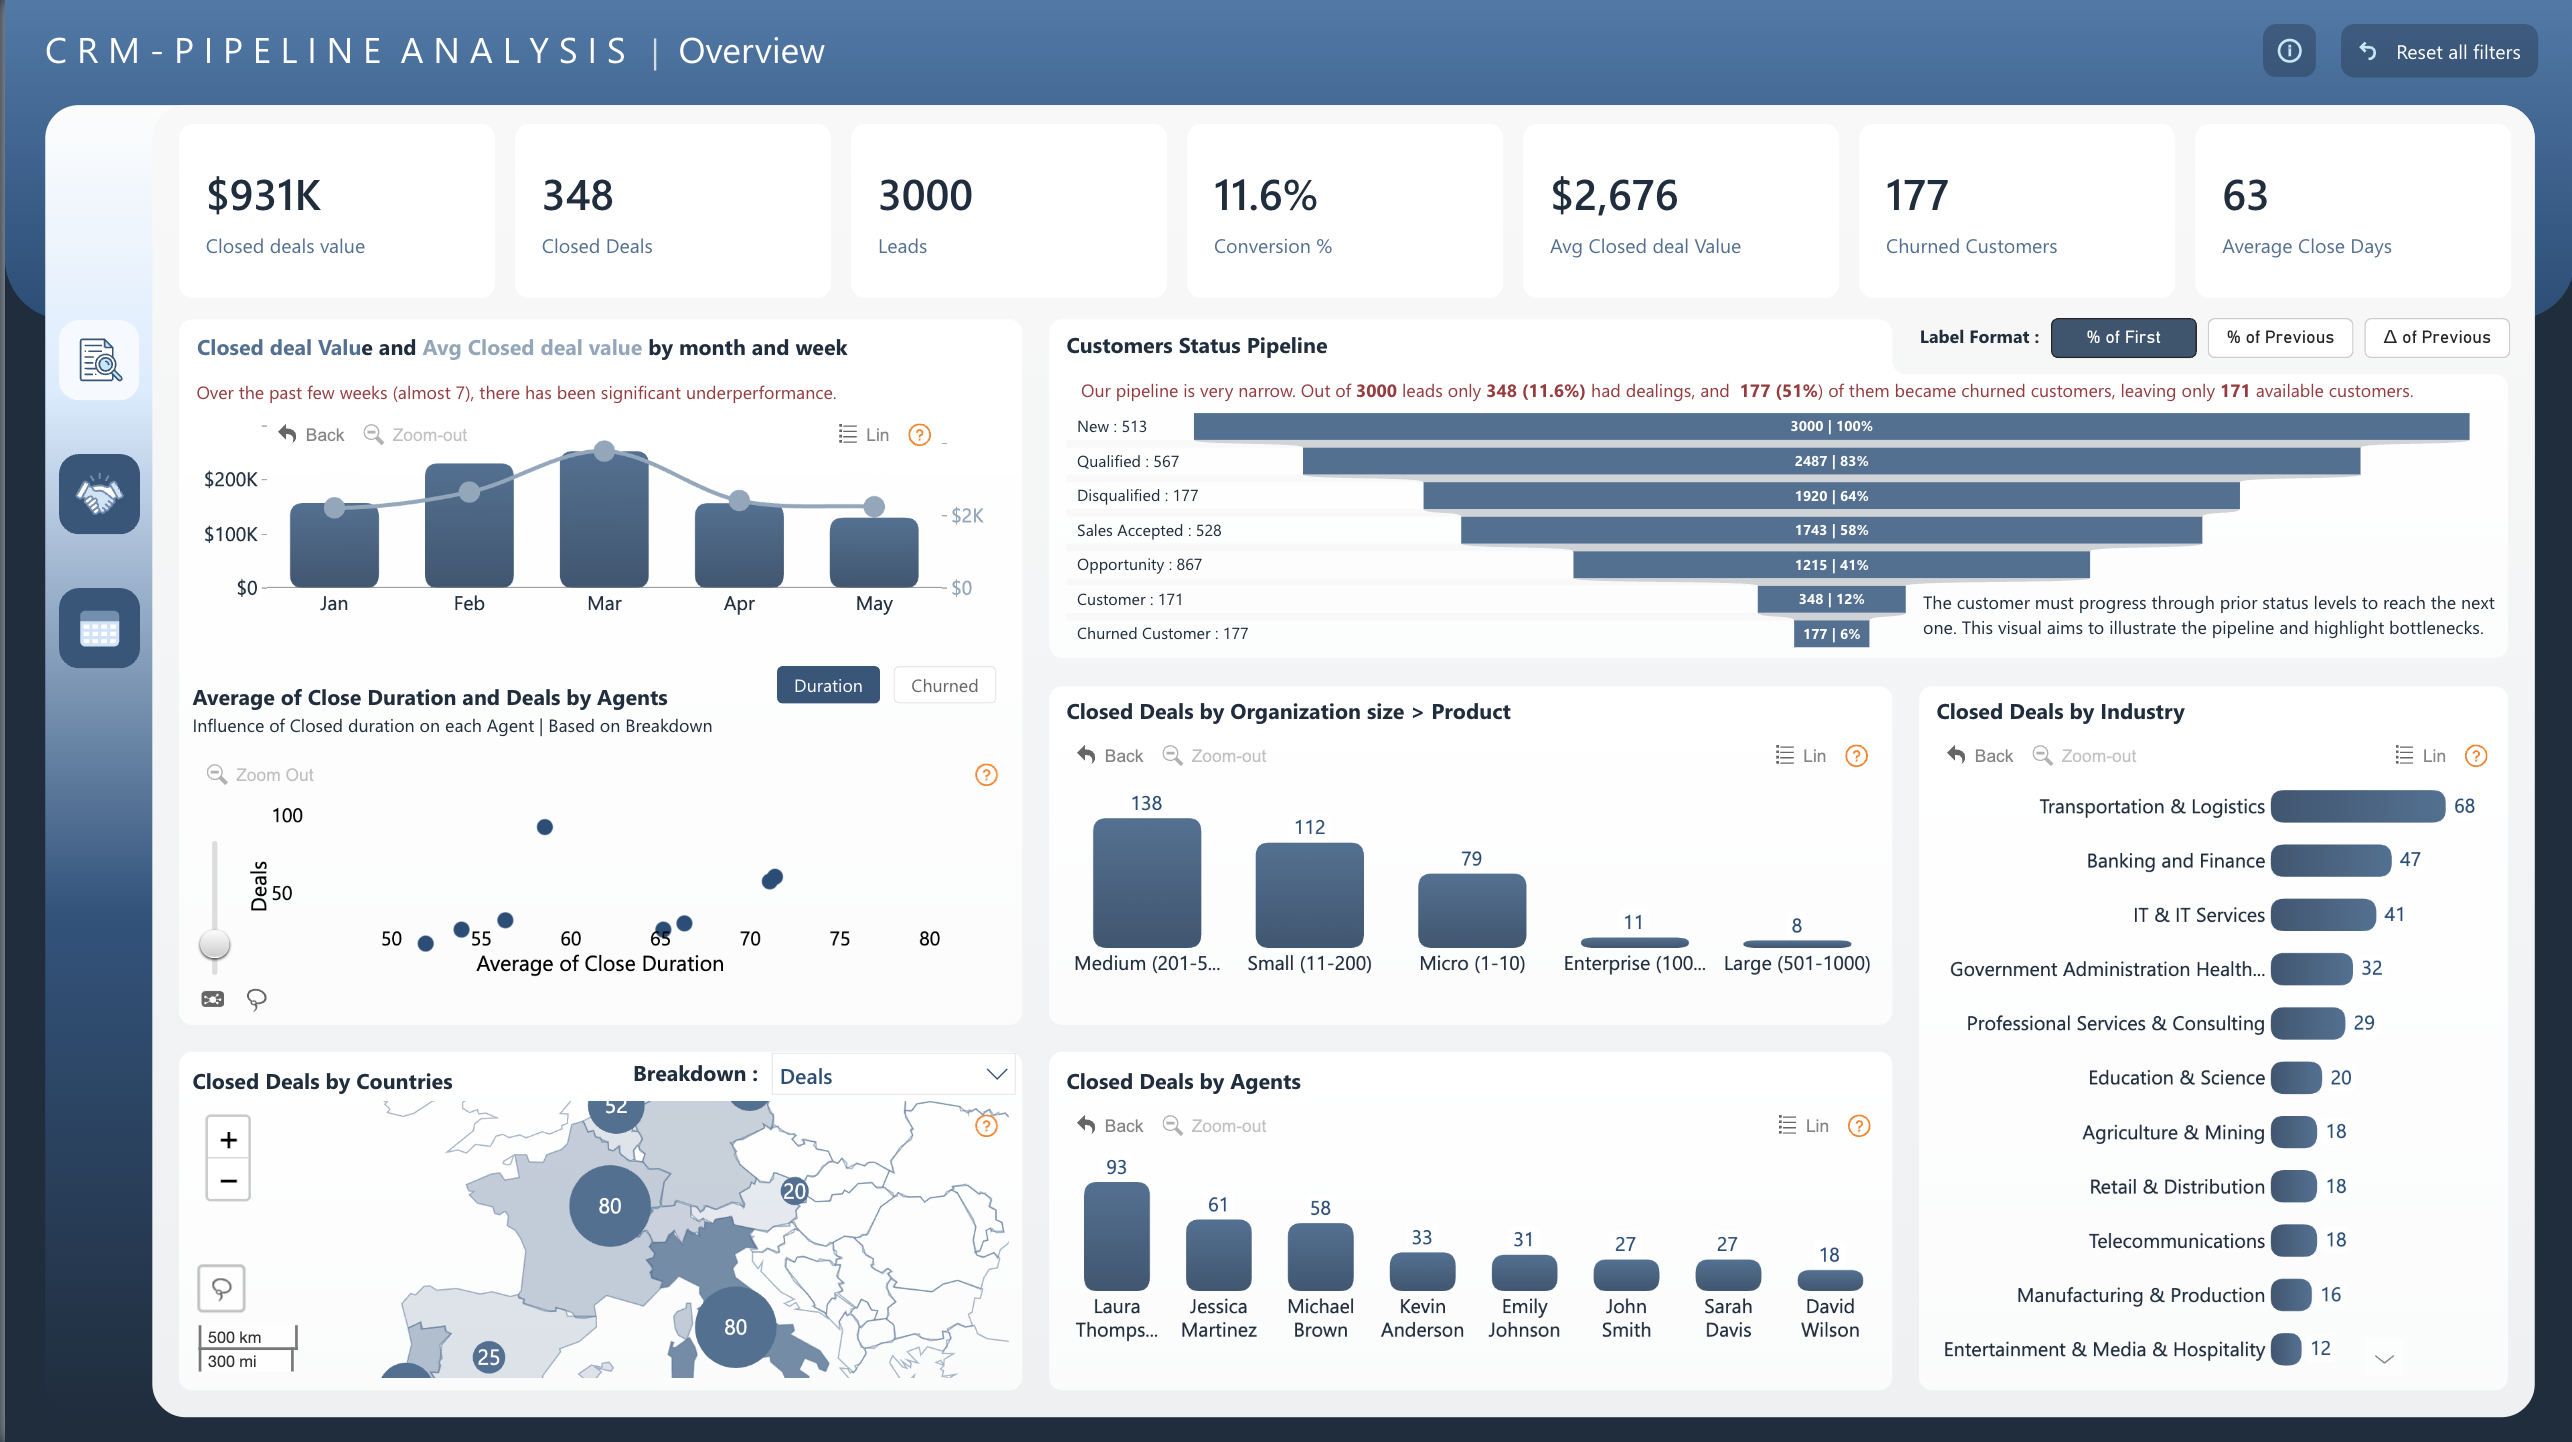
Power BI CRM Pipeline Analysis Dashboard Template (Free PBIX Download)
 Free Sales & Revenue
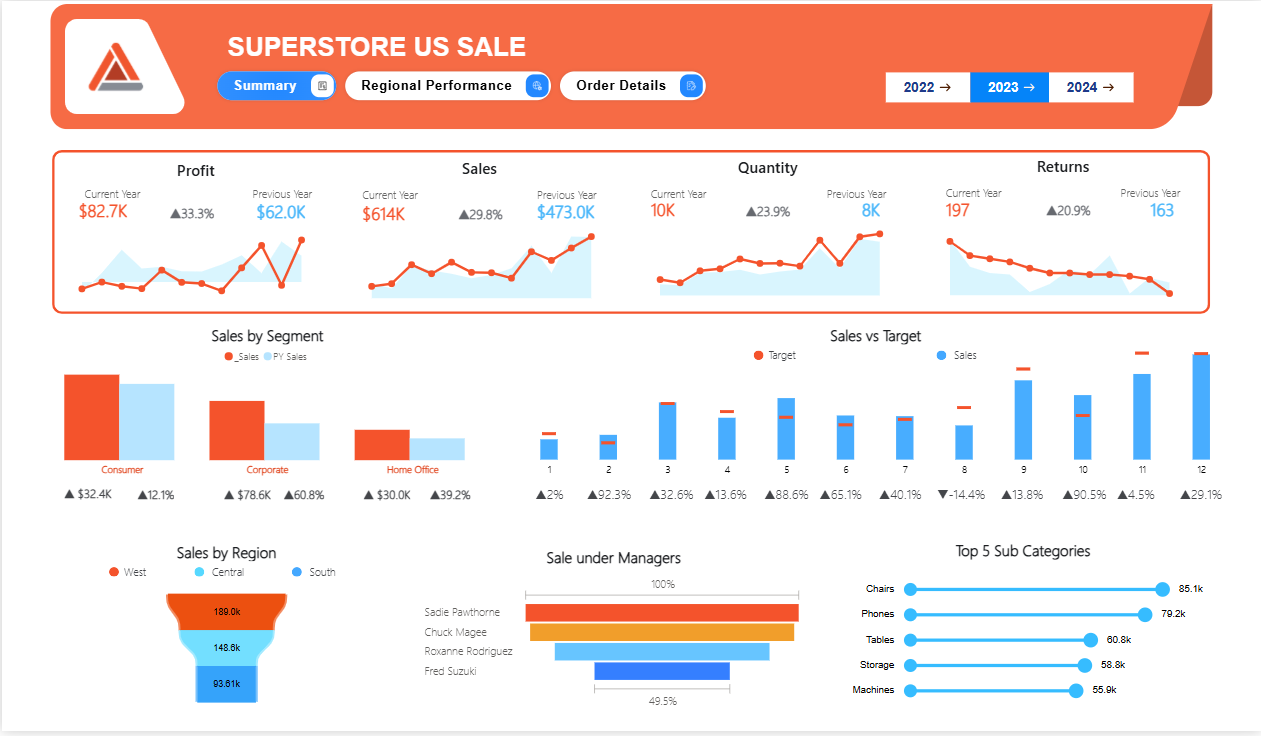
Superstore US Sale Report
 Free Sales & Revenue
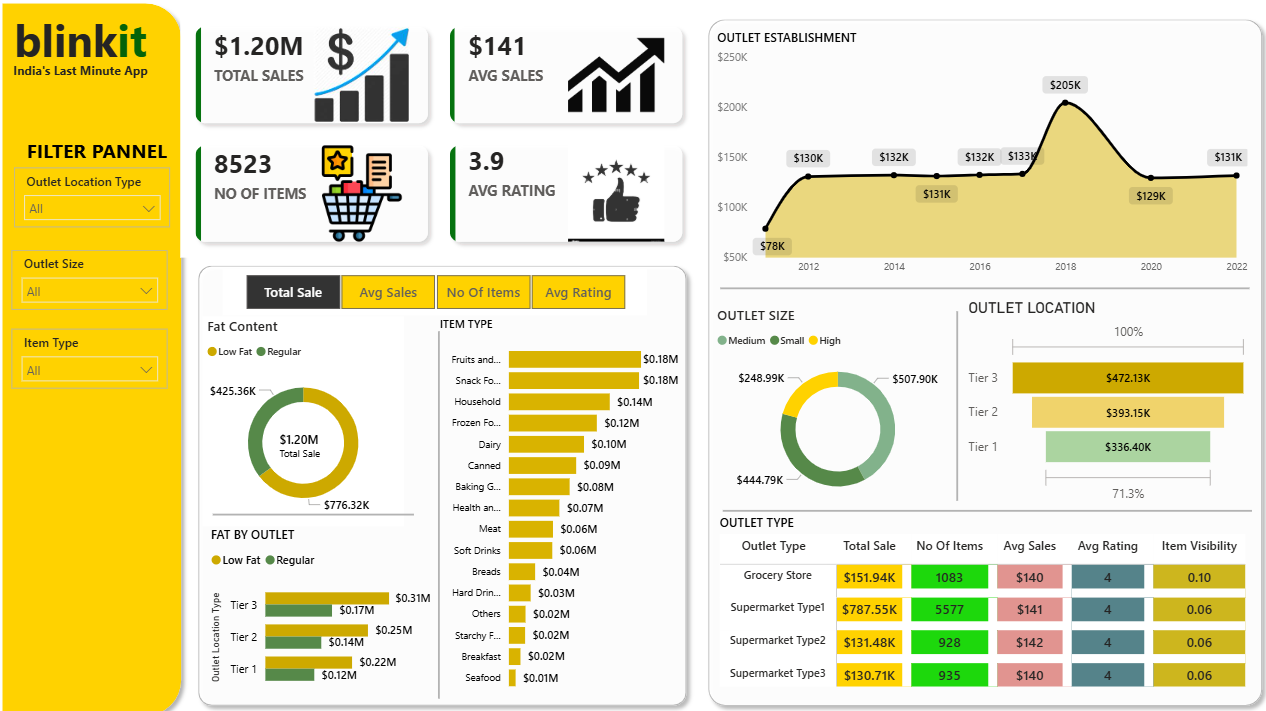
Power BI Blinkit Grocery Sales Dashboard Template (Free PBIX Download)
If you find this website helpful, share it with friends and colleagues to boost their Power BI skills and work efficiency!
Like this site? Share it