Power BI Tech Support Analysis Dashboard Template (Free PBIX Download)
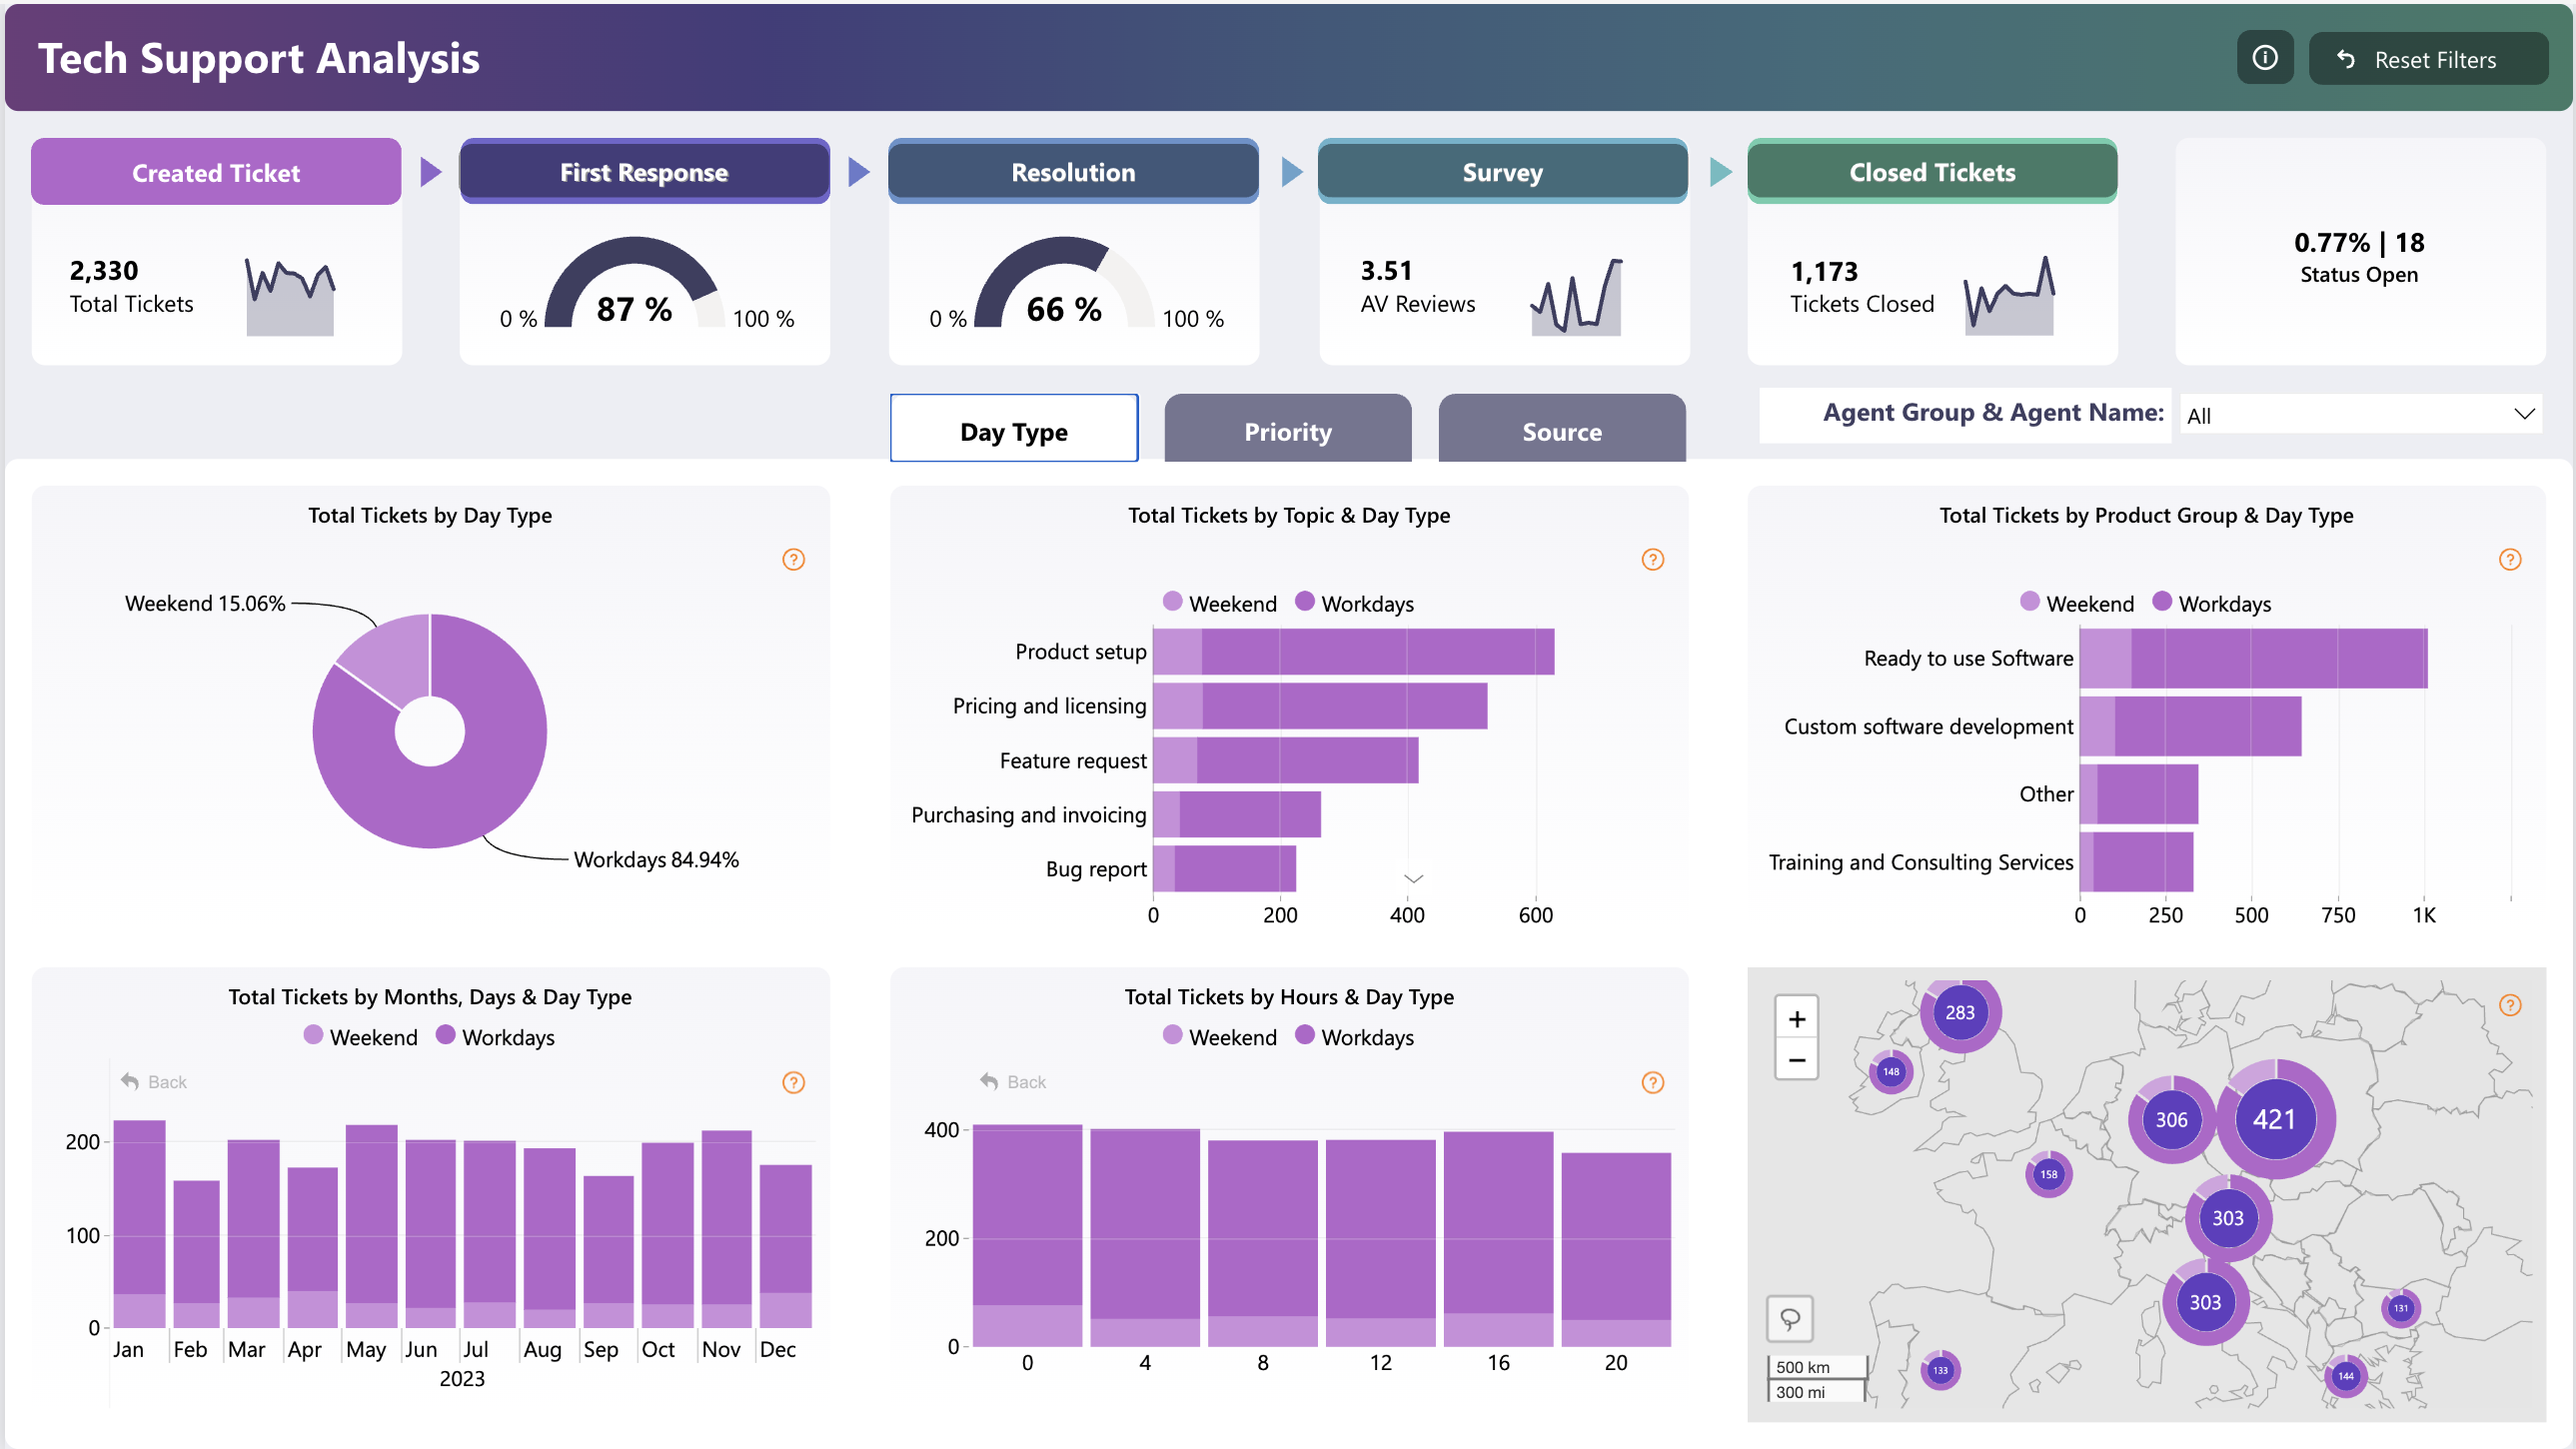
This dashboard delivers end-to-end visibility into a technical support pipeline — from ticket creation through resolution and customer satisfaction survey — across 2,330 tickets. It serves Support Managers and Customer Success leads who need to monitor SLA compliance, agent workload, and topic-level ticket volume simultaneously. The multi-axis breakdown by day type (workday vs weekend), hour, topic, and geography makes it analytically richer than a standard helpdesk report.
1. What's Inside This Template
KPI Pipeline Banner
The top row maps the full support lifecycle as a funnel:
| StageMetricValue | ||
| Created Ticket | Total Tickets | 2,330 |
| First Response | Response Rate | 87% |
| Resolution | Resolution Rate | 66% |
| Survey | Avg Review Score | 3.51 / 5 |
| Closed Tickets | Tickets Closed | 1,173 |
| Status Open | Open Rate | 0.77% (18 tickets) |
The 21-point gap between First Response (87%) and Resolution (66%) is immediately visible — agents are fast to acknowledge but slower to fully resolve.
Donut Chart — Total Tickets by Day Type
- Workdays: 84.94% of all tickets
- Weekends: 15.06% of all tickets
Weekend volume is non-trivial at ~351 tickets, warranting dedicated weekend staffing coverage.
Horizontal Bar — Total Tickets by Topic & Day Type
| TopicApprox. Ticket Count | |
| Product setup | ~620 |
| Pricing and licensing | ~420 |
| Feature request | ~400 |
| Purchasing and invoicing | ~260 |
| Bug report | ~220 |
Product setup dominates — nearly 3× bug reports — suggesting onboarding friction rather than product stability issues.
Horizontal Bar — Total Tickets by Product Group & Day Type
| Product GroupApprox. Count | |
| Ready to use Software | ~950 |
| Custom software development | ~520 |
| Other | ~280 |
| Training and Consulting Services | ~220 |
Ready-to-use software generates almost 2× the volume of custom development, despite the latter requiring more complex support.
Bar Chart — Total Tickets by Month & Day Type (2023)
Monthly volume is relatively stable (150–210/month), with slight peaks around May and October–November. No dramatic seasonal spike.
Bar Chart — Total Tickets by Hour & Day Type
Volume is spread across all business hours (0–20) with workday dominance throughout. The hourly distribution is notably flat — no single hour spike — indicating continuous inbound demand rather than burst patterns.
Geographic Map (Europe)
Ticket clusters are concentrated in Central and Eastern Europe:
| RegionTicket Count | |
| Largest cluster | 421 |
| Second cluster | 306 |
| Third cluster | 303 |
| Fourth cluster | 303 |
| Smaller nodes | 283, 158, 148, 135, 133, 144 |
The 421-ticket cluster (likely Germany/Central Europe) is 37% larger than the next biggest region, indicating a high-density user base requiring localized support.
Navigation Tabs
Dashboard supports multi-dimensional slicing via Day Type / Priority / Source tabs and an Agent Group & Agent Name filter — enabling drill-through by individual agent performance.
2. Key Insights
- The 21-point resolution gap signals a workflow bottleneck, not a staffing shortage. First Response at 87% shows agents are reaching tickets promptly, but Resolution drops to 66% — meaning roughly 1 in 3 acknowledged tickets stalls before closure. The cause is likely escalation queues or cross-team dependency, not volume overload.
- Only 1,173 of 2,330 tickets are confirmed closed — a 50.3% closure rate. With 0.77% explicitly "Status Open" (18 tickets), the remainder likely sits in pending or unresolved states. This hidden backlog represents ~1,139 tickets not yet fully resolved or categorized.
- Product setup is the #1 support driver at ~27% of all tickets. This is a product onboarding signal, not a support quality signal. Investing in better in-app setup guides or onboarding flows could reduce this category substantially without adding agents.
- Weekend volume at 15% (~351 tickets) is too large to ignore. If support staffing drops significantly on weekends, first response and resolution rates likely degrade for that segment — but the current dashboard doesn't surface weekend-specific SLA metrics, which is a gap.
- The 3.51/5 average satisfaction score is mediocre, not good. Sitting 30% below the maximum and well below a "satisfied" threshold of ~4.0, this indicates customers are experiencing support that feels adequate but not impressive. Coupled with the 66% resolution rate, there's a direct correlation to investigate.
- Ready-to-use software generates 2× the ticket volume of custom software despite custom development being inherently more complex. This suggests the self-service software products may have documentation or UX gaps that generate avoidable support demand.
3. Who This Template Is For
- Support Operations Managers who need a single-view dashboard to track SLA compliance across first response, resolution, and CSAT — with the ability to filter by agent, priority, and source without switching reports.
- Customer Success Directors at SaaS companies who want to correlate ticket topic trends with product areas and use geographic clustering to prioritize regional support investments.
- BI Developers in IT or Support Analytics teams who need a ready-to-use Power BI template they can connect to Zendesk, Freshdesk, or ServiceNow exports within a working session.
4. How to Use
- Download the PBIX file from the Flexa Intel gallery.
- Open in Power BI Desktop (any version from 2023 onward).
- Connect your data source — typically a flat export from Zendesk, Freshdesk, Jira Service Management, ServiceNow, or a SQL helpdesk table with ticket ID, timestamps, status, topic, agent, and customer rating columns.
- All visuals update automatically — KPI cards, donut, bar charts, hourly breakdown, and geographic map refresh to reflect your ticket data, with Day Type logic calculated from your date column.
This dashboard excels at visual trend analysis but lacks a structured agent-level performance table — no ranked view showing each agent's ticket count, resolution rate, avg response time, and CSAT side by side. Flexa Tables is a Microsoft-certified Power BI visual built for exactly this — multi-column tabular reporting with conditional formatting, sortable columns, and expandable agent group hierarchies, making it ideal for weekly support team reviews.
Other Templates
 Free
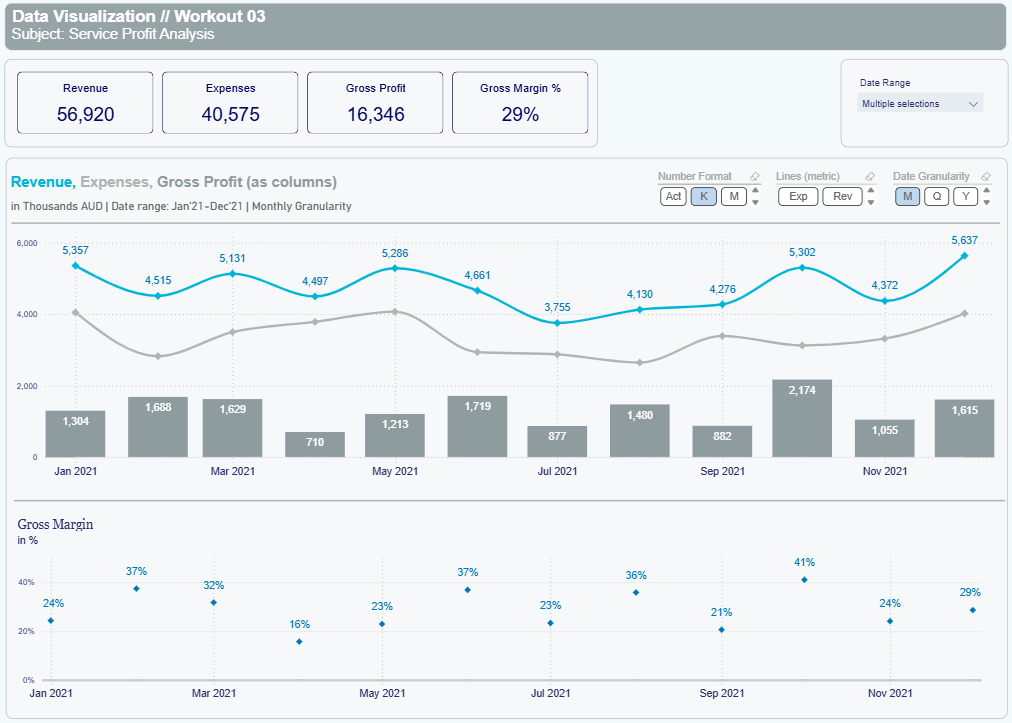
Free Power BI Service Profit Analysis Dashboard Template (Free PBIX Download)
 Free Human Resources
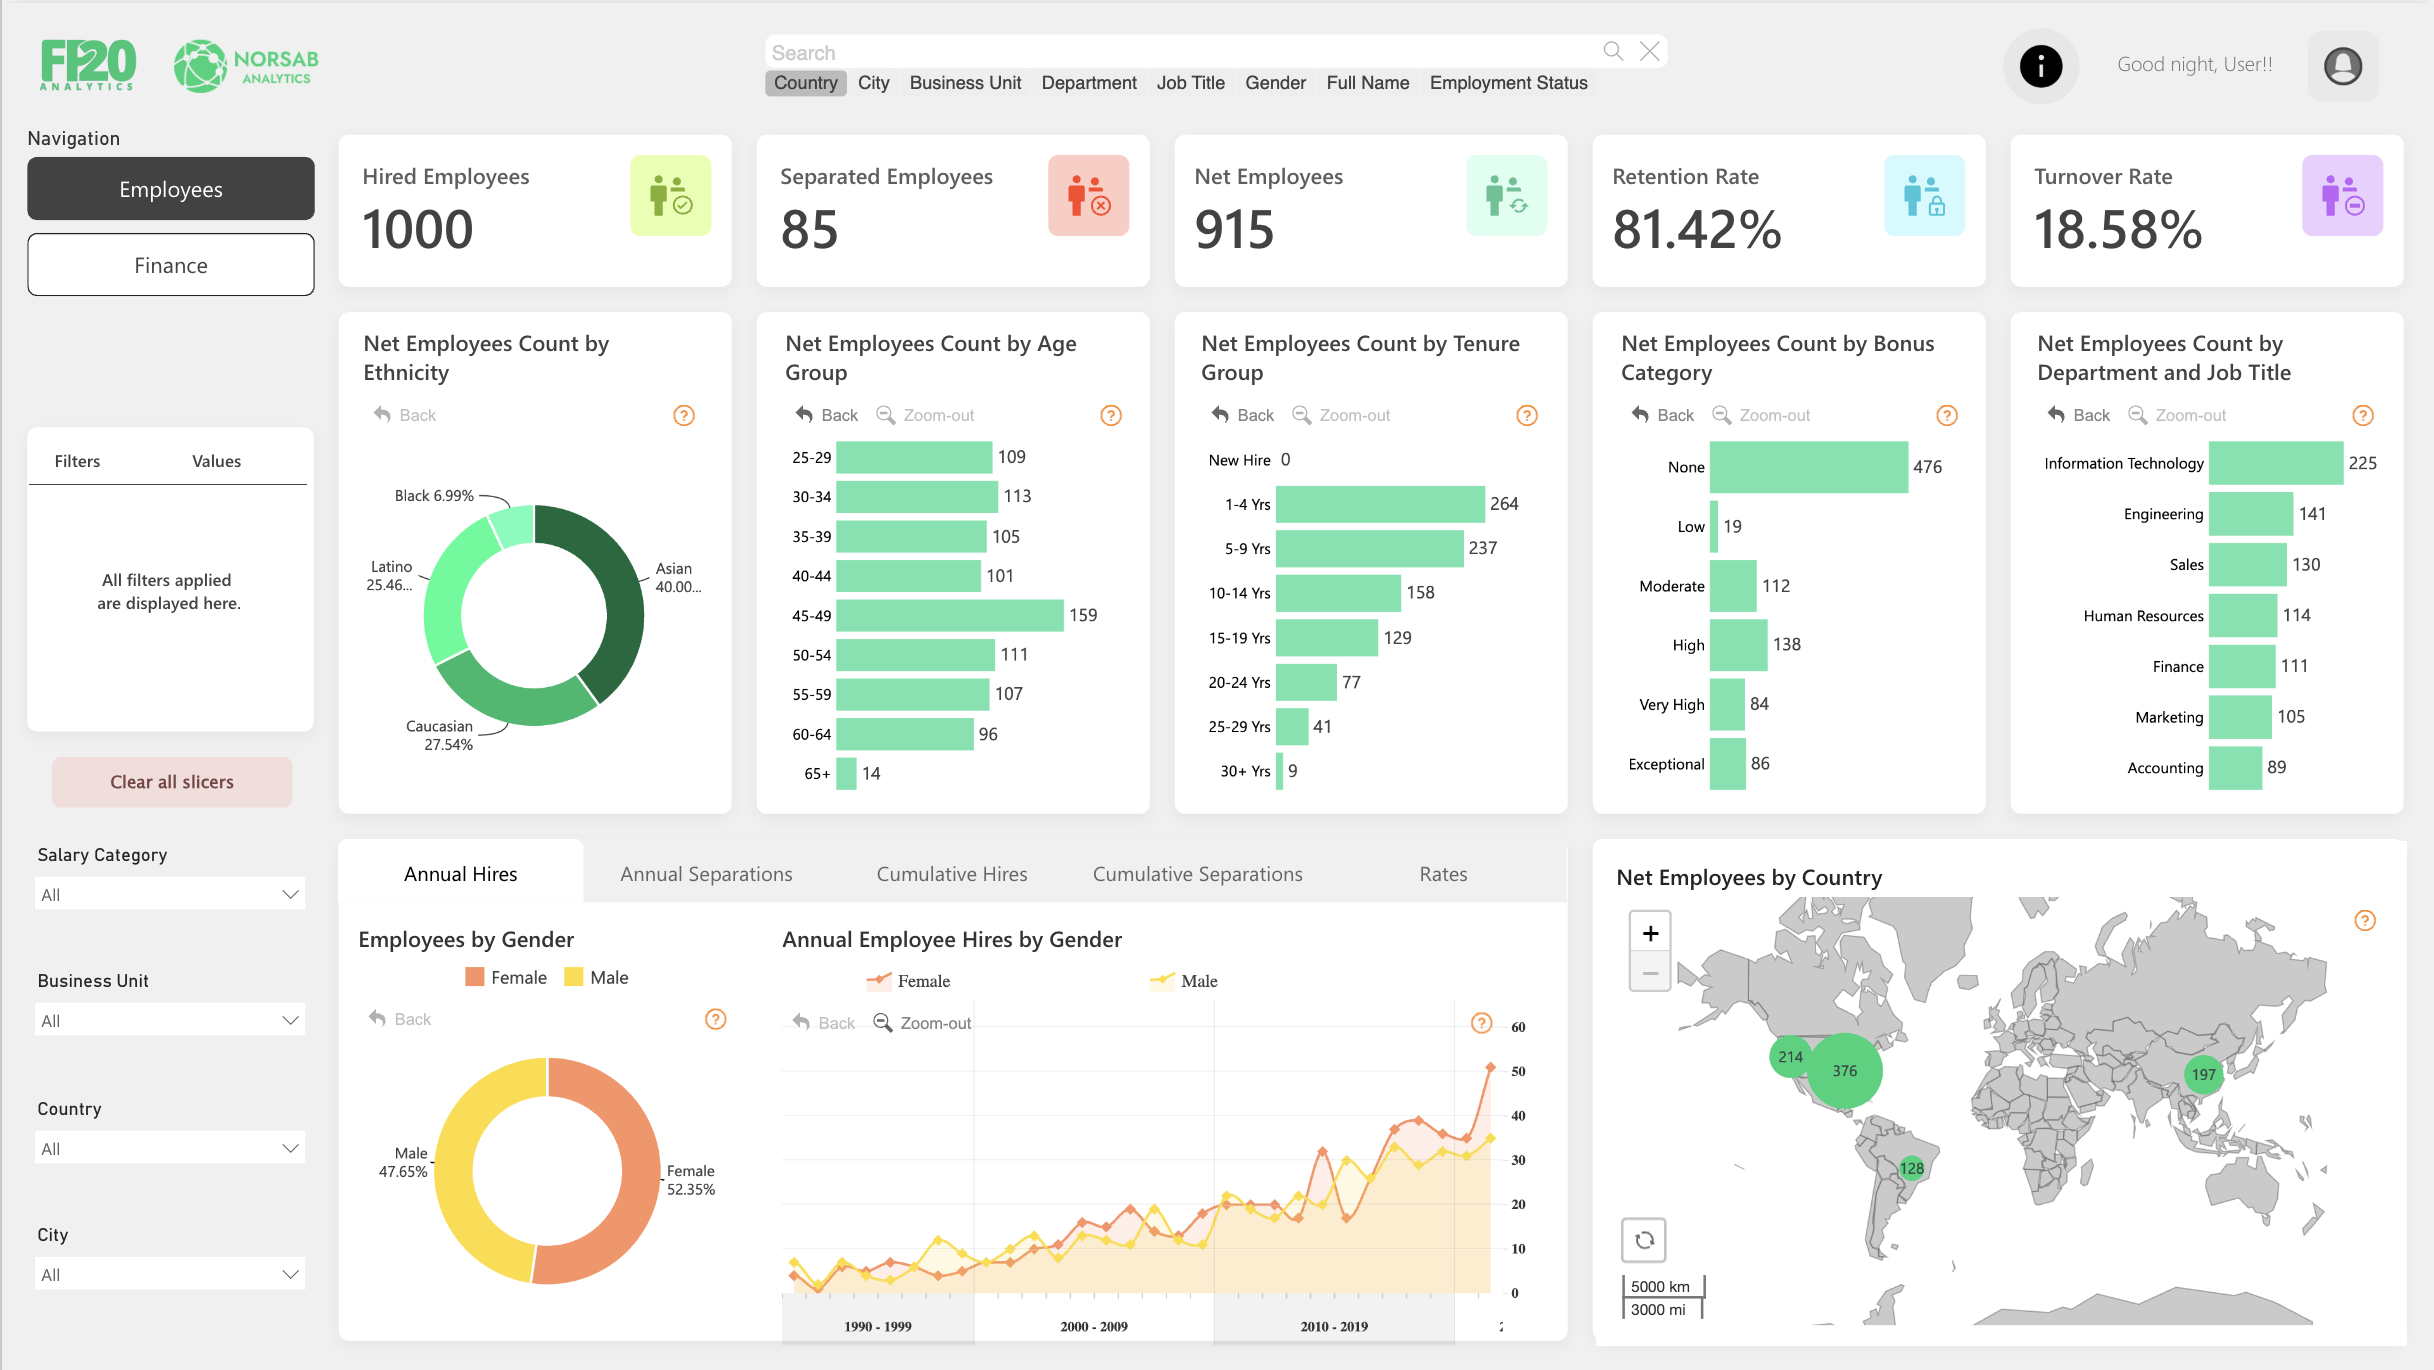
Power BI HR Analytics Dashboard Template (Free PBIX Download)
 Free Sales & Revenue
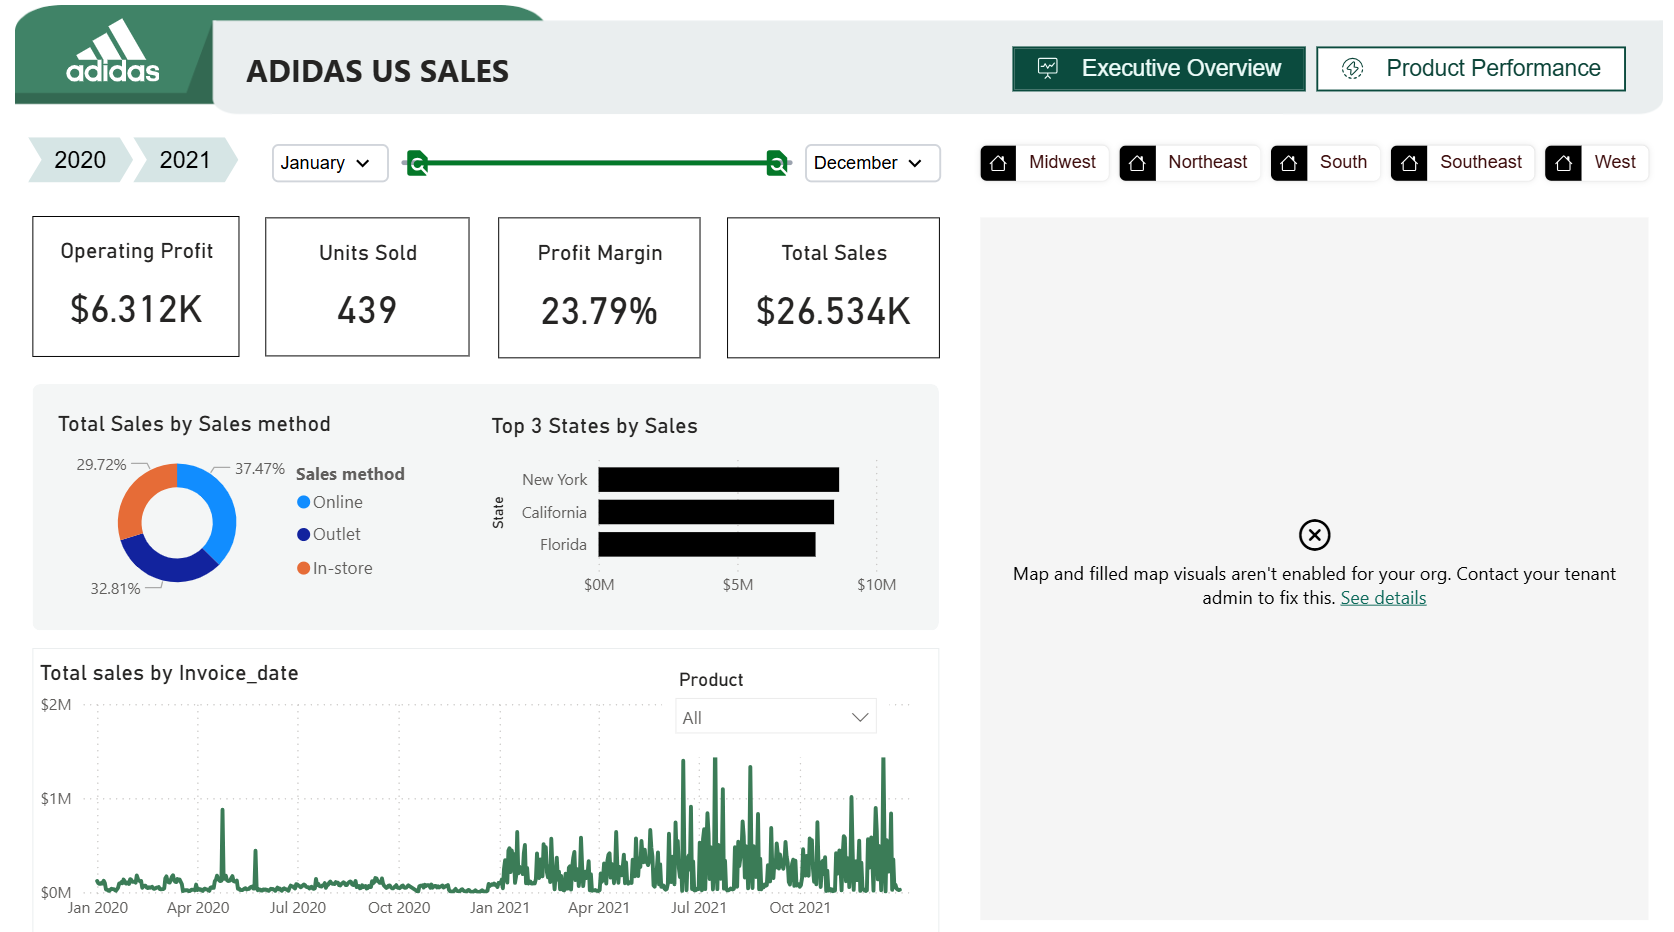
Adidas US Sales (2020–2021)
If you find this website helpful, share it with friends and colleagues to boost their Power BI skills and work efficiency!
Like this site? Share it