Power BI Supply Chain Management Overview Dashboard Template (Free PBIX Download)
Introduction
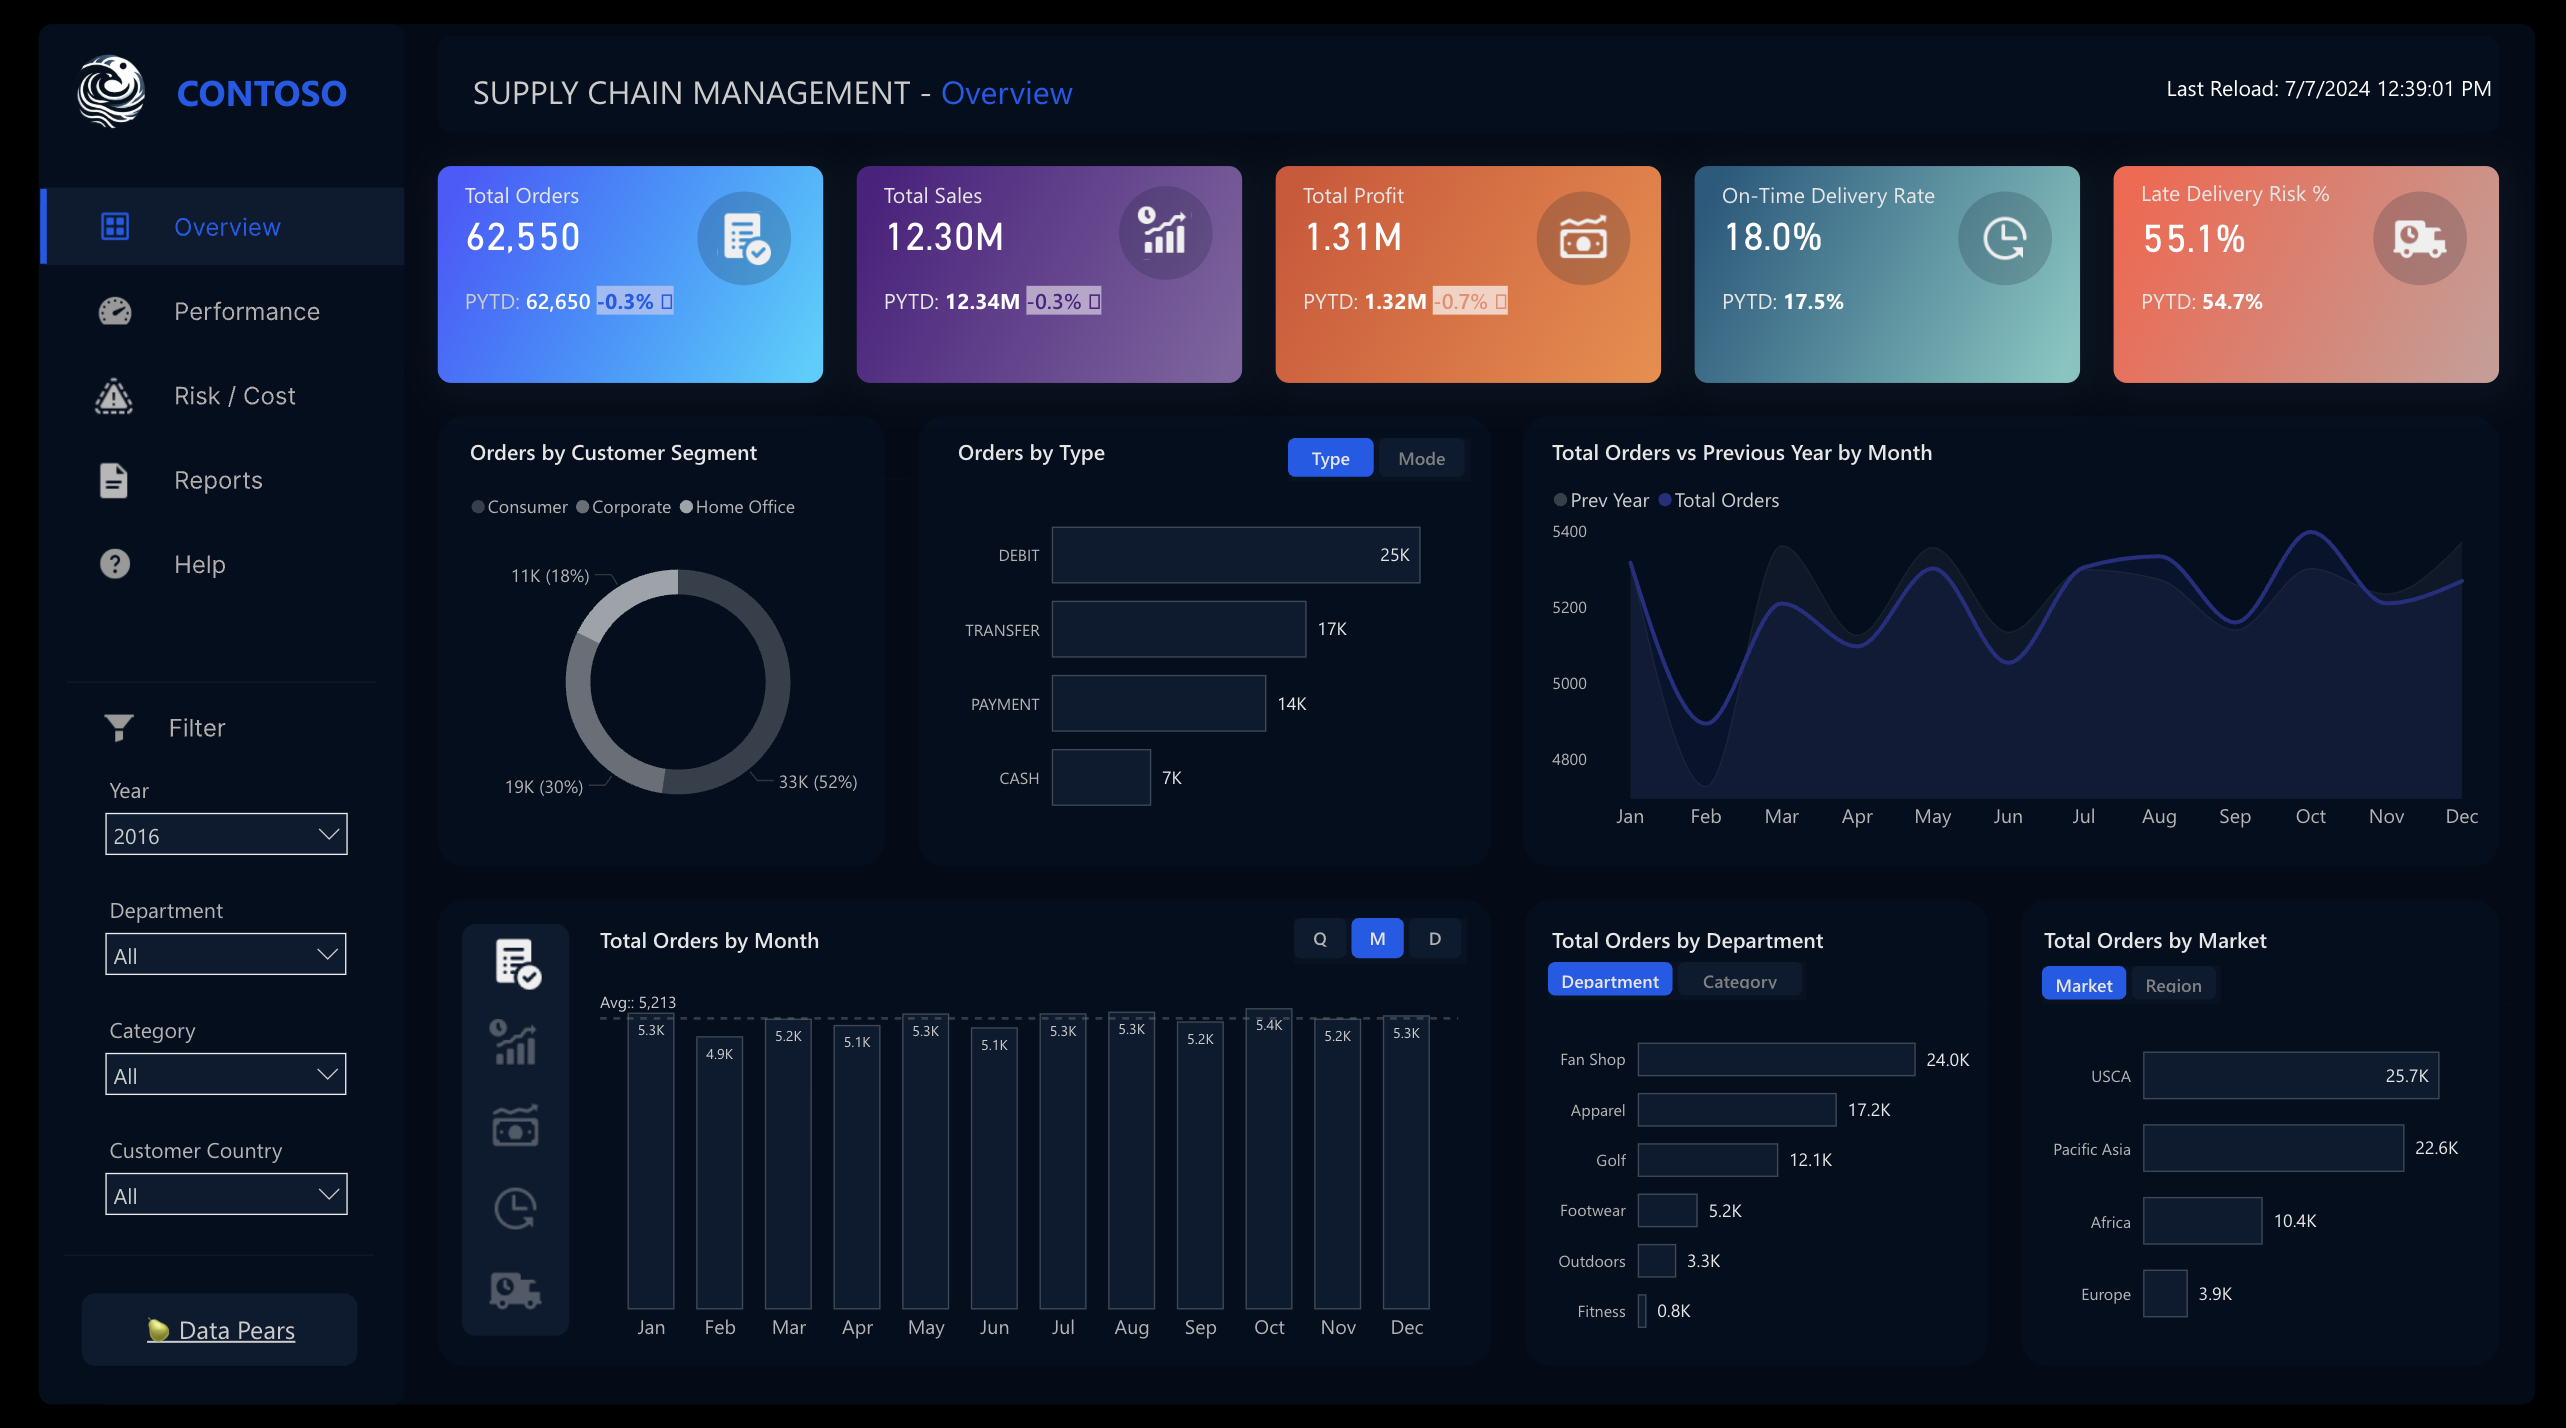
This dashboard gives Supply Chain Directors and Operations leaders a real-time overview of order flow, revenue performance, delivery reliability, and market distribution across a global retail supply chain. Built on the Contoso dataset — one of the most widely used enterprise retail simulation datasets — it covers 62,550 orders across departments, customer segments, payment types, and international markets. The combination of late delivery risk scoring, on-time delivery rate, and month-over-month order trend makes it one of the most operationally actionable supply chain templates available for Power BI practitioners.
What's Inside This Template
KPI Banner — Five Critical Supply Chain Metrics
| MetricCurrent ValuePYTDYoY Change | |||
| Total Orders | 62,550 | 62,650 | −0.3% |
| Total Sales | $12.30M | $12.34M | −0.3% |
| Total Profit | $1.31M | $1.32M | −0.7% |
| On-Time Delivery Rate | 18.0% | 17.5% | +0.5pp |
| Late Delivery Risk % | 55.1% | 54.7% | +0.4pp |
Every financial metric is marginally declining year-over-year while the two delivery risk metrics are simultaneously worsening. Orders down 0.3%, Sales down 0.3%, Profit down 0.7% — profit declining faster than revenue confirms margin compression. More critically, Late Delivery Risk at 55.1% means more than half of all active orders carry a risk of late delivery — a structural fulfillment problem, not an outlier event.
Donut Chart — Orders by Customer Segment
| SegmentOrdersShare | ||
| Consumer | 33K | 52% |
| Corporate | 19K | 30% |
| Home Office | 11K | 18% |
Consumer segment dominates at 52% — consistent with a B2C-weighted retail supply chain. Corporate at 30% and Home Office at 18% represent the B2B tail. Combined B2B (Corporate + Home Office) is 48% — close to parity with Consumer, suggesting this is a hybrid B2B/B2C operation where both segments require distinct fulfillment SLAs.
Bar Chart — Orders by Payment Type
| Payment TypeOrders | |
| Debit | 25K |
| Transfer | 17K |
| Payment | 14K |
| Cash | 7K |
Debit leads at 25K — 40% of all orders. Cash at 7K (11.2%) is the lowest, suggesting the majority of the customer base is digitally banked. The "Payment" category at 14K likely represents online payment gateways or card-not-present transactions. The absence of credit-specific categories suggests this may be a non-US market or a B2B-heavy payment structure where wire transfers (17K) are common.
Line Chart — Total Orders vs Previous Year by Month
| MonthApprox. Current OrdersApprox. PY Orders | ||
| Jan | 5,300 | 5,350 |
| Feb | 4,900 | 5,000 |
| Mar | 5,200 | 5,150 |
| Apr | 5,100 | 5,050 |
| May | 5,300 | 5,200 |
| Jun | 5,100 | 5,150 |
| Jul | 5,300 | 5,100 |
| Aug | 5,300 | 5,200 |
| Sep | 5,200 | 5,250 |
| Oct | 5,400 | 5,300 |
| Nov | 5,200 | 5,350 |
| Dec | 5,300 | 5,400 |
Current year (blue) and previous year (grey) lines track almost identically throughout — the −0.3% gap is real but visually negligible. The most notable feature is the February trough (~4,900) recovering through March, then a relatively flat mid-year plateau before a modest Q4 uptick. No dramatic seasonal peak confirms this is a steady-state supply chain rather than a holiday-dependent retail model.
Bar Chart — Total Orders by Month (Monthly granularity toggle: Q/M/D)
Monthly average of 5,213 orders confirmed. February is the only month visibly below average (4.9K). All other months cluster tightly between 5.1K and 5.4K — an exceptionally flat demand curve indicating predictable, programmable supply chain requirements. This is operationally ideal but also means any efficiency gain must come from process improvement, not demand smoothing.
Bar Chart — Total Orders by Department
| DepartmentOrders | |
| Fan Shop | 24.0K |
| Apparel | 17.2K |
| Golf | 12.1K |
| Footwear | 5.2K |
| Outdoors | 3.3K |
| Fitness | 0.8K |
Fan Shop dominates at 24.0K — 38.4% of all orders and 40% more than the second-largest department (Apparel at 17.2K). Fan Shop and Apparel together account for 41.2K orders — 65.9% of total volume. Golf at 12.1K is a significant third tier. Fitness at 0.8K is nearly negligible — a candidate for consolidation or discontinuation from a supply chain planning perspective.
Bar Chart — Total Orders by Market
| MarketOrders | |
| USCA | 25.7K |
| Pacific Asia | 22.6K |
| Africa | 10.4K |
| Europe | 3.9K |
USCA (US + Canada) leads at 25.7K but Pacific Asia is close behind at 22.6K — only a 13.7% gap. Together these two markets account for 77.5% of total orders. Africa at 10.4K is a meaningful third market. Europe at 3.9K is surprisingly low for a global supply chain — either a nascent market or one served through a different distribution channel not captured in this dataset.
Navigation Structure
Five-page report: Overview (current), Performance, Risk / Cost, Reports, Help — a complete supply chain analytical suite covering operational KPIs, risk profiling, cost analysis, and exportable reports in a single PBIX file.
Key Insights
- An 18% on-time delivery rate paired with 55.1% late delivery risk is not a supply chain under pressure — it is a supply chain in structural failure. Only 18 in every 100 orders arrive on time, and more than half of all active orders are flagged as late delivery risks. For context, industry benchmarks for on-time delivery in retail supply chains typically range from 85–95%. This dashboard is documenting a 67-point gap below minimum acceptable performance, which demands immediate escalation beyond analytics.
- Profit declining 0.7% while sales declined only 0.3% confirms margin compression is accelerating faster than revenue loss. Every $1 of lost sales is costing $2.33 in lost profit at current rates of decline. The compounding effect of late delivery risk (which drives customer service costs, reshipments, and returns) is the most likely driver — a cost not directly visible in this dashboard but implied by the 55.1% late delivery risk figure.
- Fan Shop at 38.4% of all orders dominating a supply chain with 55.1% late delivery risk creates a concentrated customer satisfaction crisis. Fan Shop products are typically event-driven and time-sensitive — sports merchandise tied to seasons, games, or team announcements. Late delivery for this category is not merely inconvenient; it renders products worthless after the event window closes. The department with the highest volume is operating inside the worst possible fulfillment environment.
- Pacific Asia at 22.6K orders — only 13.7% behind USCA (25.7K) — is the fastest-growing strategic market but likely also the primary contributor to late delivery risk. Cross-Pacific supply chains carry the longest lead times, highest customs variability, and greatest carrier disruption exposure. The near-parity between USCA and Pacific Asia in order volume, combined with a 55.1% late delivery risk across the total portfolio, strongly suggests Pacific Asia is disproportionately driving the late delivery metric.
- February's consistent order trough (4.9K vs 5.2K+ every other month) is a predictable demand valley that supply chain planners are likely not fully exploiting. February's lower volume creates a natural window for warehouse reorganization, carrier contract renegotiation, and system maintenance without disrupting peak fulfillment. If late delivery risk spikes in Q1, February's low volume is the intervention window that the dashboard implicitly identifies.
- Europe at 3.9K orders — 15.2% of USCA volume — is either a massively underpenetrated market opportunity or a deliberate strategic deprioritization. For a supply chain operating at Contoso's scale across USCA, Pacific Asia, and even Africa, European order volume at this level is anomalous. If late delivery risk in Europe is near the portfolio average (55.1%), the combination of low volume and poor fulfillment makes it a market requiring a fundamental distribution strategy review before any growth investment.
Who This Template Is For
- Supply Chain Directors and VP of Operations at global retail or wholesale companies who need a multi-page Power BI report covering order flow, delivery performance, and market distribution — with drill-through into Risk/Cost and Performance pages — without building the analytical framework from scratch.
- Logistics and Fulfillment Managers who need to monitor on-time delivery rate and late delivery risk against prior-year benchmarks at the department, market, and customer segment level, and present those findings in a board-ready dark-theme format.
- BI Developers and Power BI Consultants who want a production-grade, multi-page supply chain template built on the widely available Contoso dataset — connectable to any ERP (SAP, Oracle, Dynamics 365) or order management system export with minimal field mapping.
How to Use
Download the PBIX file from the Flexa Intel gallery. Open in Power BI Desktop (2023 or later for dark theme and icon visual support). Connect your data source — typically an ERP or OMS export (SAP, Oracle, Dynamics 365, or a flat order table) with fields for order ID, order date, ship date, delivery date, customer segment, department, category, market, region, payment type, sales amount, profit, and delivery status flag. All visuals update automatically across all five report pages — KPI cards with PYTD comparisons, segment and payment donuts, monthly trend lines, department and market bars, and the Risk/Cost page delivery risk calculations all recalculate from your connected data.
This dashboard visualizes supply chain volume and delivery risk powerfully across geography and department, but lacks a structured department-by-market matrix table — no ranked view showing each department's order count per market, on-time delivery rate, late delivery risk percentage, and profit contribution side by side. Flexa Tables is a Microsoft-certified Power BI visual built for exactly this — multi-column supply chain reporting with conditional formatting by delivery risk tier, sortable department rankings, and expandable market-to-region-to-category hierarchies, making weekly fulfillment reviews and carrier performance briefings dramatically faster and more actionable.
Other Templates
 Free Marketing
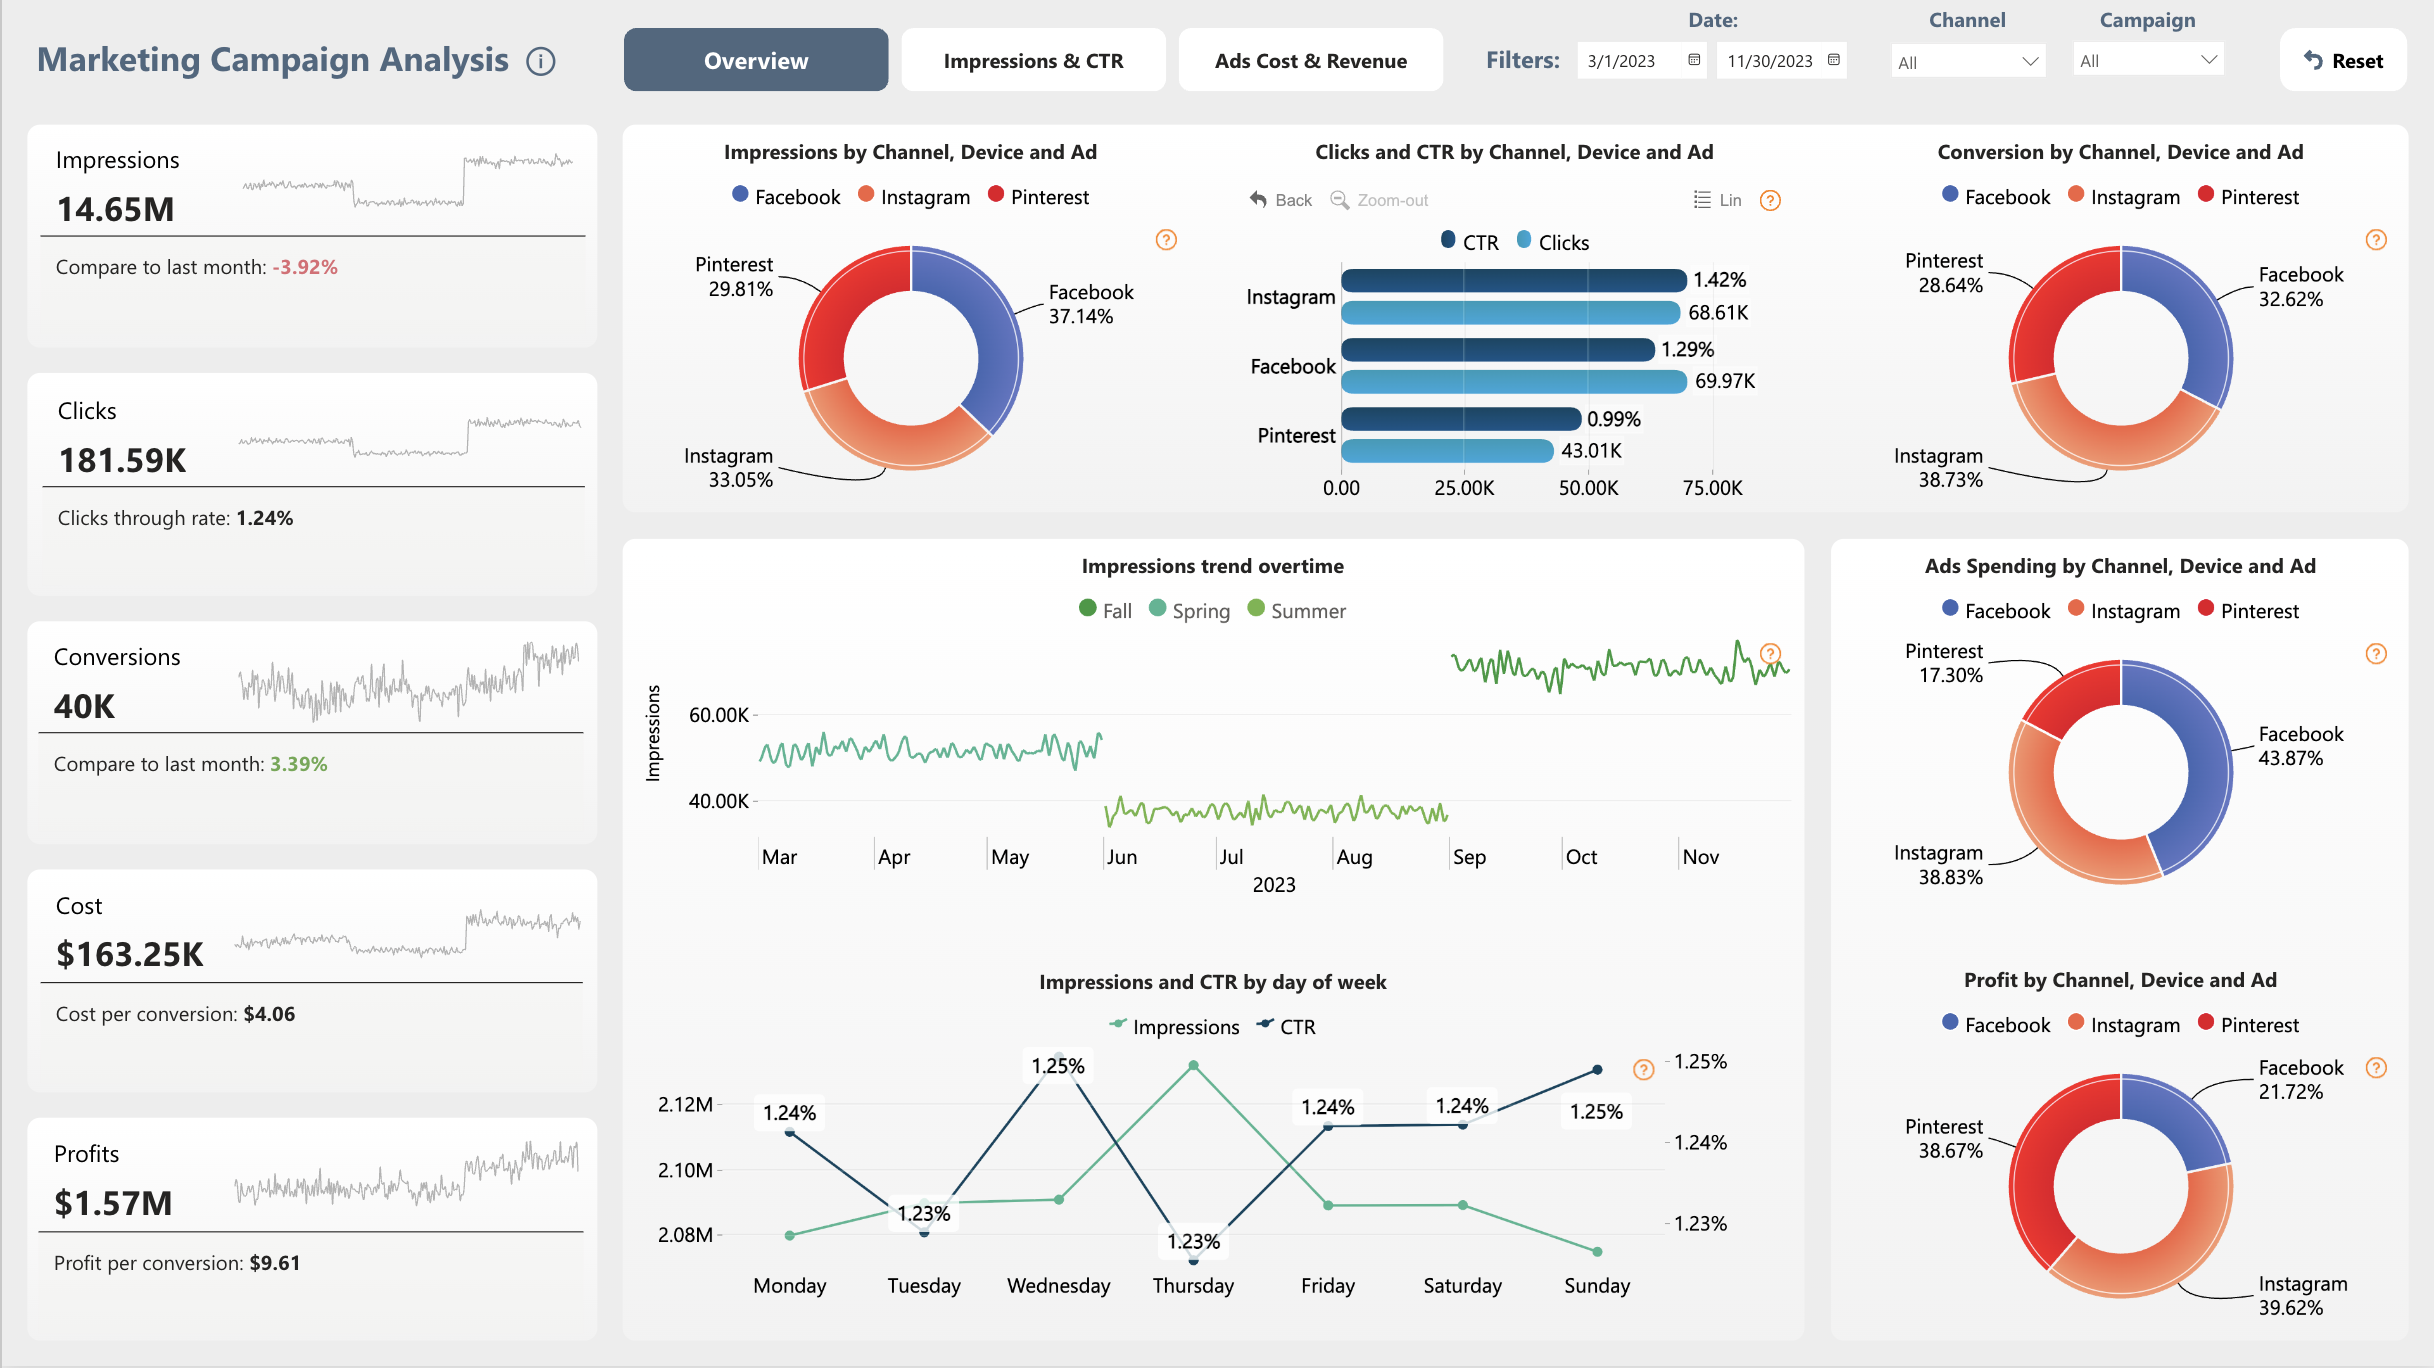
Power BI Marketing Campaign Analysis Dashboard Template (Free PBIX Download)
 Free Sales & Revenue
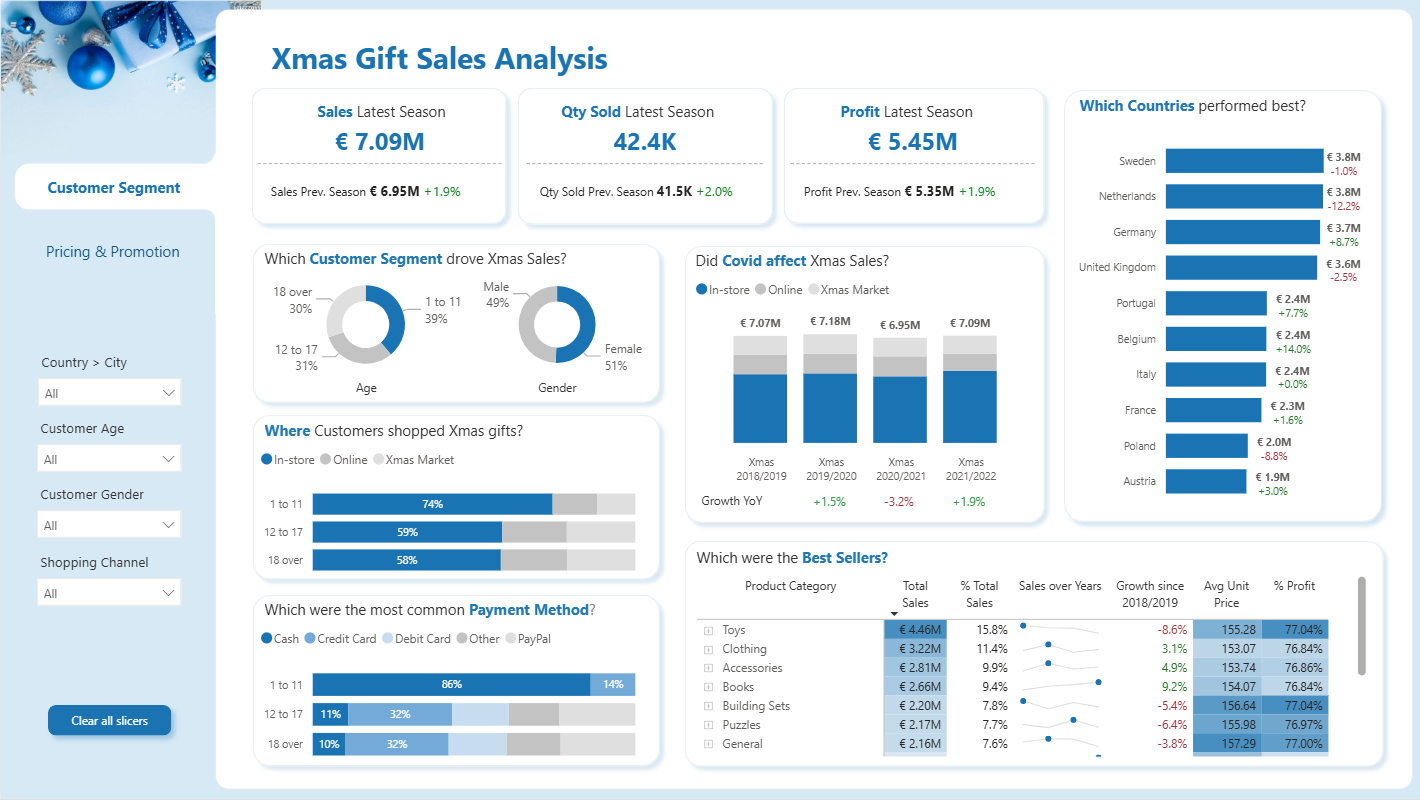
Power BI Christmas Gift Sales Analysis Dashboard (Free PBIX Download)
 Free Operations & Production
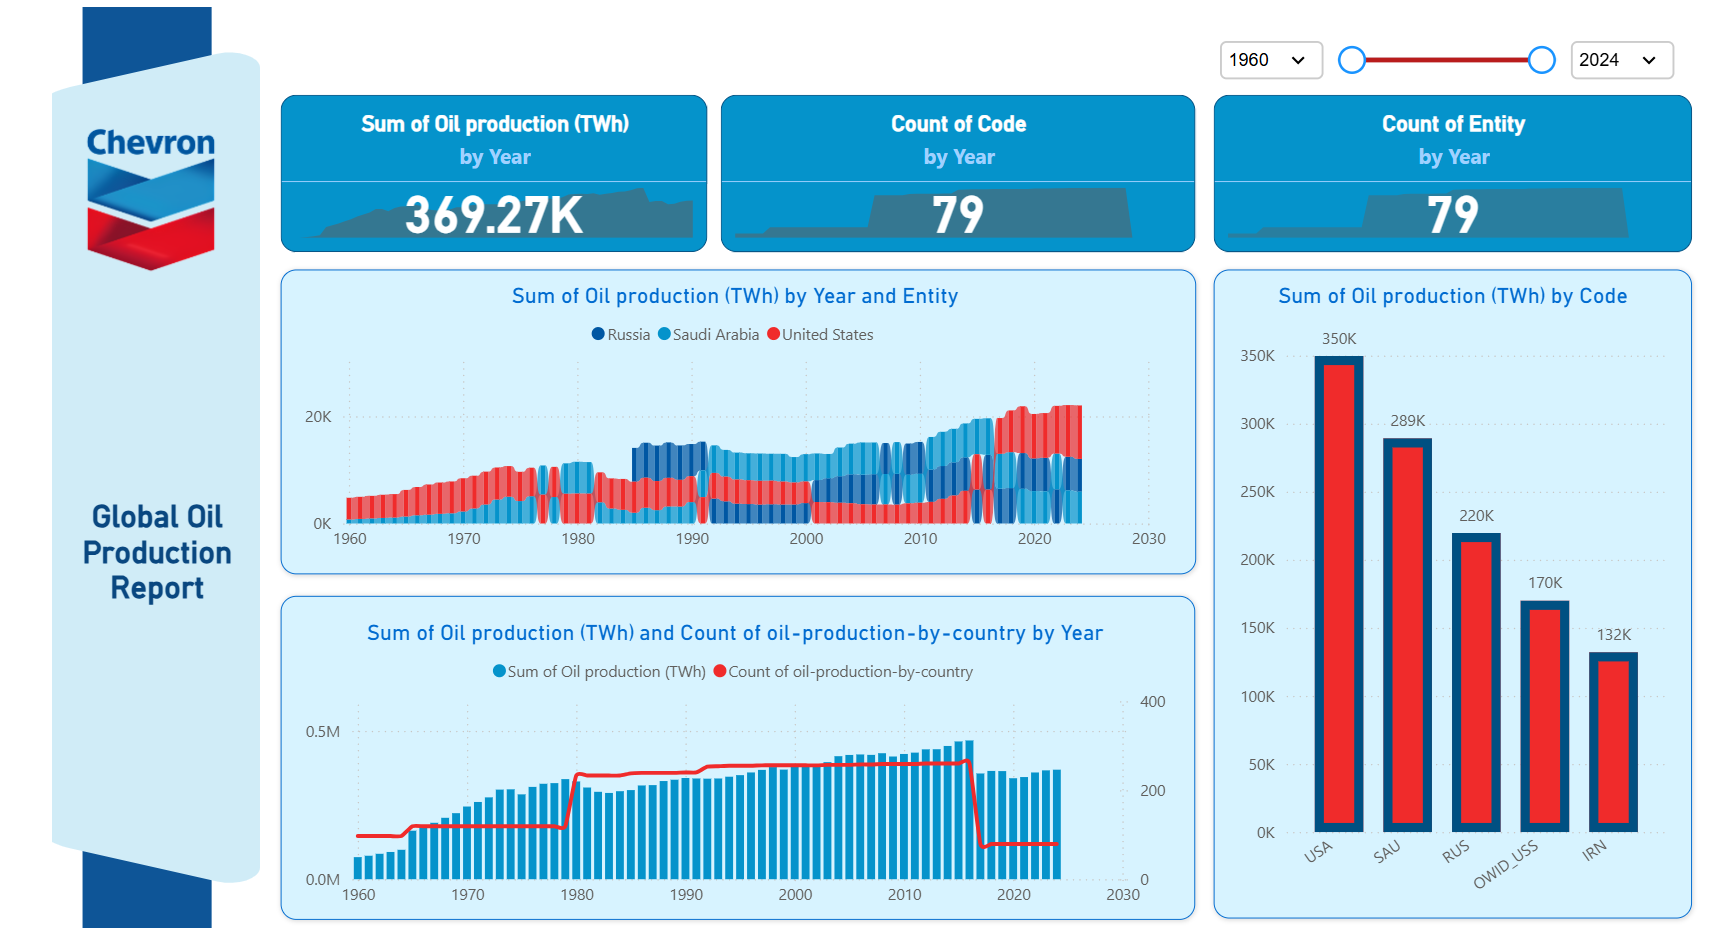
Global Oil Production Report
If you find this website helpful, share it with friends and colleagues to boost their Power BI skills and work efficiency!
Like this site? Share it