Power BI Shark Tank US Analysis Dashboard Template (Free PBIX Download)
Introduction
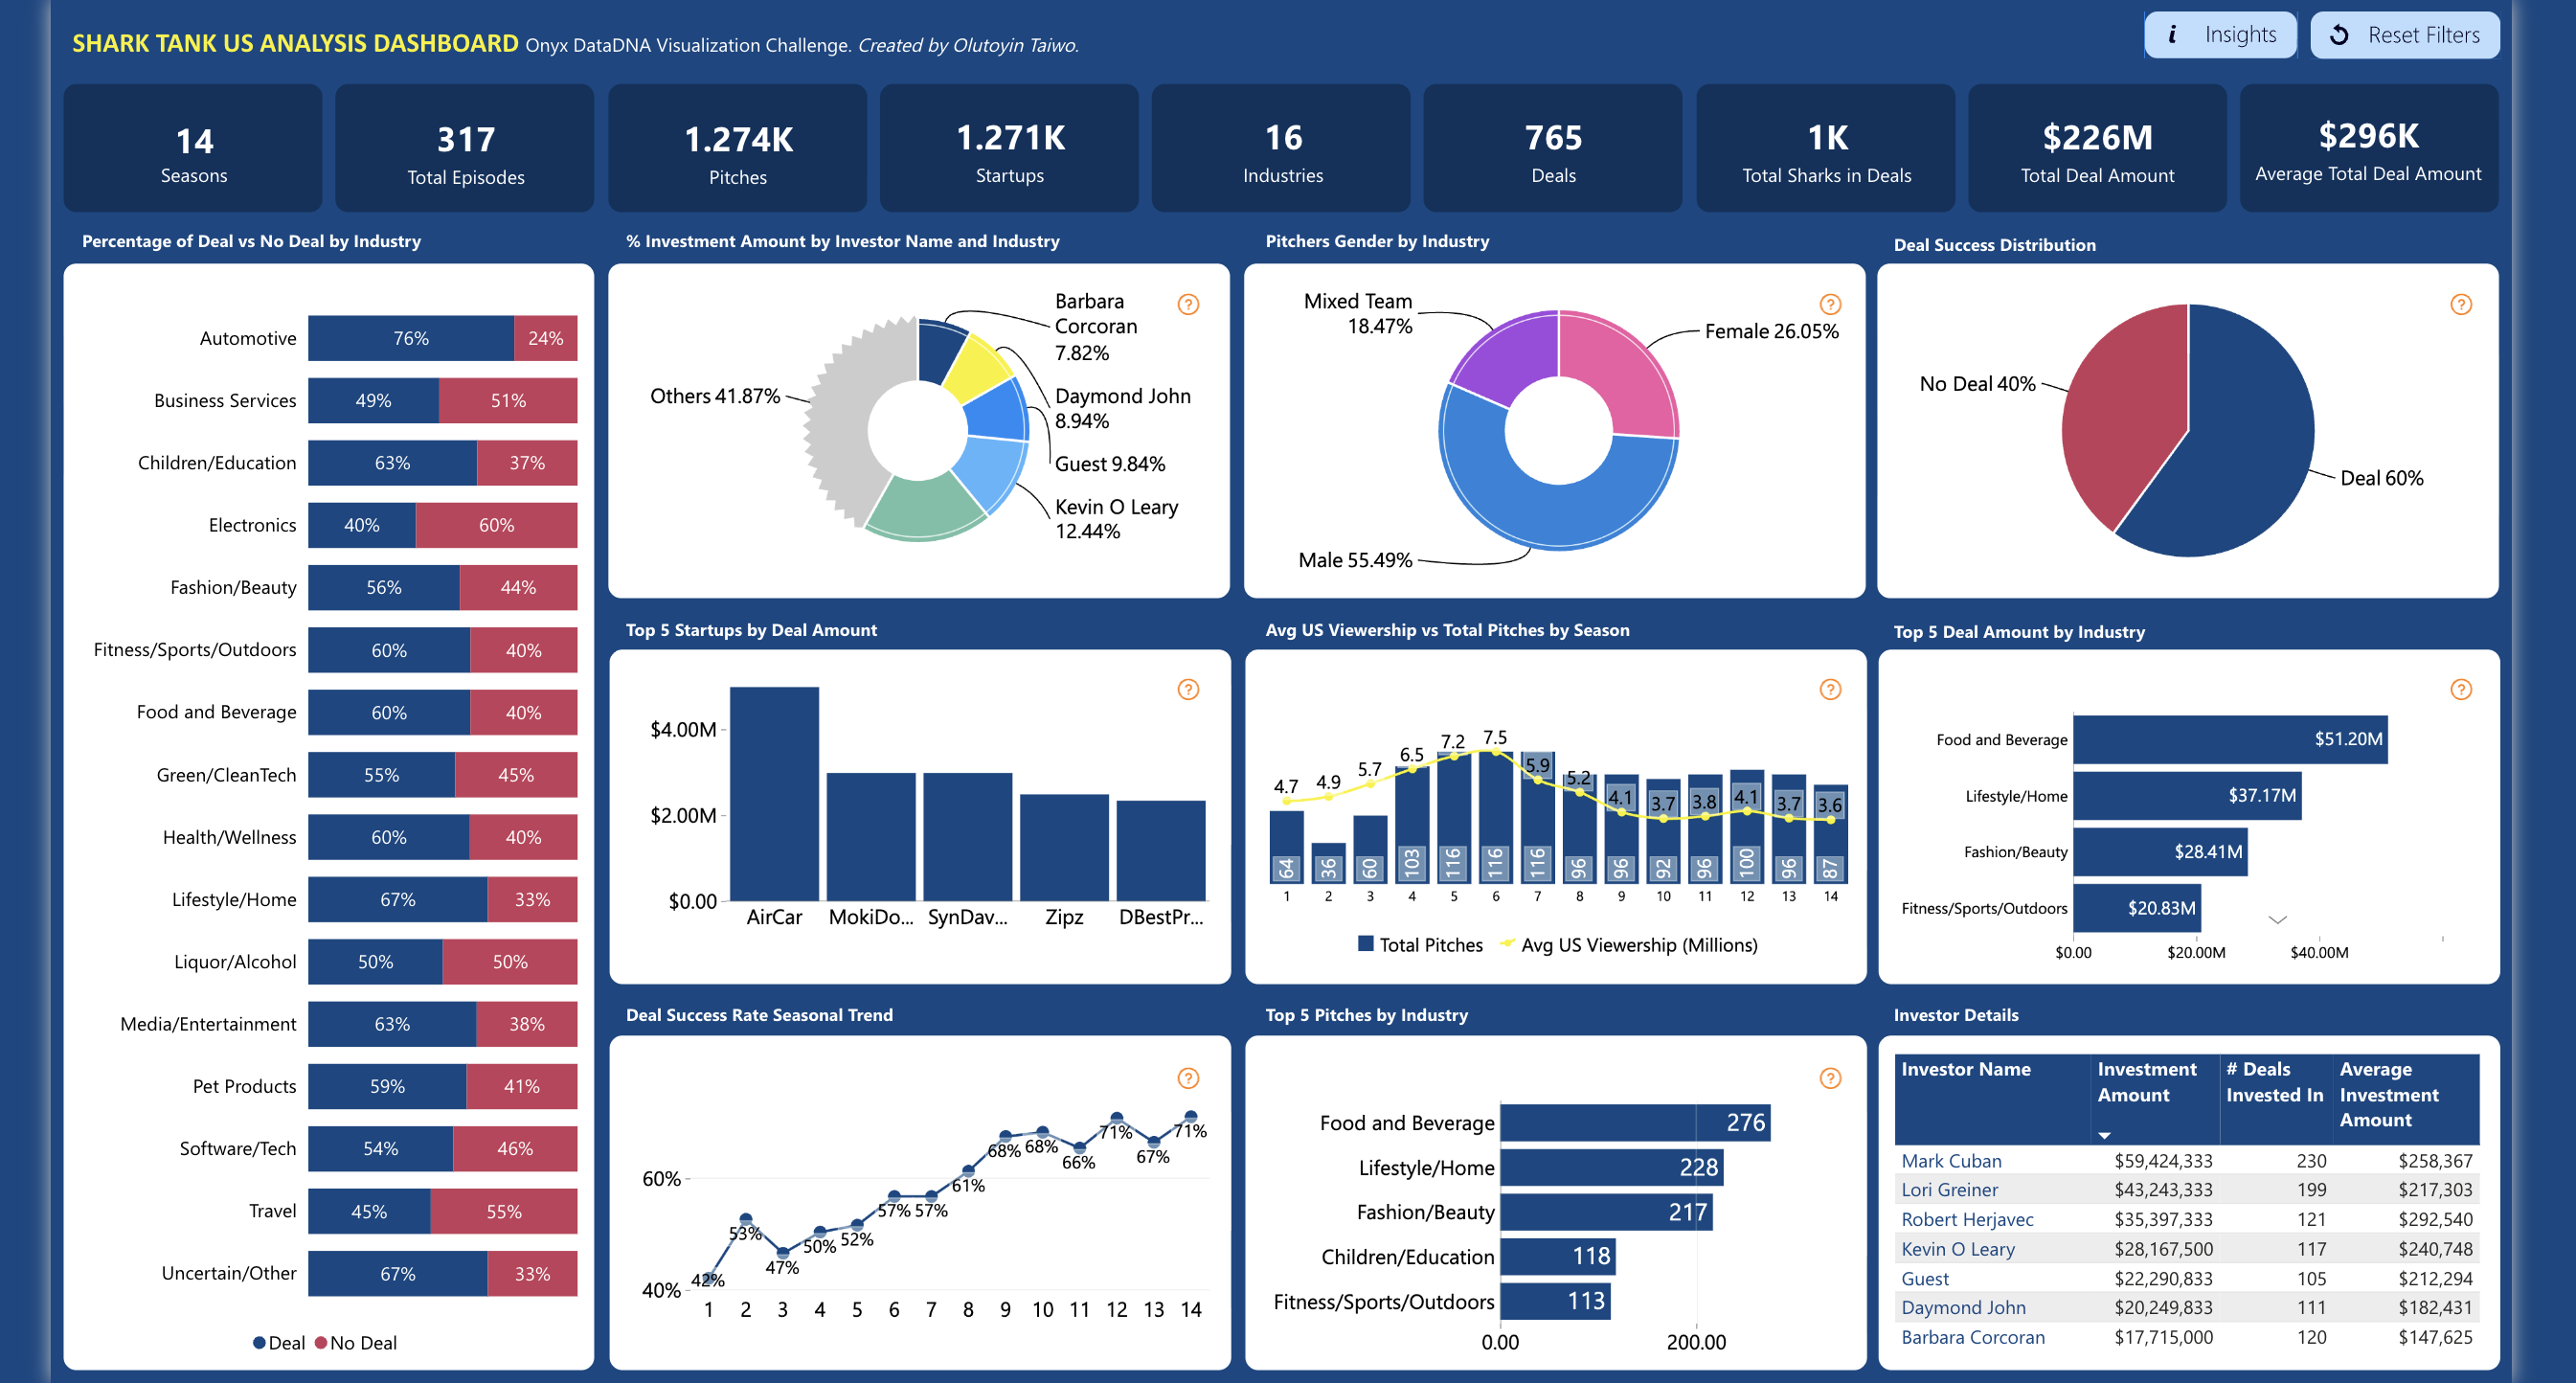
This dashboard delivers a complete analytical view of 14 seasons of Shark Tank US — from pitch volume and deal success rates to investor-level commitment, industry concentration, and seasonal viewership trends. It serves Business Analysts, Startup Ecosystem Researchers, and Media Analytics teams who want to understand the structural patterns behind which industries get funded, which sharks write the biggest checks, and how deal success has evolved across the show's run. The combination of gender analysis, investor comparison table, and season-by-season viewership data makes this one of the most multi-dimensional public dataset dashboards available for Power BI practitioners.
What's Inside This Template
KPI Banner — Full Show Scorecard
| MetricValue | |
| Seasons | 14 |
| Total Episodes | 317 |
| Total Pitches | 1,274 |
| Total Startups | 1,271 |
| Industries | 16 |
| Total Deals | 765 |
| Total Sharks in Deals | 1K |
| Total Deal Amount | $226M |
| Average Total Deal Amount | $296K |
765 deals from 1,274 pitches yields a 60% deal success rate — confirmed by the donut chart. The near-identical Pitches (1,274) vs Startups (1,271) count suggests 3 startups pitched more than once. Average deal of $296K across $226M total means the median deal is relatively modest — Shark Tank funds early-stage consumer businesses, not Series B startups.
Stacked Bar — Deal vs No Deal by Industry
| IndustryDeal %No Deal % | ||
| Automotive | 76% | 24% |
| Lifestyle/Home | 67% | 33% |
| Children/Education | 63% | 37% |
| Media/Entertainment | 63% | 38% |
| Fitness/Sports/Outdoors | 60% | 40% |
| Food and Beverage | 60% | 40% |
| Health/Wellness | 60% | 40% |
| Fashion/Beauty | 56% | 44% |
| Green/CleanTech | 55% | 45% |
| Software/Tech | 54% | 46% |
| Pet Products | 59% | 41% |
| Business Services | 49% | 51% |
| Liquor/Alcohol | 50% | 50% |
| Electronics | 40% | 60% |
| Travel | 45% | 55% |
| Uncertain/Other | 67% | 33% |
Automotive leads deal success at 76% — the highest conversion rate of any industry. Electronics is the worst performer at 40% deal rate, with Travel (45%) and Business Services (49%) also below the 60% overall average. Software/Tech at 54% underperforms the average despite being the dominant startup category globally — suggesting Shark Tank's investor base skews toward tangible consumer products over SaaS.
Donut Chart — Investment Share by Investor
| InvestorInvestment Share | |
| Kevin O'Leary | 12.44% |
| Guest Sharks | 9.84% |
| Daymond John | 8.94% |
| Barbara Corcoran | 7.82% |
| Others | 41.87% |
The "Others" slice at 41.87% is the largest single segment — meaning Mark Cuban, Lori Greiner, and Robert Herjavec collectively dominate investment volume despite not being individually labeled in the donut. Cross-referencing with the Investor Details table confirms Mark Cuban leads all named sharks at $59.4M total investment.
Bar Chart — Top 5 Startups by Deal Amount
AirCar leads by a significant margin at approximately $4M+ — nearly double the second-ranked startup (MokiDo at ~$2.5M). SynDav, Zipz, and DBestPr round out the top 5 in the $1.5M–$2M range. These five deals alone likely represent 4–5% of the entire $226M deal pool, confirming extreme deal size concentration at the top.
Line + Bar Chart — Avg US Viewership vs Total Pitches by Season
| SeasonTotal PitchesAvg Viewership (M) | ||
| 1 | ~16 | 4.7 |
| 2 | ~18 | 4.9 |
| 3 | ~60 | 5.7 |
| 4 | ~103 | 6.5 |
| 5 | ~116 | 7.2 |
| 6 | ~116 | 7.5 |
| 7 | ~111 | 5.9 |
| 8 | ~96 | 5.2 |
| 9 | ~56 | 4.1 |
| 10 | ~56 | 3.7 |
| 11 | ~46 | 3.8 |
| 12 | ~41 | 4.1 |
| 13 | ~37 | 3.7 |
| 14 | ~36 | 3.6 |
Viewership peaked at Season 6 (7.5M avg) then declined steadily to 3.6M by Season 14 — a 52% audience drop from peak. Pitch volume followed a similar arc, peaking in Seasons 5–6 then contracting. The show has lost more than half its peak audience while maintaining production — a standard reality TV viewership decay curve.
Donut Chart — Pitchers Gender by Industry
| GenderShare | |
| Male | 55.49% |
| Female | 26.05% |
| Mixed Team | 18.47% |
Male-led pitches dominate at 55.49%. Female-led pitches at 26.05% are notably below population parity but above the typical venture capital female founder rate (~15–20% globally). Mixed teams at 18.47% suggest co-founder dynamics are common in the Shark Tank applicant pool.
Donut Chart — Deal Success Distribution
60% Deal / 40% No Deal — the overall conversion rate confirmed visually.
Line Chart — Deal Success Rate Seasonal Trend
| SeasonDeal Success Rate | |
| 1 | 48% |
| 2 | 43% |
| 3 | 47% |
| 4 | 50% |
| 5 | 52% |
| 6 | 57% |
| 7 | 57% |
| 8 | 61% |
| 9 | 68% |
| 10 | 68% |
| 11 | 66% |
| 12 | 71% |
| 13 | 67% |
| 14 | 71% |
Deal success rate has trended consistently upward from 48% (Season 1) to 71% (Season 14) — a 23-point improvement. This is the opposite of viewership trend: as the audience shrank, the sharks became more willing to invest. Likely explanation: later seasons attract higher-quality pre-screened founders, and sharks have become more experienced at rapid due diligence.
Bar Chart — Top 5 Pitches by Industry
| IndustryTotal Pitches | |
| Food and Beverage | 276 |
| Lifestyle/Home | 228 |
| Fashion/Beauty | 217 |
| Children/Education | 118 |
| Fitness/Sports/Outdoors | 113 |
Food and Beverage dominates pitch volume at 276 — 21% of all pitches. The top 3 industries (Food, Lifestyle, Fashion) account for 721 pitches, or 56.6% of the entire dataset. Shark Tank is structurally a consumer goods show, not a tech or B2B show.
Bar Chart — Top 5 Deal Amount by Industry
| IndustryTotal Deal Amount | |
| Food and Beverage | $51.20M |
| Lifestyle/Home | $37.17M |
| Fashion/Beauty | $28.41M |
| Fitness/Sports/Outdoors | $20.83M |
Food and Beverage leads deal value at $51.2M — consistent with its pitch volume dominance. The top 4 industries alone account for $137.6M or 61% of total deal value.
Investor Details Table
| InvestorInvestment AmountDealsAvg Investment | |||
| Mark Cuban | $59,424,333 | 230 | $258,367 |
| Lori Greiner | $43,243,333 | 199 | $217,303 |
| Robert Herjavec | $35,397,333 | 121 | $292,540 |
| Kevin O'Leary | $28,167,500 | 117 | $240,748 |
| Guest Sharks | $22,290,833 | 105 | $212,294 |
| Daymond John | $20,249,833 | 111 | $182,431 |
| Barbara Corcoran | $17,715,000 | 120 | $147,625 |
Mark Cuban leads total investment at $59.4M across 230 deals — nearly 38% more than Lori Greiner ($43.2M). Robert Herjavec has the highest average deal size ($292,540) despite only 121 deals, suggesting he invests less frequently but writes larger checks. Barbara Corcoran has the lowest average deal ($147,625) — consistent with her focus on early-stage, product-based businesses.
Key Insights
- Deal success rate has improved 23 percentage points (48% → 71%) as viewership dropped 52% — an inverse relationship that redefines what "success" means for the show. Fewer viewers watch, but the entrepreneurs who appear are better prepared and better screened, and the sharks are more experienced at committing quickly. The show has traded mass-market entertainment for operational efficiency.
- Electronics has a 40% deal rate — the lowest of any named industry — despite tech being the dominant startup category globally. Sharks systematically underfund hardware and electronics relative to pitch volume. The likely reason: hardware has high capital requirements, long development timelines, and manufacturing risk that conflicts with the Shark Tank investment thesis of fast consumer traction and quick liquidity events.
- Mark Cuban's $59.4M across 230 deals makes him both the most active and highest-volume investor — but Robert Herjavec's $292,540 average deal size is 13% higher. Cuban deploys capital at scale across many small bets; Herjavec concentrates in fewer, larger commitments. Two opposite portfolio construction philosophies visible in the same dataset.
- Food and Beverage accounts for 21% of pitches, 60% deal rate, and $51.2M in deal value — the undisputed anchor category of the entire show. Its dominance across volume, conversion, and dollar value simultaneously confirms that consumer food brands are the most fundable startup archetype in the Shark Tank ecosystem — tangible product, immediate market validation, and fast revenue visibility.
- The 55.49% male / 26.05% female pitcher split, combined with the 60% overall deal rate, raises an unanswered equity question this dashboard hints at but does not answer directly. If female-led pitches close deals at a materially different rate than male-led pitches, that gap would be one of the most analytically significant findings in the dataset — and the drill-down by gender × deal outcome is exactly the next view this template should surface.
- AirCar's ~$4M deal is roughly 1.8% of the entire $226M deal pool from a single pitch. The top 5 deals likely represent 8–10% of total deal value — a winner-takes-most concentration pattern common in venture investing but stark when visualized against 1,274 pitches. The median deal at $296K average masks enormous dispersion.
Who This Template Is For
- Business School Professors and Startup Ecosystem Researchers who need a structured, visually rich dataset dashboard to teach investment decision-making, pitch success factors, and industry funding patterns using one of the most publicly recognizable deal datasets available.
- Media and Entertainment Analysts at production companies or streaming platforms who want to correlate viewership trends with content format changes (pitch volume per season, deal rate evolution) to understand how reality TV business formats age and retain audiences.
- Aspiring Entrepreneurs and Pitch coaches who want to use real deal data to identify which industries convert best, which sharks write the largest checks for their sector, and what the realistic deal size expectation is before entering any investor pitch process.
How to Use
Download the PBIX file from the Flexa Intel gallery. Open in Power BI Desktop (2023 or later). Connect your data source — typically a Kaggle Shark Tank US dataset or a custom-built pitch tracking spreadsheet with fields for season, episode, startup name, industry, pitcher gender, deal flag, deal amount, investor name, and viewership data. All visuals update automatically — the KPI banner, industry deal bars, investor donut, top startup chart, seasonal trend lines, gender donut, and investor details table all recalculate from your connected data.
This dashboard visualizes deal patterns and investor rankings powerfully but lacks a structured industry-by-investor matrix table — no ranked view showing each shark's deal count, total investment, average check size, and top industry focus side by side with conditional formatting. Flexa Tables is a Microsoft-certified Power BI visual built for exactly this — multi-column investor performance reporting with sortable columns, conditional formatting by investment tier, and expandable industry-to-startup hierarchies, making investor comparison analysis and pitch strategy briefings significantly faster and more presentation-ready.
Other Templates
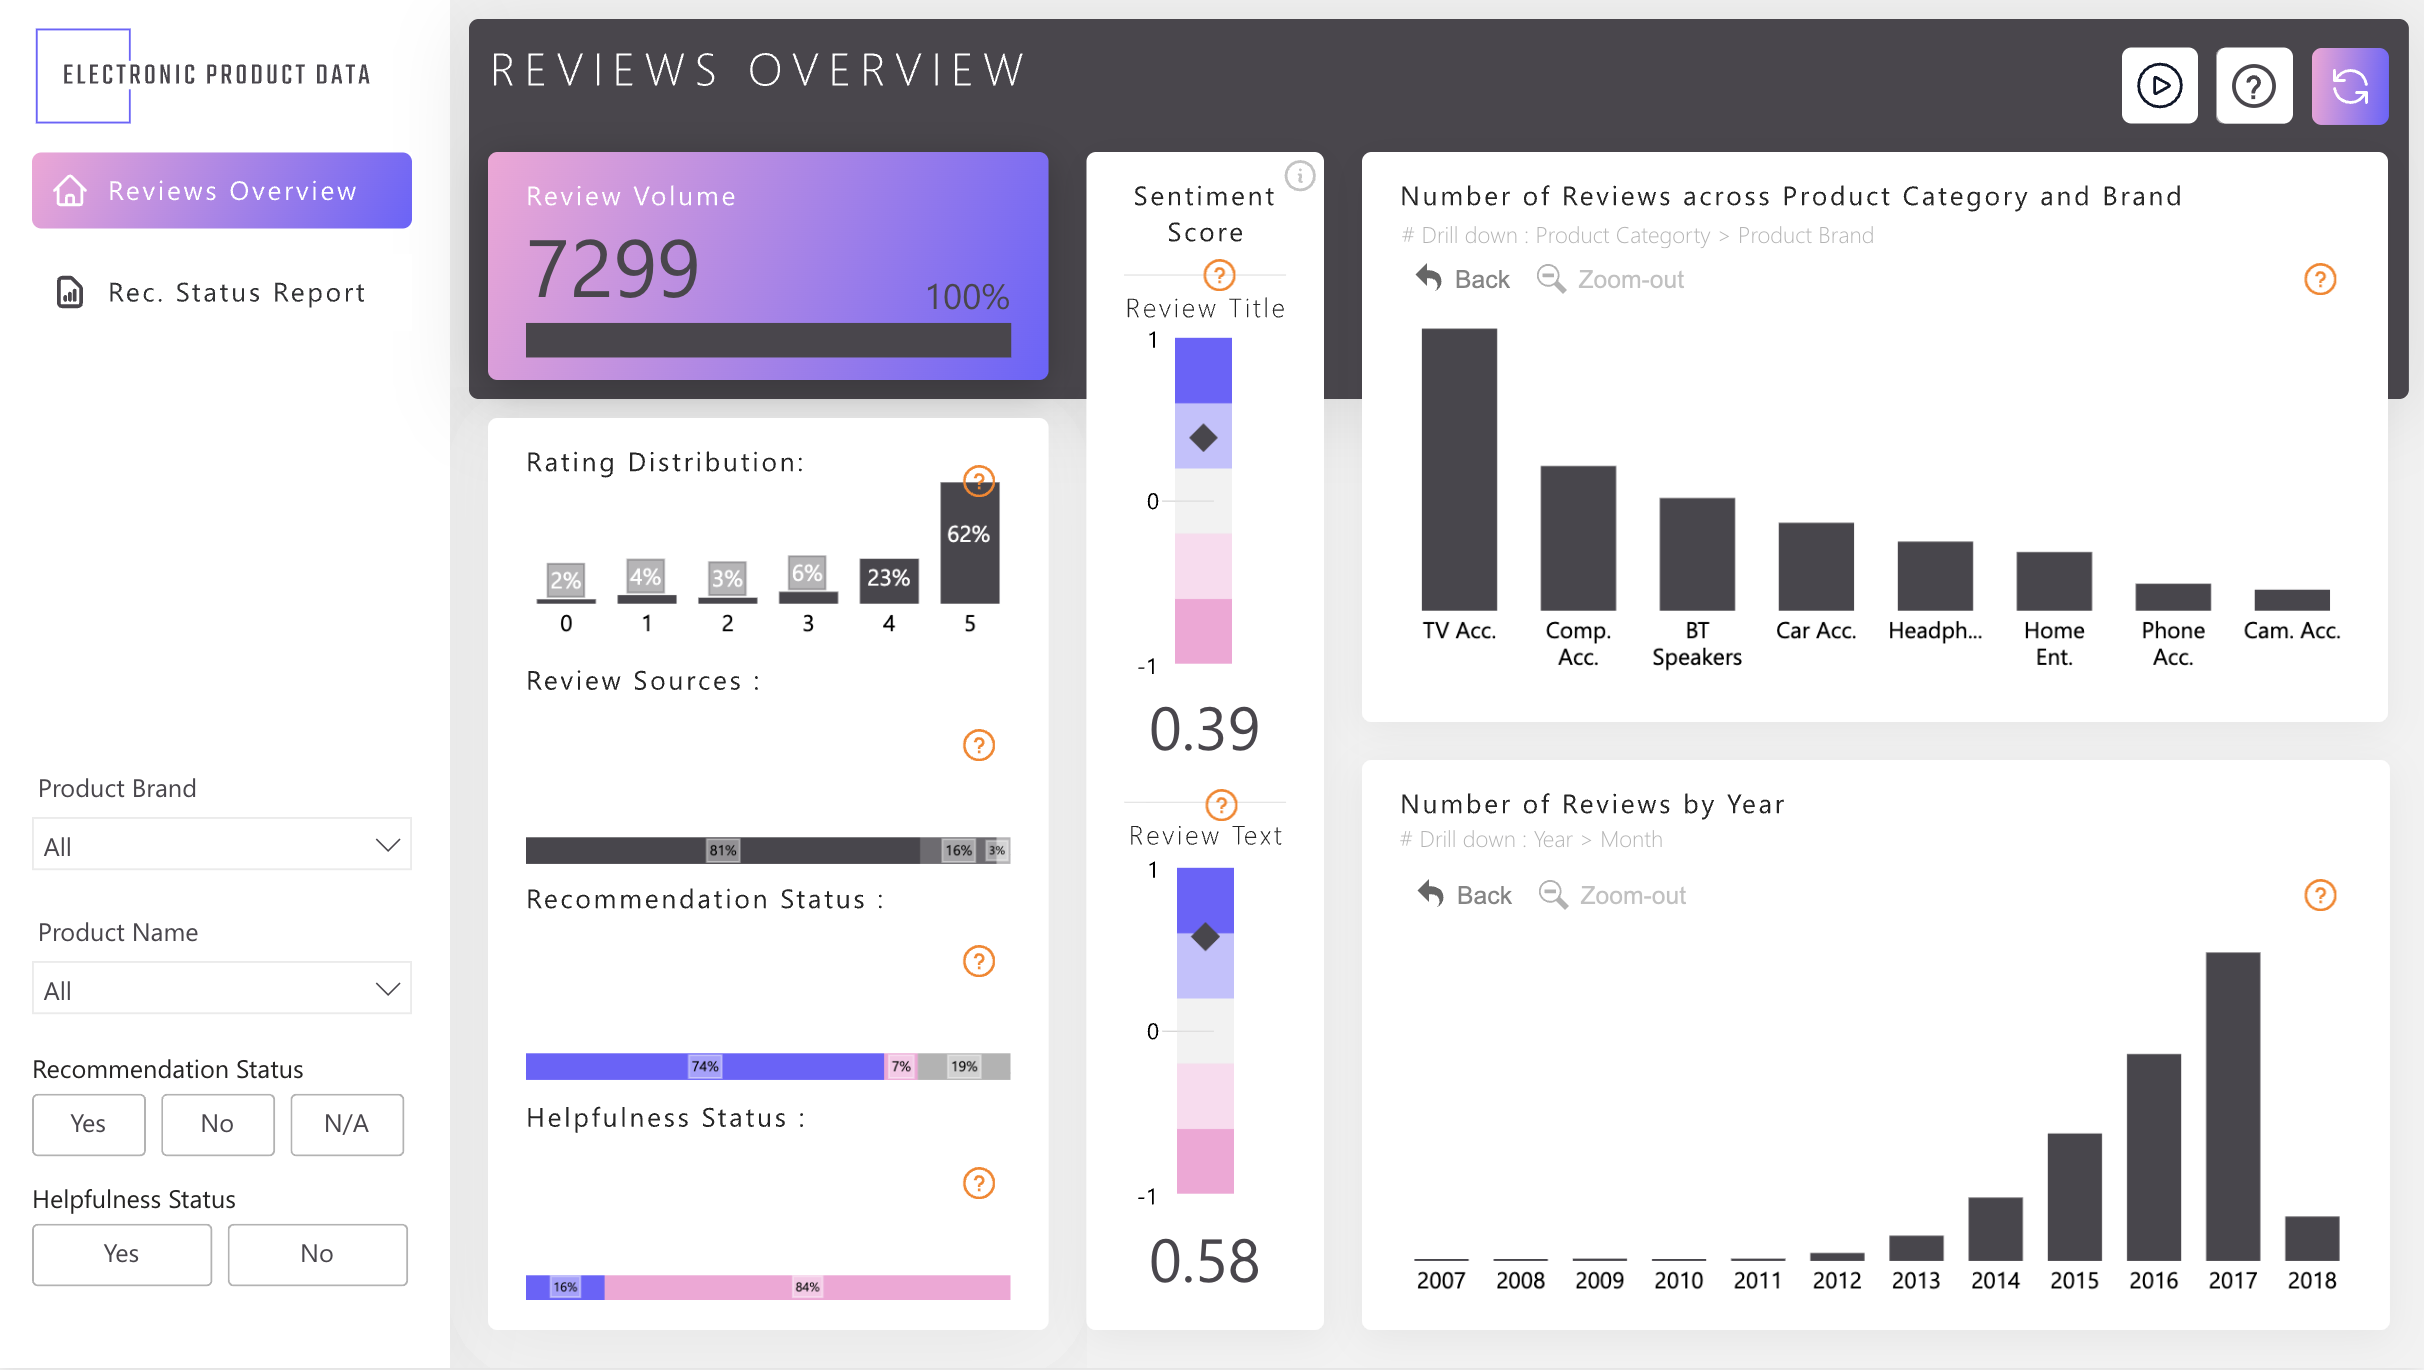 Free Retail & E-commerce
Power BI Electronic Product Reviews Dashboard Template (Free PBIX Download)
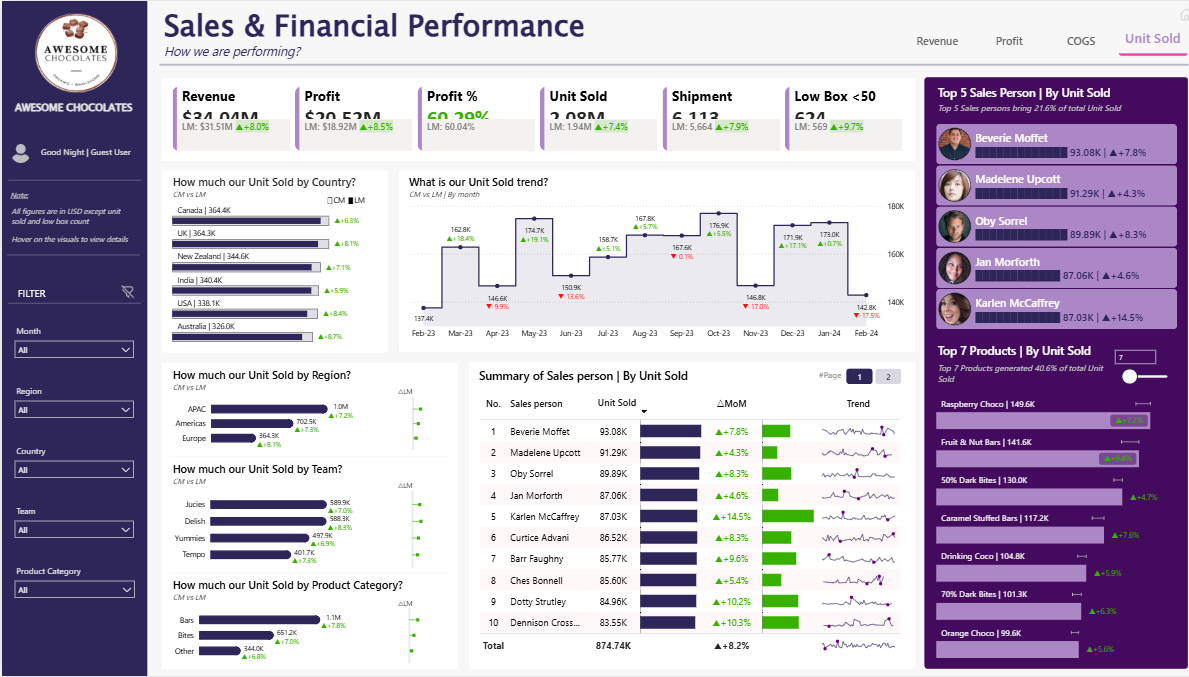 Free Sales & Revenue
Power BI Sales & Financial Performance Dashboard Template — FMCG Retail Analytics (Free PBIX Download)
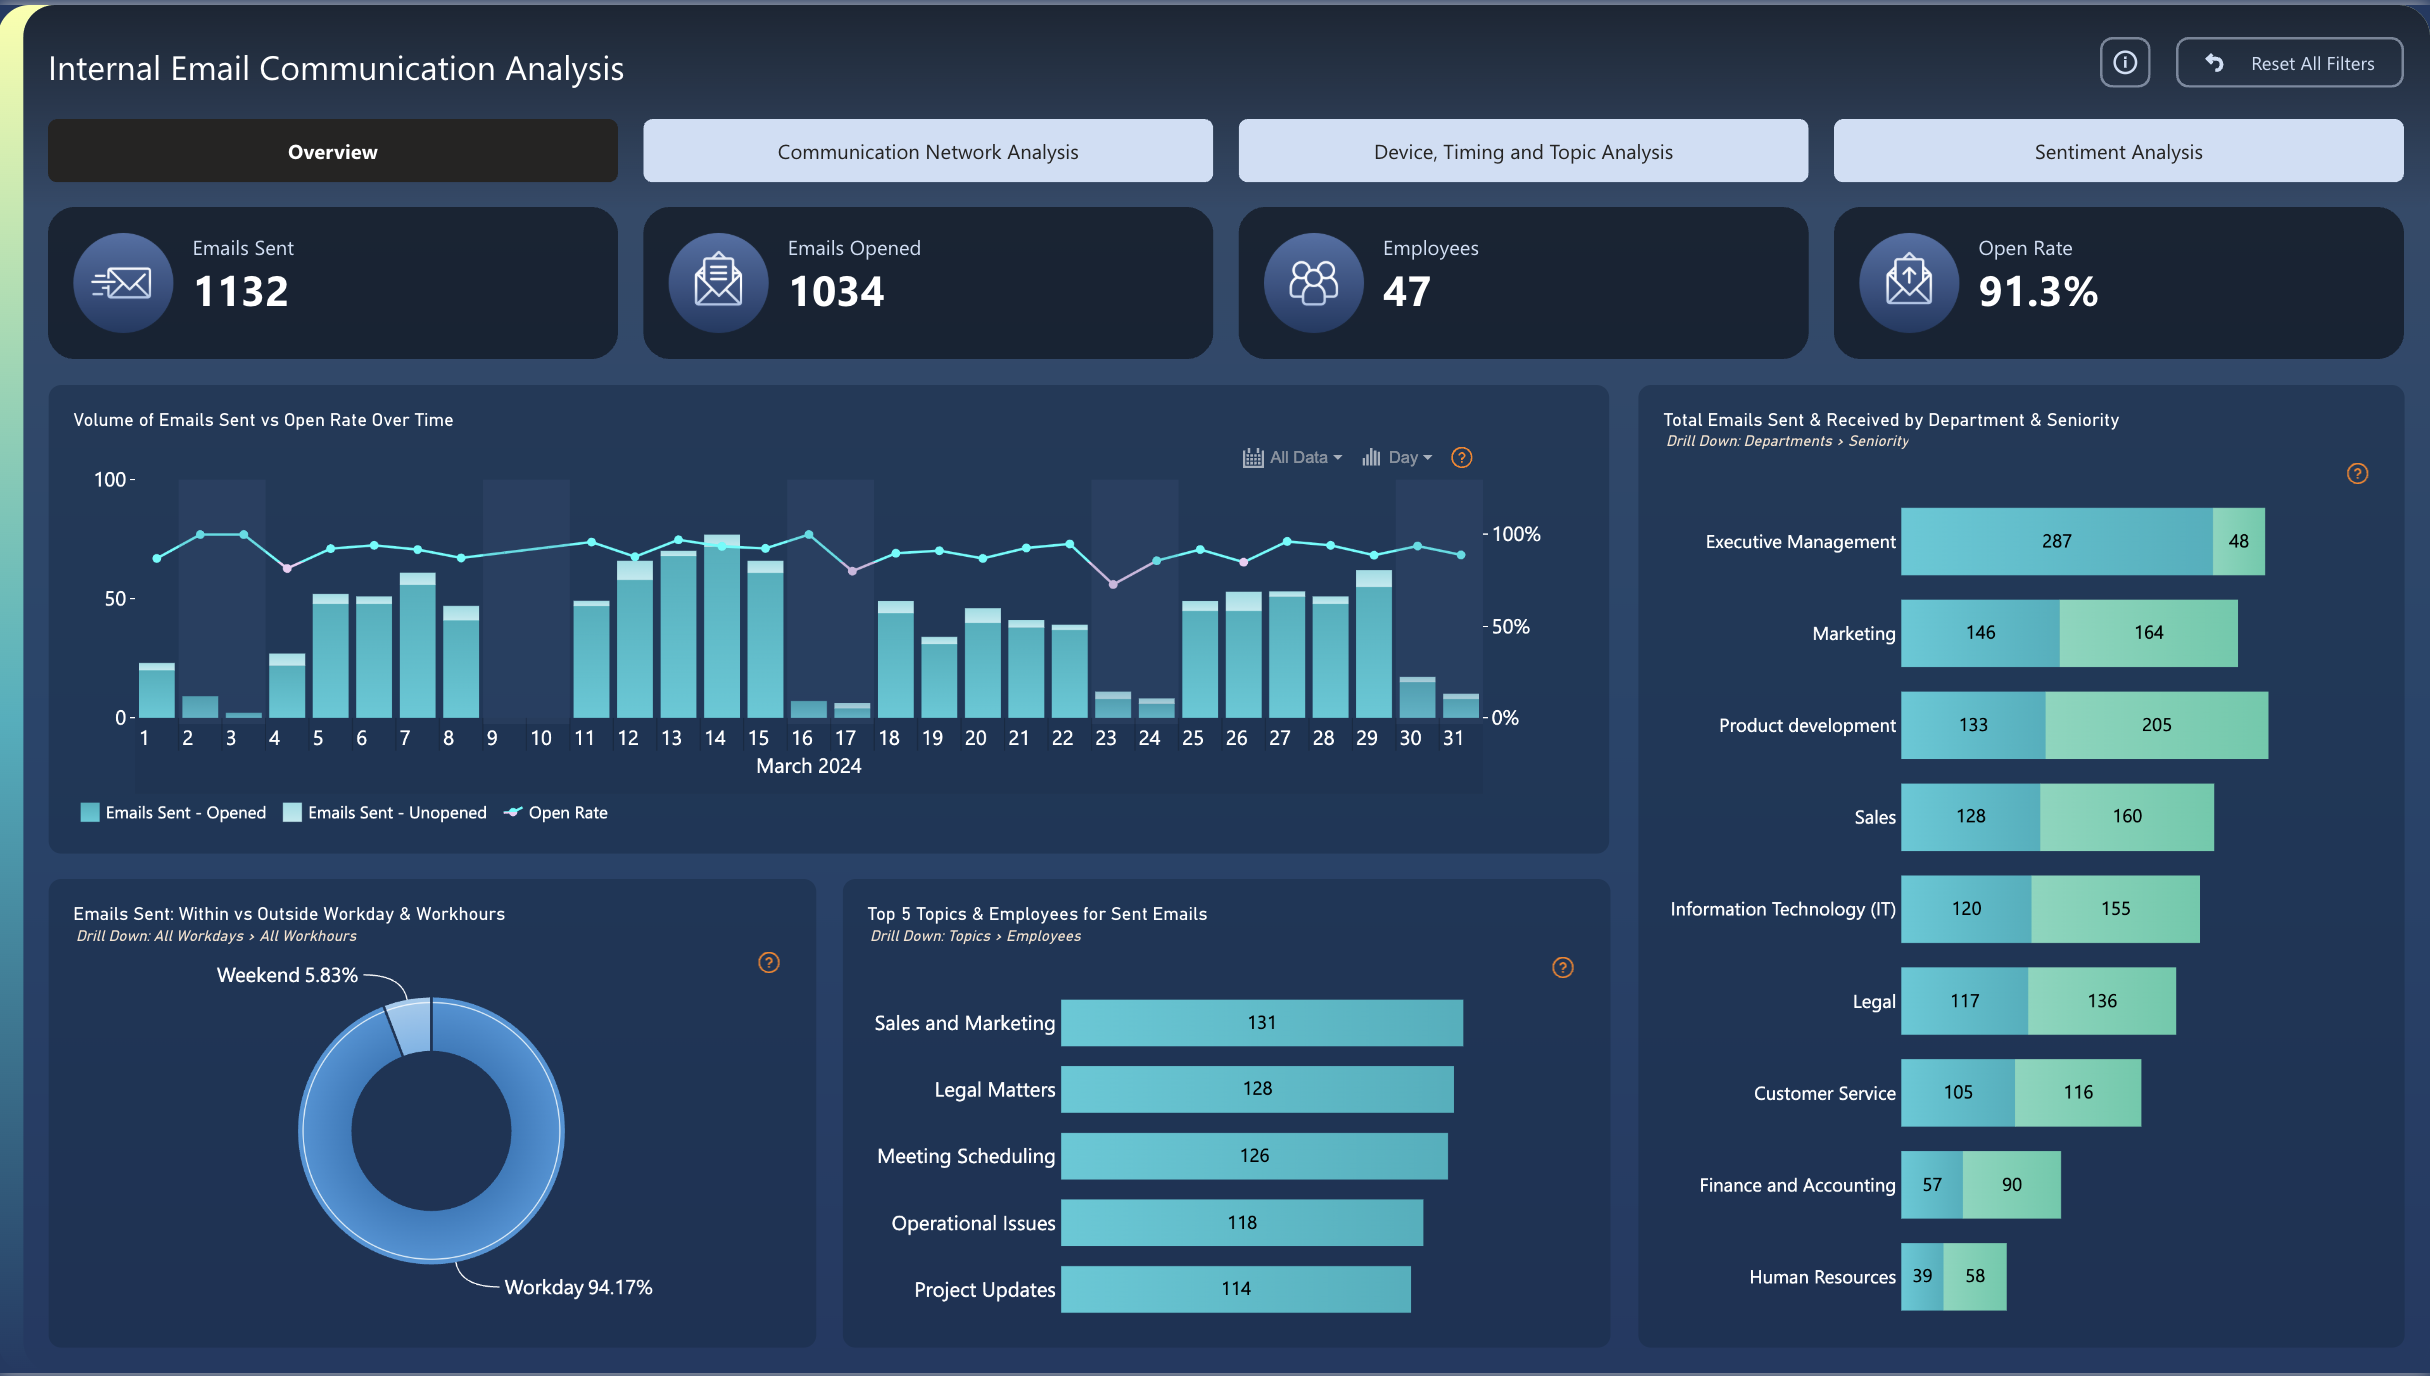 Free Marketing
Power BI Internal Email Communication Dashboard Template (Free PBIX Download)
If you find this website helpful, share it with friends and colleagues to boost their Power BI skills and work efficiency!
Like this site? Share it