Power BI Shark Tank Investment Dashboard Template (Free PBIX Download)
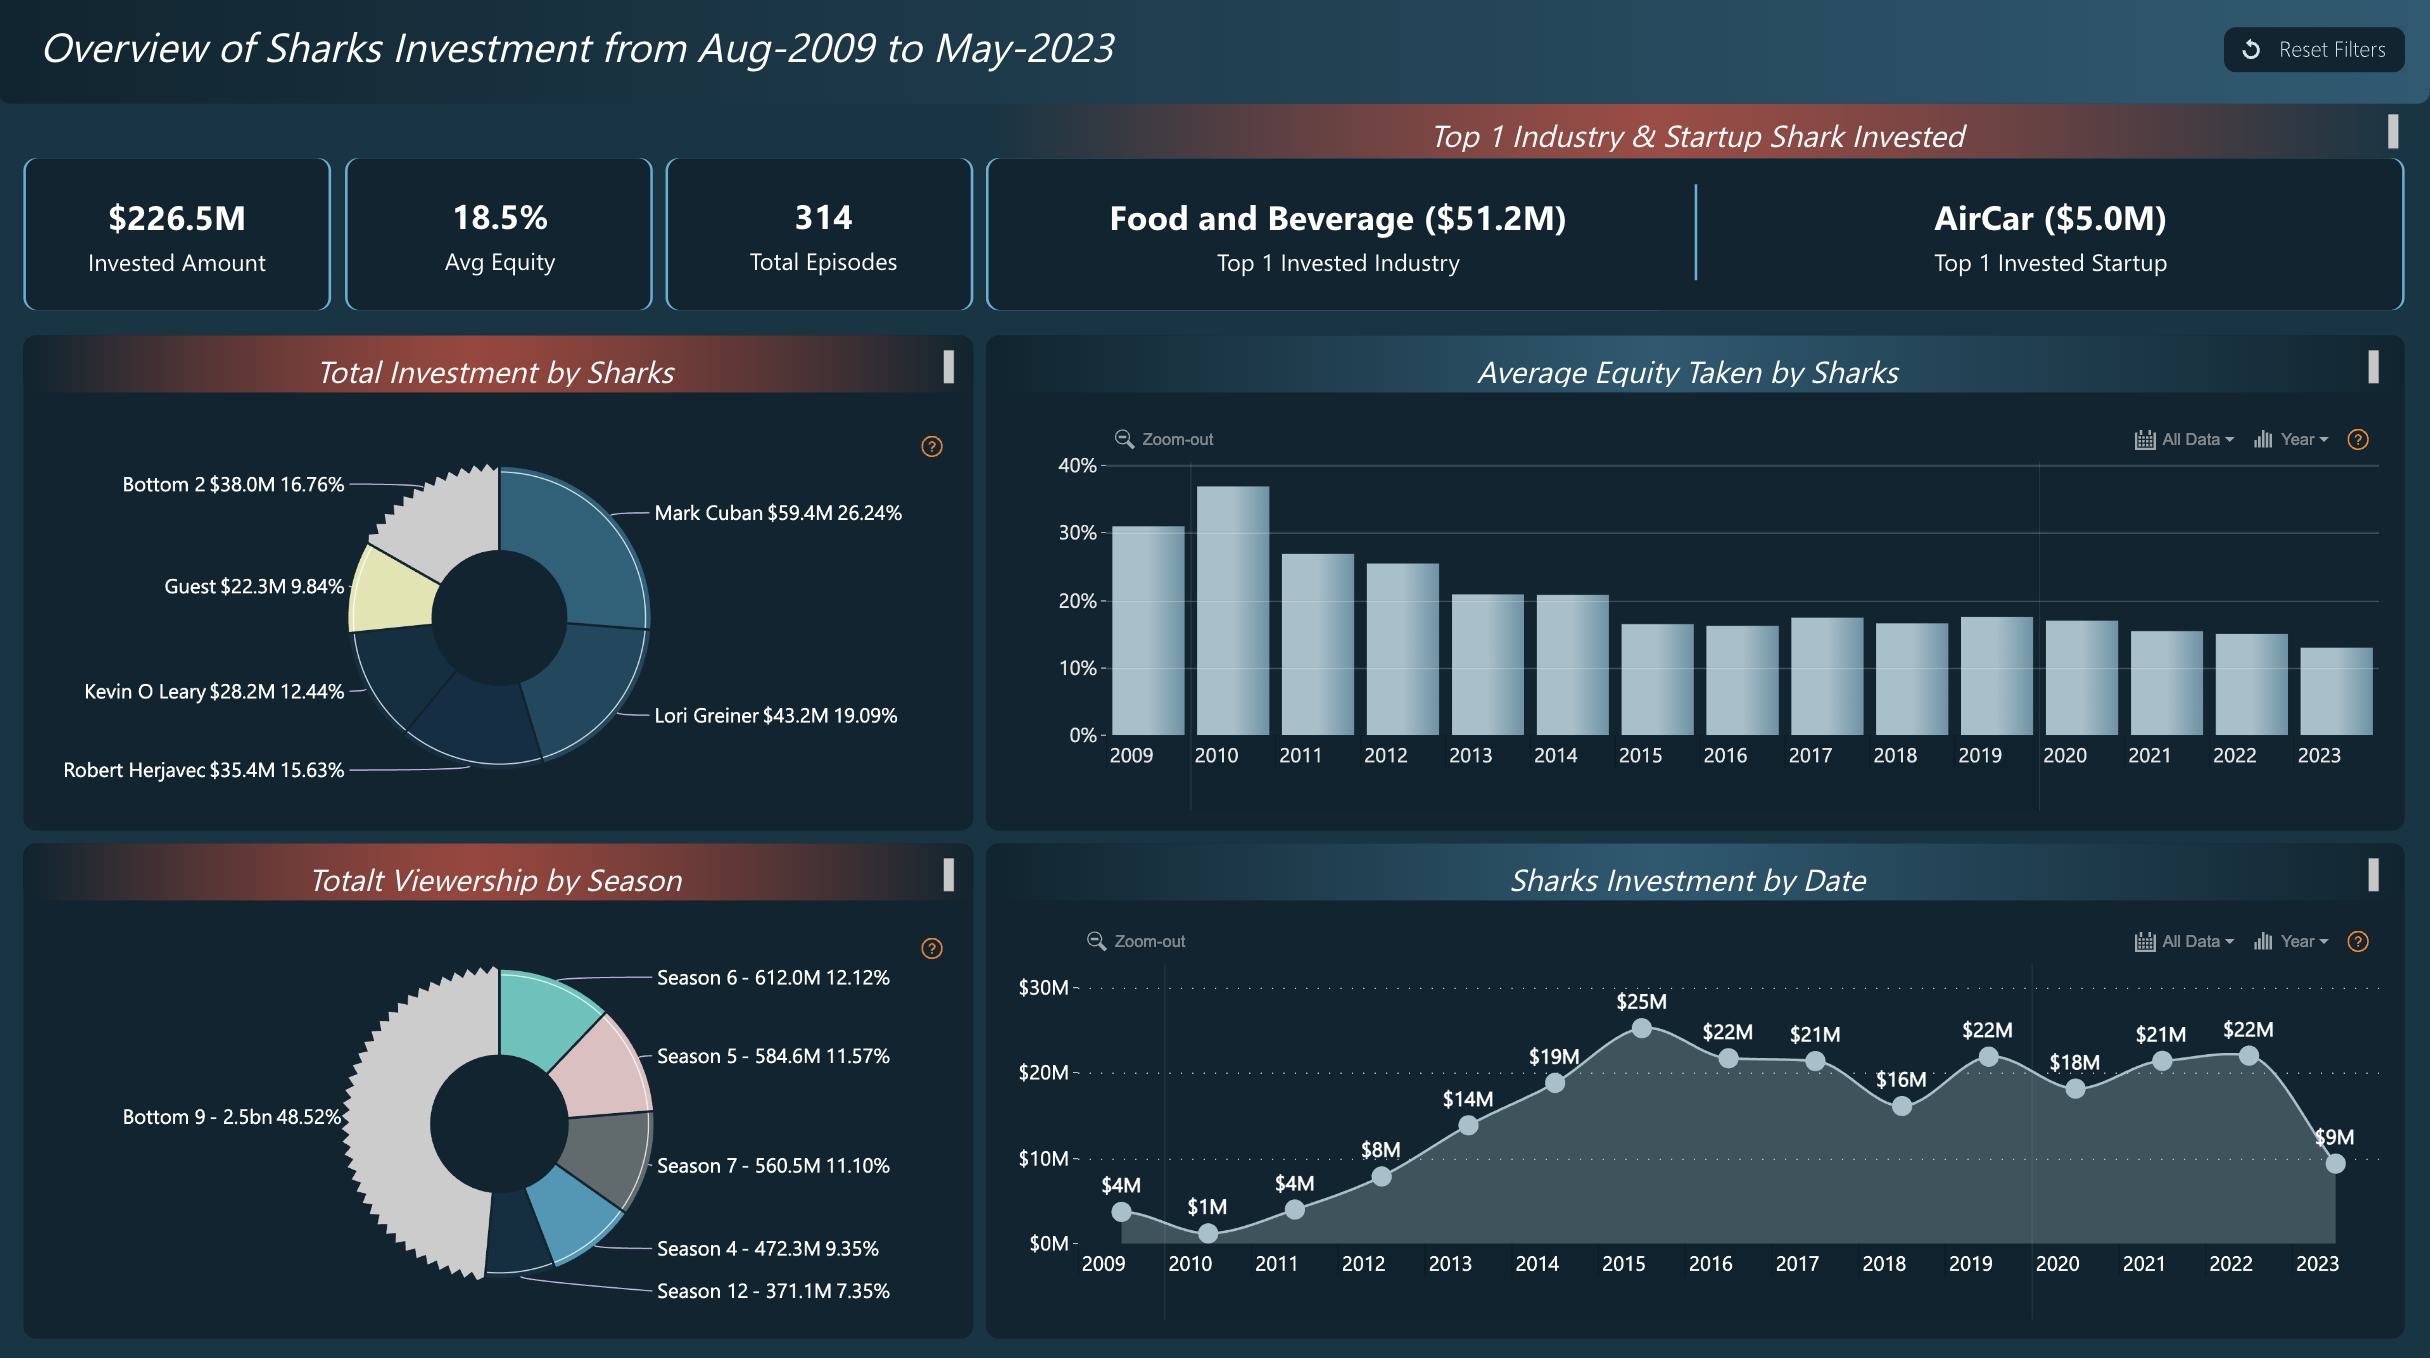
This dashboard covers 14 years of Shark Tank investment activity from August 2009 to May 2023, aggregating $226.5M across 314 episodes into a unified analytical view. It serves entertainment data analysts, startup ecosystem researchers, and BI developers who need to model deal flow, equity dynamics, and audience engagement within a single report. The combination of investor-level financial breakdown, temporal investment trends, and season-level viewership makes this a rare multi-domain dataset that bridges finance and media performance analytics.
1. What's Inside This Template
KPI Banner
| MetricValueWhat It Reveals | ||
| Total Invested Amount | $226.5M | Cumulative deal value across all seasons |
| Avg Equity Taken | 18.5% | Blended equity stake — benchmark for deal structure |
| Total Episodes | 314 | Dataset coverage completeness |
| Top Industry | Food & Beverage ($51.2M) | Dominant sector by invested capital |
| Top Startup | AirCar ($5.0M) | Highest single-deal investment |
Donut Chart — Total Investment by Sharks
| SharkAmountShare | ||
| Mark Cuban | $59.4M | 26.24% |
| Lori Greiner | $43.2M | 19.09% |
| Robert Herjavec | $35.4M | 15.63% |
| Kevin O'Leary | $28.2M | 12.44% |
| Guest Sharks | $22.3M | 9.84% |
| Bottom 2 (others) | $38.0M | 16.76% |
Bar Chart — Average Equity Taken by Sharks (by Year) Drill-down enabled (All Data → Year). Equity percentage trend clearly declining over the 14-year window:
| YearApprox. Avg Equity | |
| 2009 | ~30% |
| 2010 | ~38% (peak) |
| 2011 | ~28% |
| 2012 | ~26% |
| 2013 | ~20% |
| 2014 | ~15% |
| 2015–2023 | ~10–13% (plateau) |
Line Chart — Sharks Investment by Date (Annual)
| YearInvestment | |
| 2009 | $4M |
| 2010 | $1M |
| 2011 | $4M |
| 2012 | $8M |
| 2013 | $14M |
| 2014 | $19M |
| 2015 | $25M (peak) |
| 2016 | $22M |
| 2017 | $21M |
| 2018 | $22M |
| 2019 | $16M |
| 2020 | $22M |
| 2021 | $18M |
| 2022 | $21M |
| 2022 | $22M |
| 2023 | $9M |
Donut Chart — Total Viewership by Season
| SeasonViewershipShare | ||
| Season 6 | 612.0M | 12.12% |
| Season 5 | 584.6M | 11.57% |
| Season 7 | 560.5M | 11.10% |
| Season 4 | 472.3M | 9.35% |
| Season 12 | 371.1M | 7.35% |
| Bottom 9 seasons | 2.5bn | 48.52% |
2. Key Insights
2.1. Mark Cuban deployed 2.1x more capital than Kevin O'Leary despite both being lead sharks — revealing a fundamental difference in investment philosophy. Cuban invested $59.4M (26.24%) vs O'Leary's $28.2M (12.44%). This is not explained by deal volume alone — O'Leary is known for royalty-based deals with smaller equity checks, while Cuban favors larger equity positions in tech and consumer brands. The gap confirms that raw investment totals are a poor proxy for deal influence on the show.
2.2. Average equity demanded dropped from 38% in 2010 to ~10–12% post-2015 — founder leverage increased dramatically as the show matured. In the early seasons (2009–2011), sharks extracted equity in the 28–38% range. By 2014 onward, the average stabilized at 10–15%. This 60%+ compression in equity demanded reflects either (a) higher-quality founders negotiating harder, (b) competitive pressure among sharks reducing extractable terms, or (c) the show deliberately featuring more advanced-stage startups with stronger BATNA. Any VC benchmarking equity norms from Shark Tank data must segment pre- and post-2014 to avoid a biased baseline.
2.3. Investment peaked at $25M in 2015, then never recovered — the show's financial output has been structurally declining for 8 years. After the 2015 peak, annual investment oscillated between $16M–$22M, with 2023 collapsing to $9M — the lowest since 2010. This is not a data truncation artifact (May 2023 cutoff explains only part of it). The trend suggests either fewer deals per episode, lower average deal sizes, or both. For a show still drawing hundreds of millions of viewers, the capital deployed is shrinking — a structural misalignment worth flagging.
2.4. Food & Beverage dominates at $51.2M invested — nearly 22.6% of total capital went to a single consumer category. With $226.5M total and $51.2M in F&B alone, this sector captured more than 1 in every 5 dollars. This reflects a consistent bias on the show toward tangible consumer products with demonstrated retail traction — categories where Lori Greiner (QVC relationships) and Cuban (retail scale) have the clearest distribution advantage and thus highest conviction to invest.
2.5. The top single startup investment (AirCar at $5.0M) is only 2.2% of total capital — the portfolio is remarkably diversified with no single deal dominating. In venture portfolios, a single "winner" often represents 40–60% of fund returns. The Shark Tank portfolio structure inverts this — the top deal is only $5M of $226.5M. This either means returns are broadly distributed or (more likely) that the show's investment thesis optimizes for deal volume and brand visibility over concentrated bets on breakout companies.
2.6. Seasons 5, 6, and 7 cluster as the viewership peak — the show's audience apex corresponds exactly with the highest investment years (2013–2015). Season 6 (612M), Season 5 (584.6M), and Season 7 (560.5M) are the top 3 by viewership and map approximately to the 2013–2015 broadcast years — the same window where annual investment hit $14M, $19M, and $25M respectively. The correlation suggests audience enthusiasm and deal quality (as measured by capital deployed) moved together, and both have since declined. This has implications for content strategy: more investment activity correlates with stronger viewership, not just the inverse.
3. Who This Template Is For
- Entertainment & Media Analysts at production companies or streaming platforms who need to quantify the financial and audience engagement dynamics of a long-running reality business format, and want a reusable PBIX structure they can adapt to other deal-show datasets (Dragons' Den, Next in Fashion, etc.).
- Startup Ecosystem Researchers and Accelerator Program Managers who use Shark Tank deal data as a benchmark for equity norms, sector investment patterns, and deal size expectations — and need a ready-built analytical layer rather than raw spreadsheet exports.
- BI Developers building investor portfolio dashboards who want a production-grade dark-theme template with donut charts, multi-year line charts, and KPI cards that they can re-skin and connect to their own deal flow CRM or fund management system.
4. How to Use
- Download the PBIX file from the Flexa Intel gallery.
- Open in Power BI Desktop (any recent version; dark theme pre-applied).
- Connect your data source — typical sources include: a structured Excel/CSV export with columns for Episode, Season, Air Date, Shark Name, Deal Amount, Equity %, Industry, Startup Name, and Viewership; or a SQL database with a normalized deal and episode schema.
- All KPIs, donut charts, the equity trend bar chart, and the investment line chart update automatically. The "Reset Filters" button in the top-right corner clears all cross-filter state.
This dashboard visualizes investor and season-level aggregates well, but lacks a structured deal-level breakdown table where analysts can rank all startups by investment amount, filter by industry, and compare equity taken side-by-side across sharks. Flexa Tables is a Microsoft-certified Power BI visual that adds sortable, multi-level tabular reporting with conditional formatting by performance tier — ideal for building a deal registry table (Startup → Industry → Shark → Amount → Equity) that sits alongside the existing charts in this template.
Other Templates
 Free Sales & Revenue
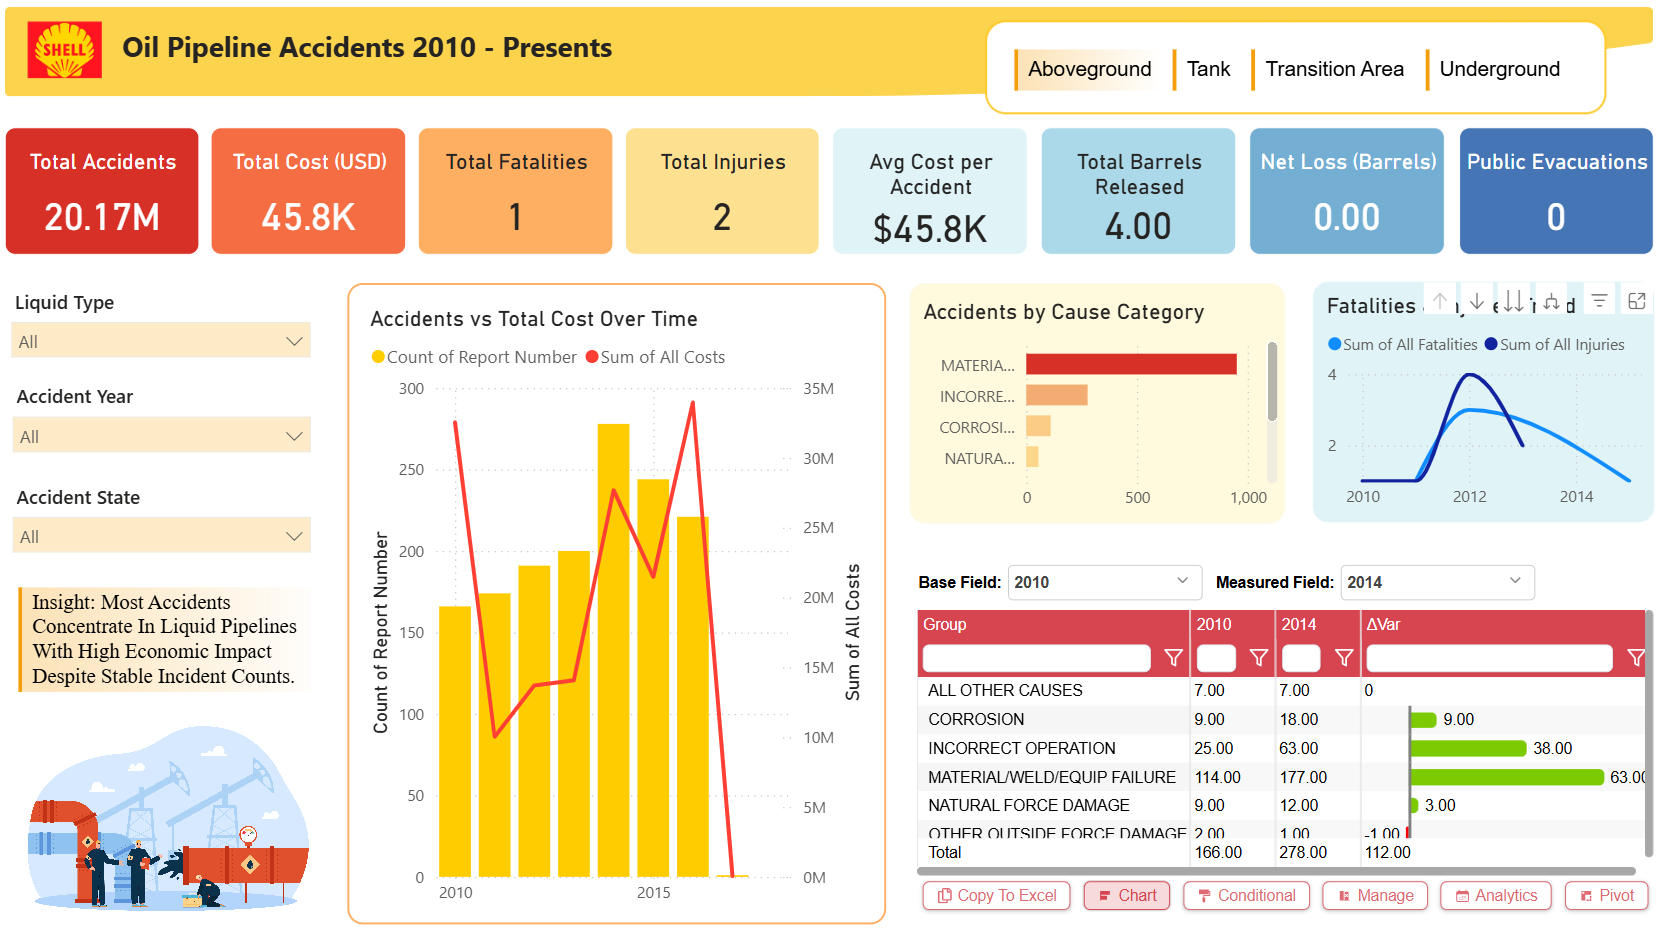
Shell Oil Pipeline Accidents Dashboard (2010–Present) – Key Insights
 Free Sales & Revenue
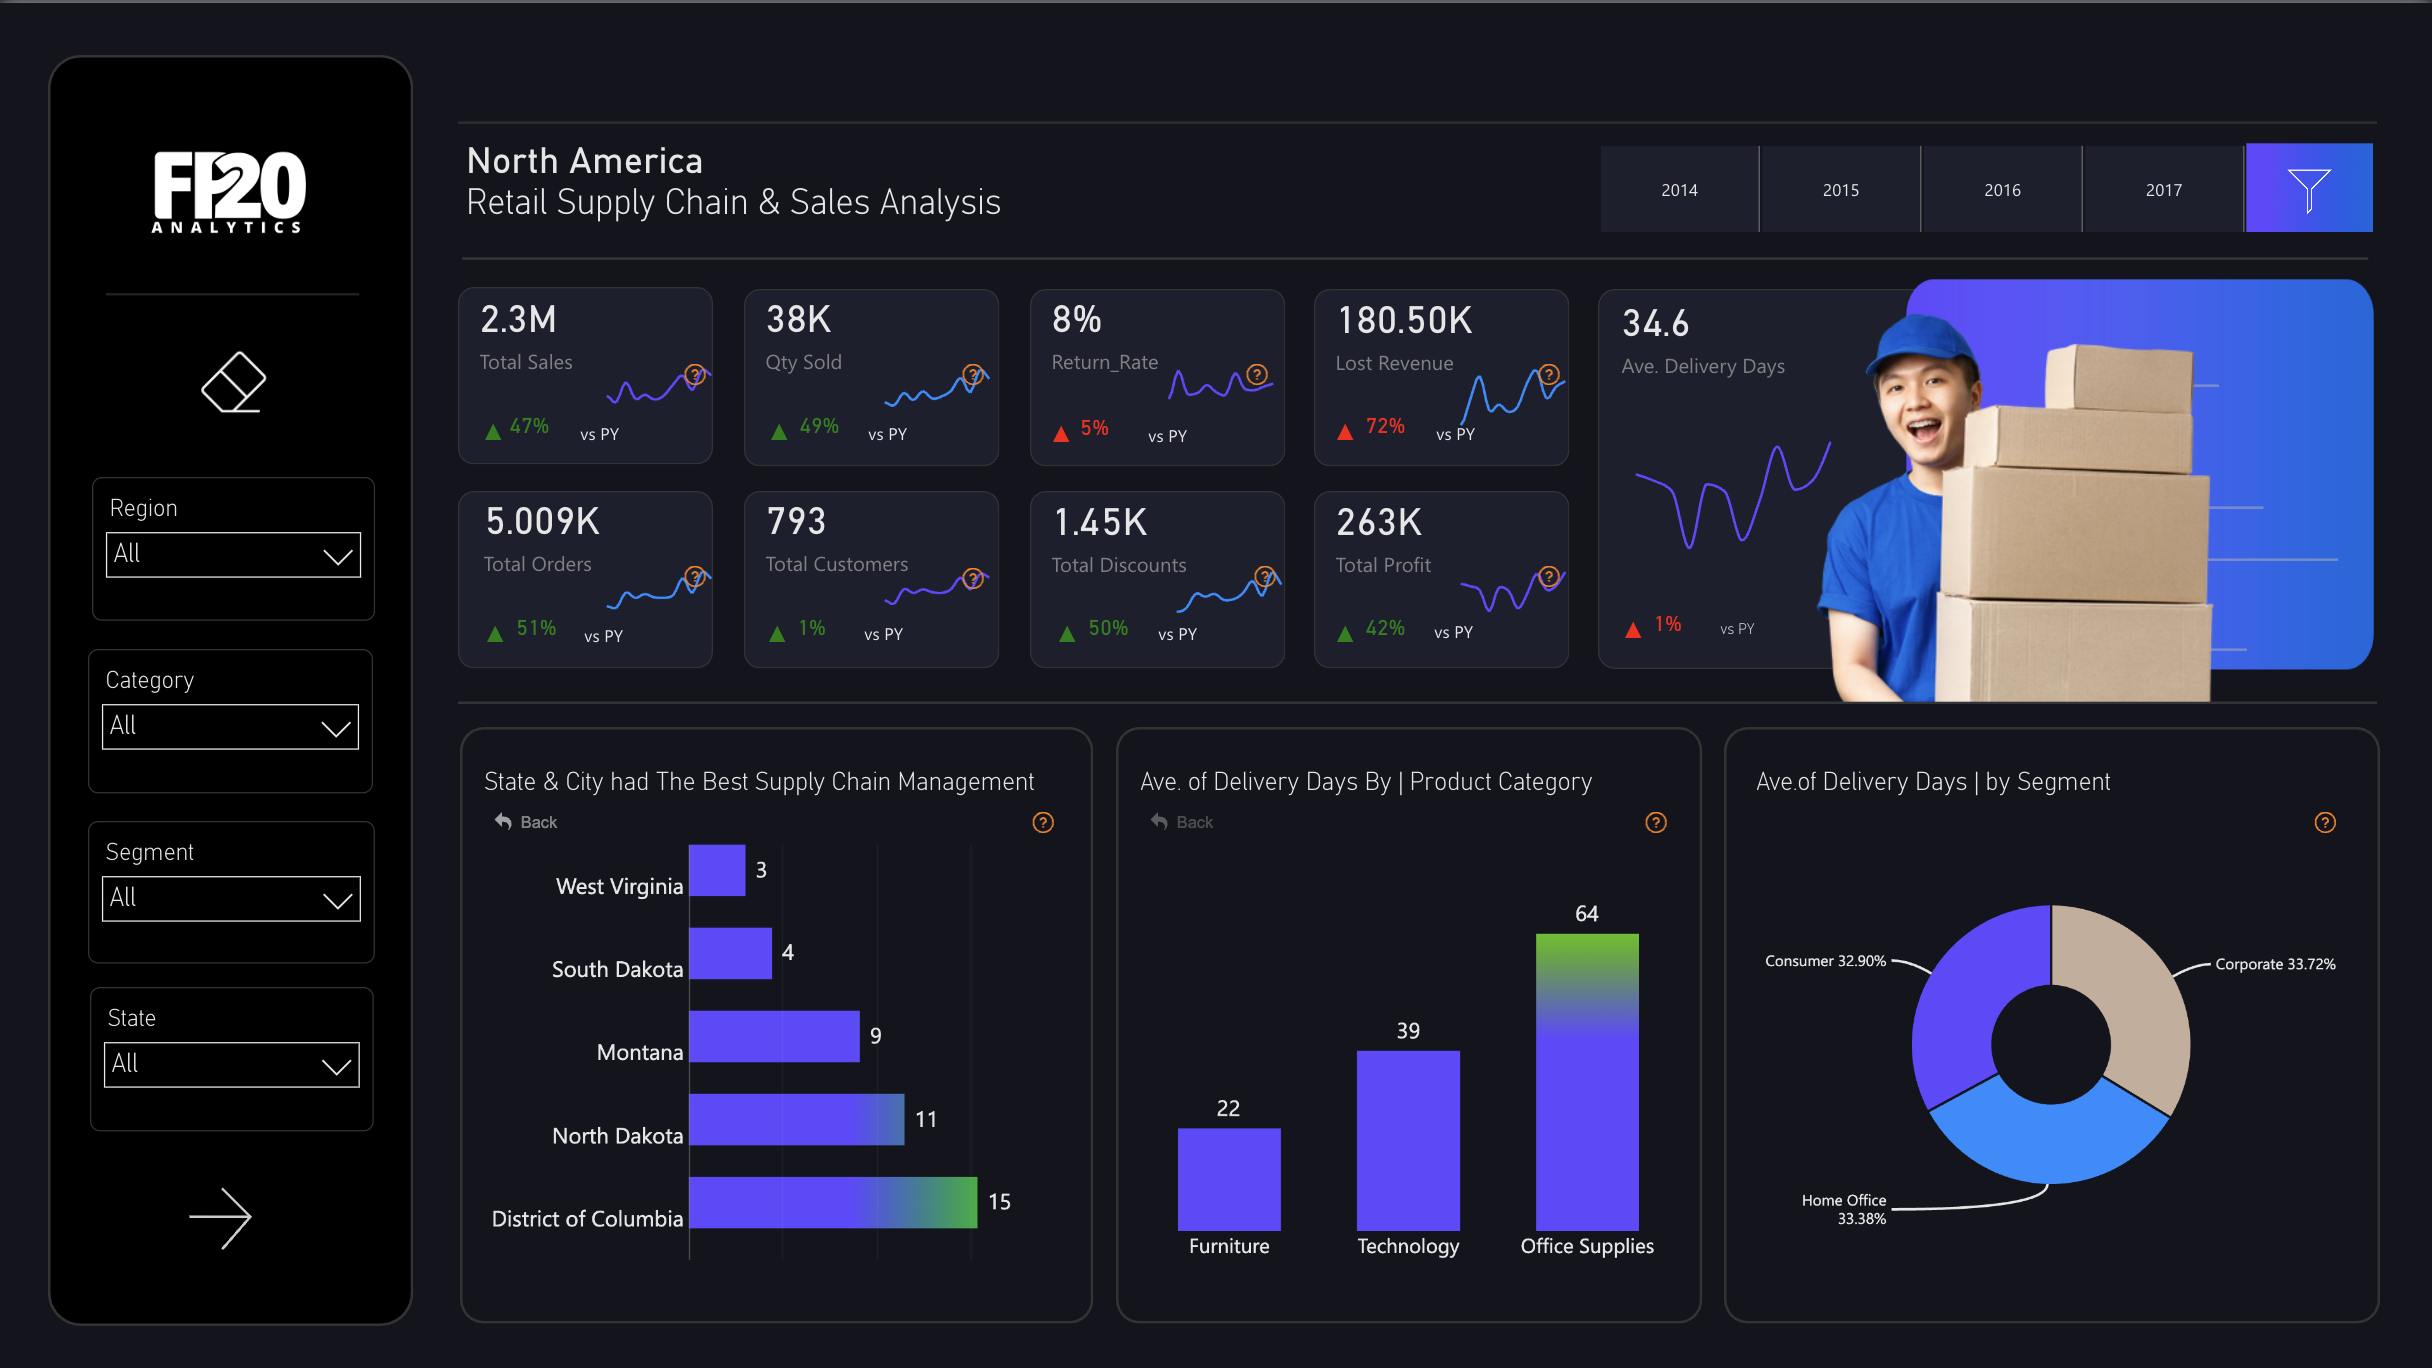
Power BI North America Retail Supply Chain & Sales Analysis Dashboard Template (Free PBIX Download)
 Free Sales & Revenue
Power BI Sales Dashboard with Variance Analysis — Contoso BI Template (Free PBIX Download)
If you find this website helpful, share it with friends and colleagues to boost their Power BI skills and work efficiency!
Like this site? Share it