Power BI Shark Tank Analytics Dashboard Template (Free PBIX Download)

Introduction
This Power BI dashboard is a complete analytical deep-dive into 14 seasons of Shark Tank USA, covering 1,274 pitchers, 765 closed deals, $226M in total investment, and 6,552 million cumulative US viewers. It is built for entertainment data analysts, business students, startup researchers, and BI developers who want a ready-made template for exploring investment behavior, industry concentration, shark deal-making patterns, and season-by-season performance trends. The drillable industry bar chart, shark investment donut, gender breakdown, and season-level investment timeline make this one of the most content-rich public dataset dashboards available as a free PBIX.
What's Inside This Template
KPI Banner — Five Headline Metrics
| MetricValue | |
| No. of Seasons | 14 |
| US Viewership | 6,552M cumulative |
| No. of Pitchers | 1,274 |
| No. of Deals | 765 |
| Total Investment | $226M |
The deal rate implied by these figures: 765 out of 1,274 pitchers secured a deal — a 60.0% close rate, which is far higher than it appears on TV due to pre-screening before filming.
Investment by Industry (Stacked Bar Chart + Donut, drillable)
| IndustryTotal InvestmentShare | ||
| Food and Beverage | $51M | 22.61% |
| Lifestyle/Home | $37M | 16.41% |
| Fashion/Beauty | $28M | 12.54% |
| Fitness/Sports/Outdoors | $21M | 9.20% |
| Health/Wellness | $18M | 7.80% |
| Children/Education | $16M | 7.12% |
| Software/Tech | $11M | 4.94% |
| Business Services | $7M | — |
| Media/Entertainment | $7M | — |
| Pet Products | $7M | — |
| Travel | $6M | — |
| Uncertain/Other | $5M | — |
| Automotive | $5M | — |
| Liquor/Alcohol | $3M | — |
| Electronics | $2M | — |
| Green/CleanTech | $2M | — |
Investment by Sharks (Donut)
| SharkInvestment Share | |
| Mark Cuban | 26.24% |
| Lori Greiner | 19.09% |
| Robert Herjavec | 15.63% |
| Kevin O'Leary | 12.44% |
| Guest Sharks | 9.84% |
| Daymond John | 8.94% |
| Barbara Corcoran | 7.82% |
Mark Cuban alone controls more than a quarter of all capital deployed — more than Daymond John and Barbara Corcoran combined.
Views per Year in Millions (Bar Chart, by Season)
| SeasonViewership (M) | |
| 1 (2009) | 222 |
| 2 (2010) | 78 |
| 3 (2011) | 623 |
| 4 (2012) | 720 |
| 5 (2013) | 786 |
| 6 (2014) | 859 ← Peak |
| 7 (2015) | 629 |
| 8 (2016) | 488 |
| 9 (2017) | 352 |
| 10 (2018) | 372 |
| 11 (2019) | 421 |
| 12 (2020) | 346 |
| 13 (2021) | 286 |
| 14 (2022) | 191 |
Season 6 was the viewership peak at 859M, directly correlating with peak investment volume ($26M). The show has lost 77.8% of its peak viewership by Season 14.
Pitchers by Gender
| GenderCount | |
| Male | 703 (55.2%) |
| Female | 330 (25.9%) |
| Mixed Team | 241 (18.9%) |
| Total | 1,274 |
Invested Amount by Season (Bar Chart)
| SeasonInvestment | |
| 1 | $5M |
| 2 | $4M |
| 3 | $5M |
| 4 | $9M |
| 5 | $16M |
| 6 | $26M ← Peak |
| 7 | $21M |
| 8 | $20M |
| 9 | $19M |
| 10 | $22M |
| 11 | $22M |
| 12 | $22M |
| 13 | $19M |
| 14 | $21M |
Deal Detail Table (Drillable)
The central table lists every pitch with: Startup Name, Industry, Original Ask, Deal Amount, Original Offered Equity %, Deal Equity %, Valuation Requested, and Sharks in Deal. Totals row shows:
| ColumnTotal | |
| Original Ask Amount | $361.99M |
| Deal Amount Closed | $226.49M |
| Valuation Requested | $4.52B |
| Sharks in Deals | 1,003 |
Entrepreneurs collectively asked for $361.99M but walked away with $226.49M — receiving 62.6% of their initial ask on average.
Key Insights
- Software/Tech receives only 4.94% of investment despite being the highest-value sector in the broader economy. At $11M across 14 seasons, tech companies are dramatically underrepresented. This is a structural bias in Shark Tank's deal-making: the sharks — mostly retail, consumer goods, and real estate investors by background — consistently undervalue software businesses or struggle to assess their equity requirements. A founder pitching SaaS on Shark Tank faces a structurally skeptical room.
- Mark Cuban controls 26.24% of all deployed capital — more than Daymond John and Barbara Corcoran combined (16.76%). This concentration means the show's investment ecosystem heavily reflects one investor's appetite (tech, sports, high-growth consumer). If Cuban passes, the remaining sharks collectively represent a very different — and more conservative — risk profile.
- Viewership collapsed 77.8% from peak (859M in Season 6) to Season 14 (191M), yet investment held stable at $19–22M per season. This decoupling of audience size from deal activity is the single most counterintuitive finding in the dataset. The sharks continued deploying $20M+ per season even as the show lost three-quarters of its viewers, suggesting the deal-making function became independent of the marketing function after Season 6.
- Entrepreneurs received only 62.6% of their original funding ask ($226.49M vs $361.99M requested) — but average deal equity increased from 17,584 to 18,563 basis points total. Founders took less money at higher dilution than they originally proposed, the classic Shark Tank negotiation outcome. The equity drift upward while dollar amounts dropped means companies were implicitly valued lower than their founders' opening position in the majority of deals.
- Season 2 viewership crashed to 78M from Season 1's 222M — a 64.9% drop — before the show exploded to 623M in Season 3. This near-cancellation moment in Season 2 is the show's most important historical inflection point. Whatever changed between Season 2 and Season 3 (format, casting, pacing, marketing) drove a 698% viewership recovery that sustained the franchise for 12 more seasons.
- Male pitchers represent 55.2% of appearances but female and mixed-team pitchers (44.8% combined) likely punch above their weight on deal close rate. The dashboard doesn't show deal rate by gender directly, but the Filters panel enables this drill-down — and industry research consistently shows female-led pitches on Shark Tank close at higher rates. This is the highest-value follow-up analysis this template enables.
Who This Template Is For
- Business and MBA Students who want a structured dataset on startup funding dynamics, negotiation outcomes, and investor behavior across 14 years — with a ready-to-use Power BI template they can connect to updated Shark Tank datasets and explore for coursework or research.
- Data Analysts and BI Developers looking for a well-designed entertainment/business hybrid dashboard to study multi-tab navigation design, drillable donut + bar chart combinations, and KPI card + sparkline layout patterns they can adapt to their own client projects.
- Startup Founders and Pitch Coaches who want to understand which industries attract the most capital, which sharks invest most actively in which categories, and what the typical gap is between founder ask and final deal — to calibrate pitch strategy before entering any investor room.
How to Use
- Download the PBIX file from the Flexa Intel gallery.
- Open in Power BI Desktop — the template uses standard visuals and requires no custom visual installs to view the Overview page.
- Connect your data source — the underlying dataset is a structured Shark Tank episode table (likely sourced from Kaggle's public Shark Tank US dataset) with columns for season, episode, pitcher name, industry, ask amount, deal amount, equity offered, equity taken, valuation, and shark names. Replace or extend this table with updated season data as new episodes air.
- All visuals — the KPI cards, industry bars, shark donut, gender chart, viewership trend, and season investment timeline — refresh automatically when the source data is updated.
The central pitch detail table in this template shows every deal in a scrollable grid — but filtering by shark, comparing original ask to deal amount with an inline variance column, or flagging deals where equity drift exceeded 10 percentage points requires building custom measures. Flexa Tables is a Microsoft-certified Power BI visual that adds conditional formatting by deal outcome, sortable variance columns (Ask vs Deal, Offered vs Taken equity), and expandable industry groupings — turning the pitch table from a data grid into an interactive deal analysis tool.
Other Templates
 Free Sales & Revenue
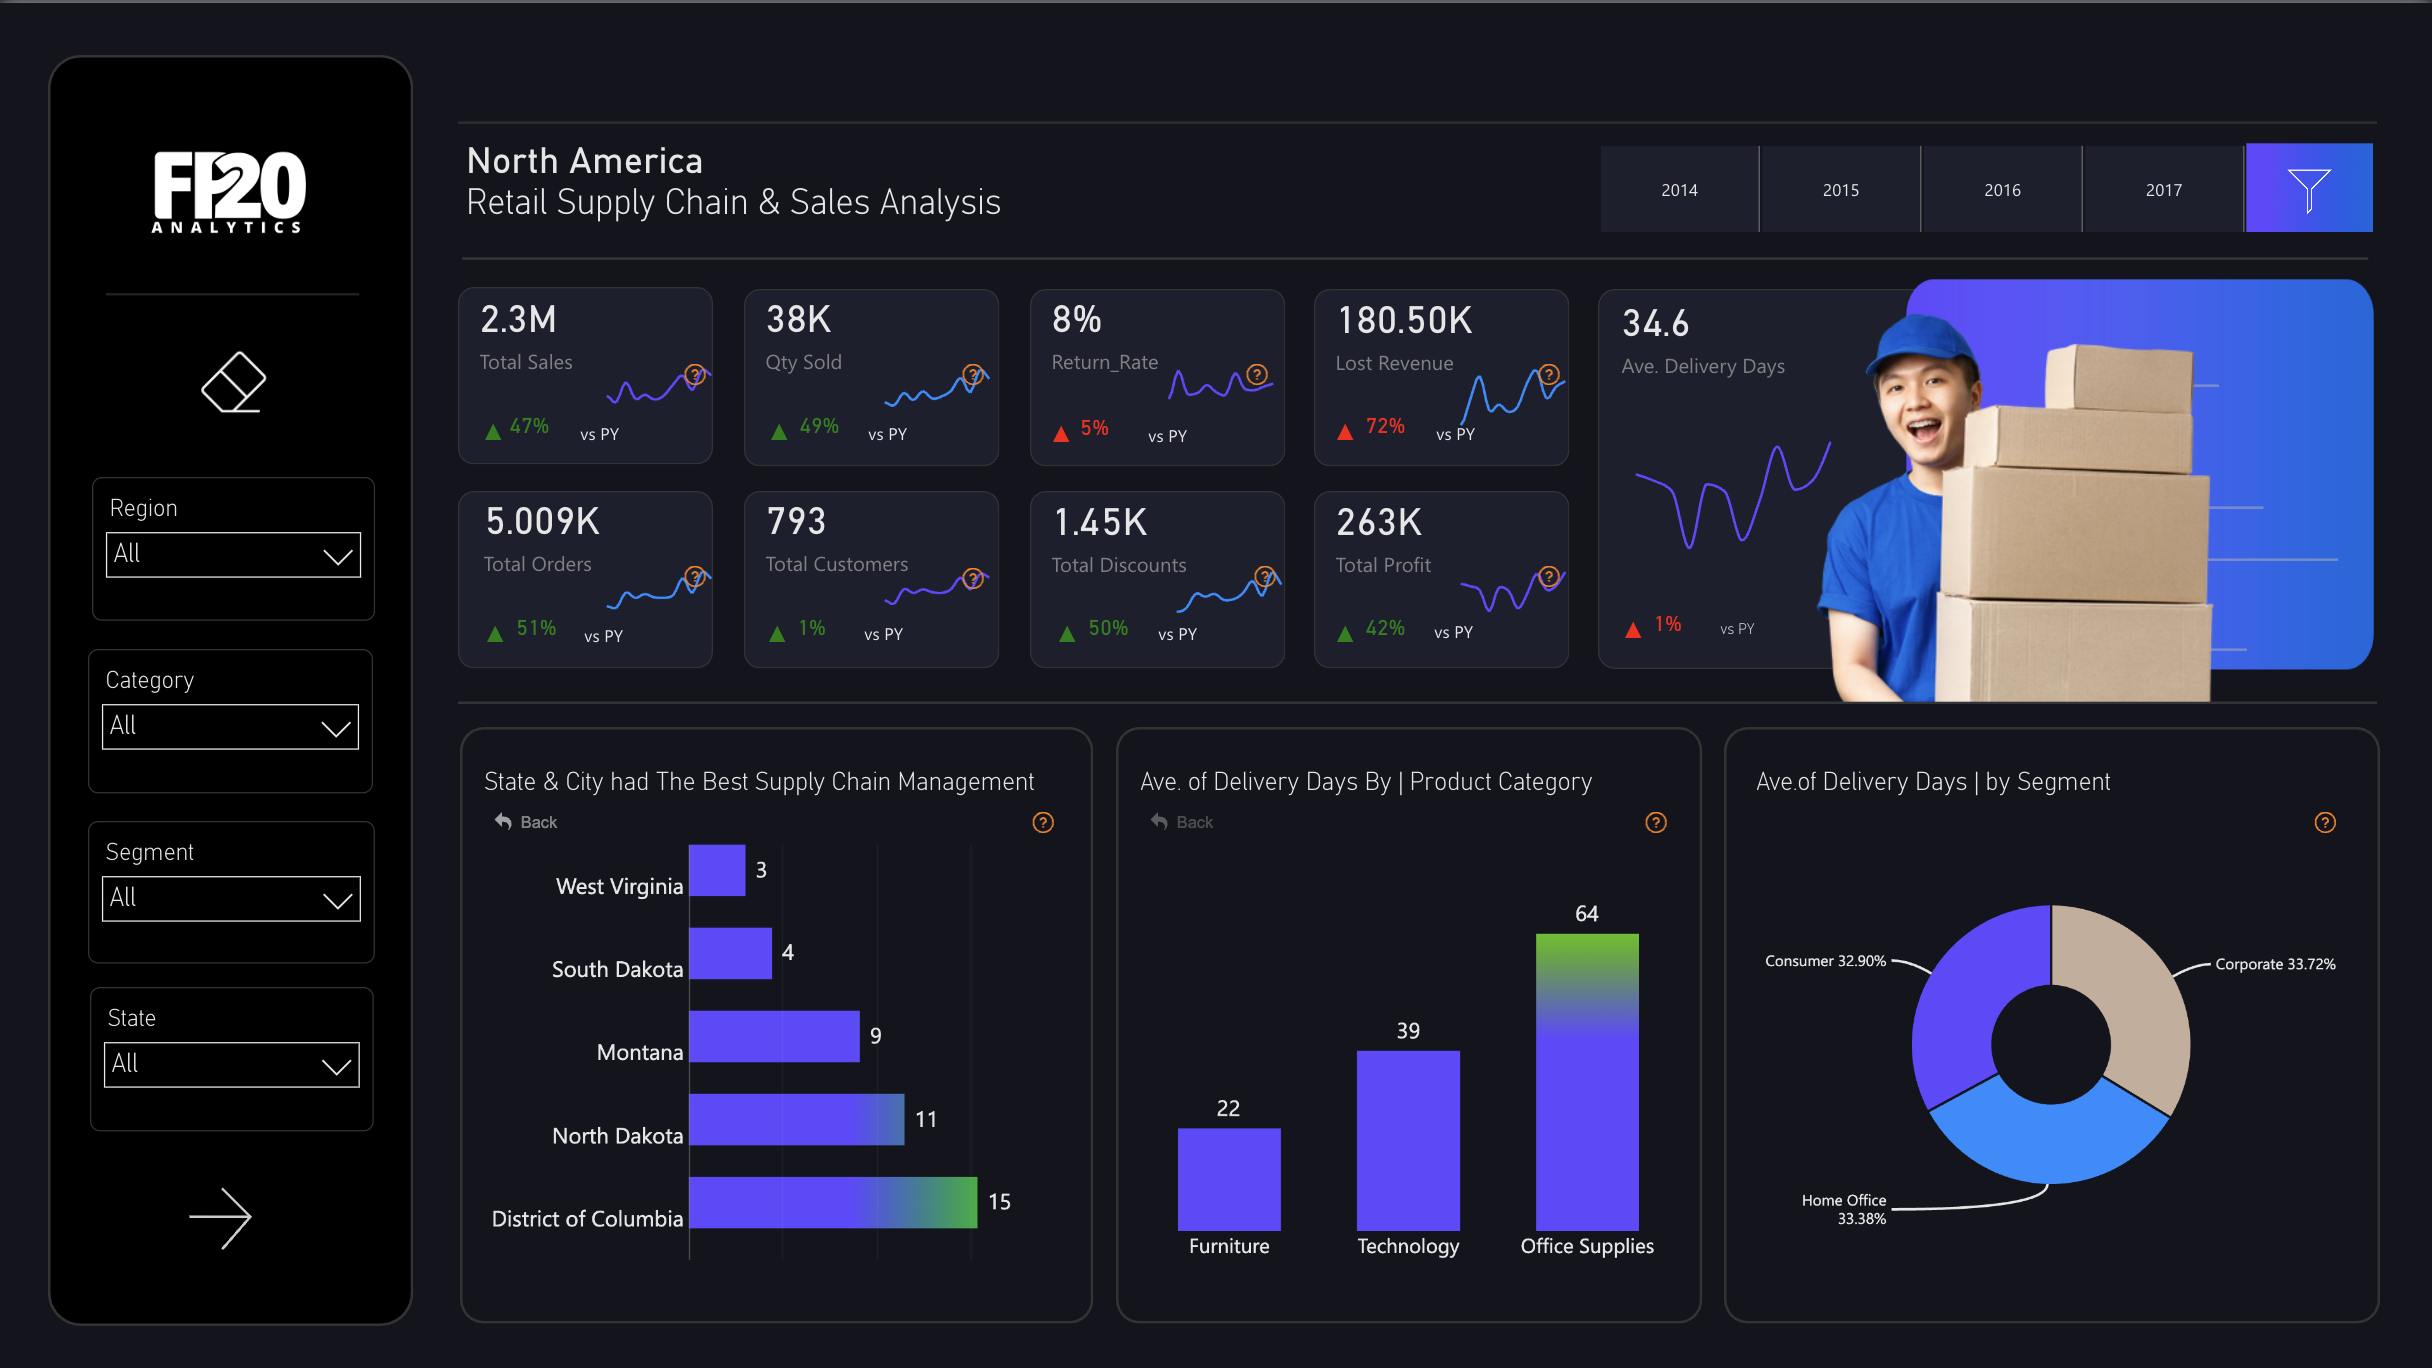
Power BI North America Retail Supply Chain & Sales Analysis Dashboard Template (Free PBIX Download)
 Free Sales & Revenue
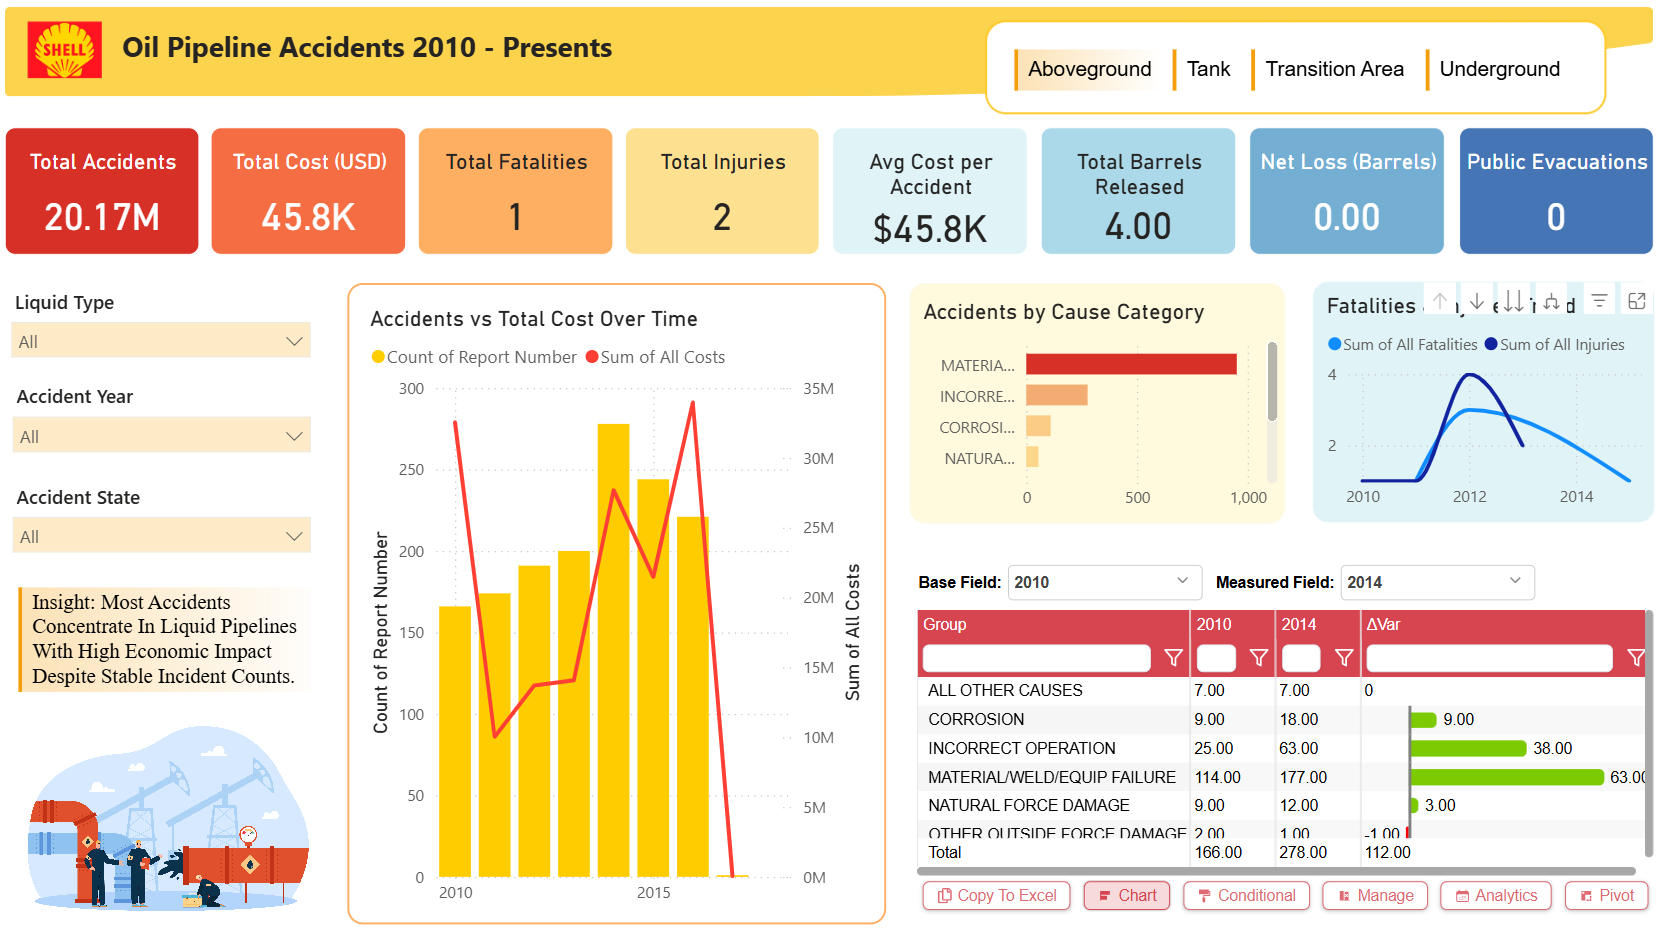
Shell Oil Pipeline Accidents Dashboard (2010–Present) – Key Insights
 Free Sales & Revenue
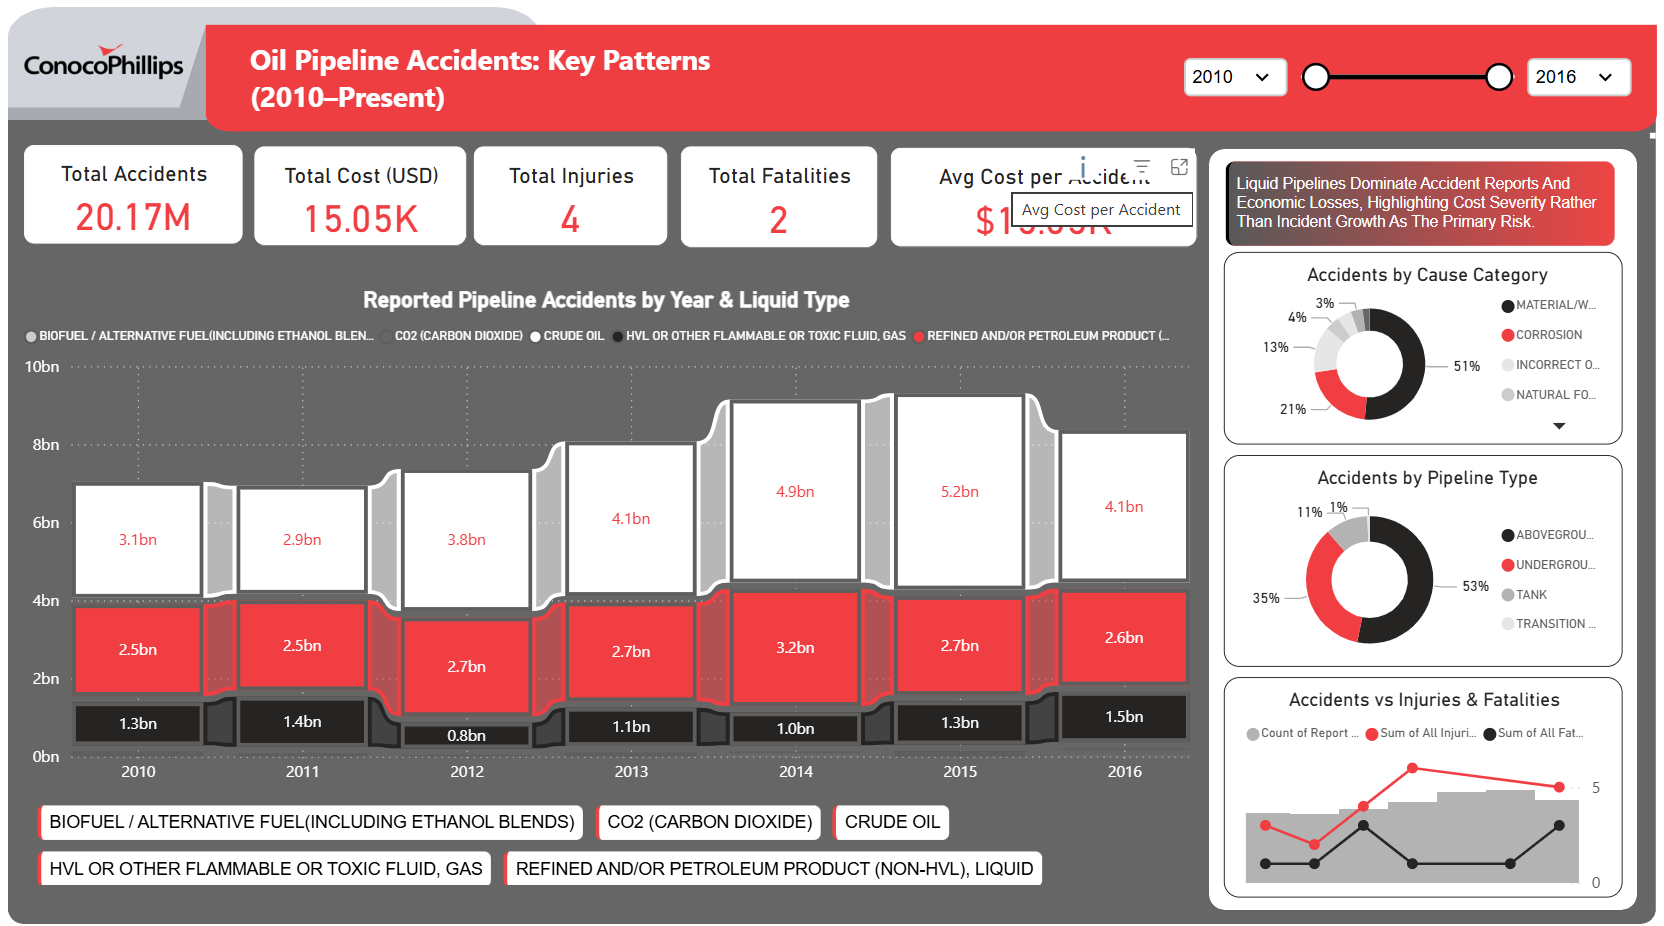
ConocoPhillips Oil Pipeline Accidents: Key Patterns (2010–Present) – Key Insights
If you find this website helpful, share it with friends and colleagues to boost their Power BI skills and work efficiency!
Like this site? Share it