Power BI Service Profit Analysis Dashboard Template (Free PBIX Download)
Introduction
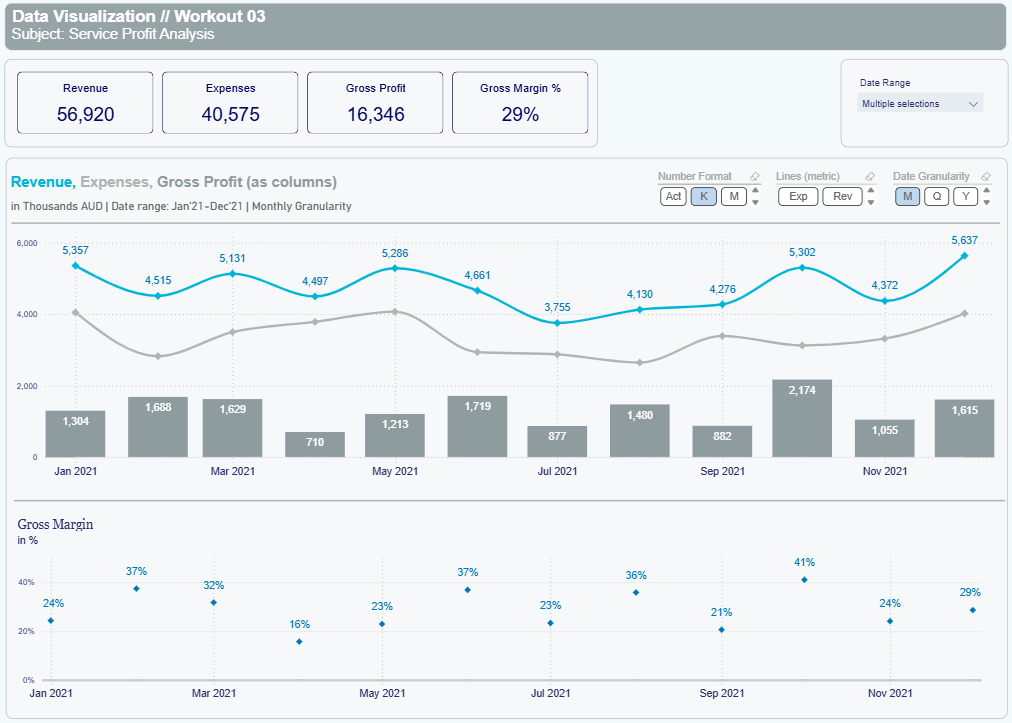
This dashboard tracks monthly service profitability across a full fiscal year, combining KPI summary cards with a dual-axis combo chart for Revenue, Expenses, and Gross Profit, plus a standalone Gross Margin % trend. It serves Finance Analysts and CFOs who need a single-page view of whether the business is expanding or compressing its margins over time. The design separates volume signals (absolute AUD figures) from efficiency signals (margin %) into two distinct chart zones — forcing readers to evaluate both dimensions independently.
5. What's Inside This Template
KPI Cards (top banner)
| MetricValue | |
| Revenue | 56,920K AUD |
| Expenses | 40,575K AUD |
| Gross Profit | 16,346K AUD |
| Gross Margin % | 29% |
The expense-to-revenue ratio across the full year is 71.3%, confirming 28.7% gross margin — consistent with the 29% card value. The gap between Revenue and Expenses is the primary profitability lever visible throughout the dashboard.
Date Range slicer (top right): supports multiple-period selection, enabling cross-period comparison without rebuilding the report.
Combo Chart — Revenue, Expenses, Gross Profit (as columns) Monthly granularity, Jan–Dec 2021, values in Thousands AUD. Revenue displayed as a cyan line, Expenses as a grey line, Gross Profit as grey bar columns.
| MonthRevenue (K)Gross Profit (K) | ||
| Jan 2021 | 5,357 | 1,304 |
| Feb 2021 | 4,515 | 1,688 |
| Mar 2021 | 5,131 | 1,629 |
| Apr 2021 | 4,497 | 710 |
| May 2021 | 5,286 | 1,213 |
| Jun 2021 | 4,661 | 1,719 |
| Jul 2021 | 3,755 | 877 |
| Aug 2021 | 4,130 | 1,480 |
| Sep 2021 | 4,276 | 882 |
| Oct 2021 | 5,302 | 2,174 |
| Nov 2021 | 4,372 | 1,055 |
| Dec 2021 | 5,637 | 1,615 |
Interactive toggles allow switching between Actual (Act), Thousands (K), and Millions (M) number formats, and between Expenses (Exp) and Revenue (Rev) as the secondary line metric. Date Granularity can be toggled between Monthly (M), Quarterly (Q), and Yearly (Y) — all without DAX changes.
Gross Margin % Chart (bottom panel) Dot plot showing monthly gross margin percentage, Jan–Dec 2021.
| MonthGross Margin % | |
| Jan 2021 | 24% |
| Feb 2021 | 37% |
| Mar 2021 | 32% |
| Apr 2021 | 16% |
| May 2021 | 23% |
| Jun 2021 | 37% |
| Jul 2021 | 23% |
| Aug 2021 | 36% |
| Sep 2021 | 21% |
| Oct 2021 | 41% |
| Nov 2021 | 24% |
| Dec 2021 | 29% |
6. Key Insights
1. April 2021 is a structural outlier, not just a slow month. Revenue in April (4,497K) was close to the annual average (~4,743K), but Gross Profit collapsed to 710K — the lowest of the year. Gross Margin dropped to 16%, 13 percentage points below the annual average. This implies an expense spike in April specifically, not a revenue problem. Any cost review should start here.
2. October delivered the best single-month profitability despite not being the highest revenue month. October revenue (5,302K) was below December's 5,637K, yet Gross Profit was the highest at 2,174K with a 41% margin — 12 points above the full-year average. This suggests either a favourable service mix or a cost reduction event in October that is not replicated elsewhere.
3. Revenue and Gross Profit are decoupled — volume does not predict margin. The correlation between monthly Revenue and Gross Margin % is weak. January had 5,357K revenue but only 24% margin. June had 4,661K revenue but 37% margin. This decoupling signals that service mix or cost structure — not volume — drives profitability, which is a critical finding for pricing strategy.
4. The business has a clear high-margin cluster (Feb, Jun, Aug, Oct) and a low-margin cluster (Apr, Jul, Sep). The low-margin months average 20% gross margin vs 37% for the high-margin cluster — a 17-point spread within the same business year. If the low-margin months share a common client type, project category, or cost driver, isolating and repricing that segment could lift the full-year average by 4–6 points.
5. Q4 closed strongest in both volume and margin recovery. October–December combined: Revenue 15,311K (27% of annual total), Gross Profit 4,844K (29.6% margin). This is above the full-year 29% average and shows the business recovered from the mid-year dip effectively. Whether this was seasonal or strategic needs a multi-year comparison to confirm.
6. Expense line is sticky — it does not fall proportionally when revenue dips. In July, Revenue fell to 3,755K (the year's lowest), but Gross Profit only fell to 877K — implying Expenses were approximately 2,878K. In October with 5,302K revenue, Expenses were approximately 3,128K. Expenses increased by only 250K while revenue increased by 1,547K — confirming that at higher revenue levels, the cost base is relatively fixed, and incremental revenue flows more directly to profit.
7. Who This Template Is For
- Finance Analysts at professional services or consulting firms who need a ready-to-use monthly P&L trend template they can connect to their firm's billing and cost data in under an hour.
- CFOs and Finance Managers reviewing service-line profitability who want a single dashboard that separates volume trends from margin efficiency without requiring multiple report tabs.
- BI Developers building financial reporting for clients who need a polished, parameterized template with built-in number format toggles and date granularity controls — reducing custom development time.
8. How to Use
- Download the PBIX file from this page.
- Open in Power BI Desktop (any version from 2022 onward).
- Connect your data source — replace the sample data with your own billing system export, ERP data (SAP, Oracle, Xero, MYOB), or Excel/CSV cost table. Map Revenue, Expenses, and Date fields to the existing model.
- All visuals update automatically — KPI cards, combo chart, and Gross Margin % trend repopulate based on your connected data. Toggle controls for number format and date granularity work without any DAX edits.
9. Soft CTA (Flexa Tables)
This dashboard surfaces margin trends effectively, but lacks a tabular breakdown of which service lines, cost categories, or client segments are driving the April and September margin dips. Flexa Tables is a Microsoft-certified Power BI visual that adds a structured drill-down table with MoM and YoY variance columns directly inside your published report — no DAX required. Finance teams can explore cost variances by category without requesting a report rebuild.
Other Templates
 Free Other / General
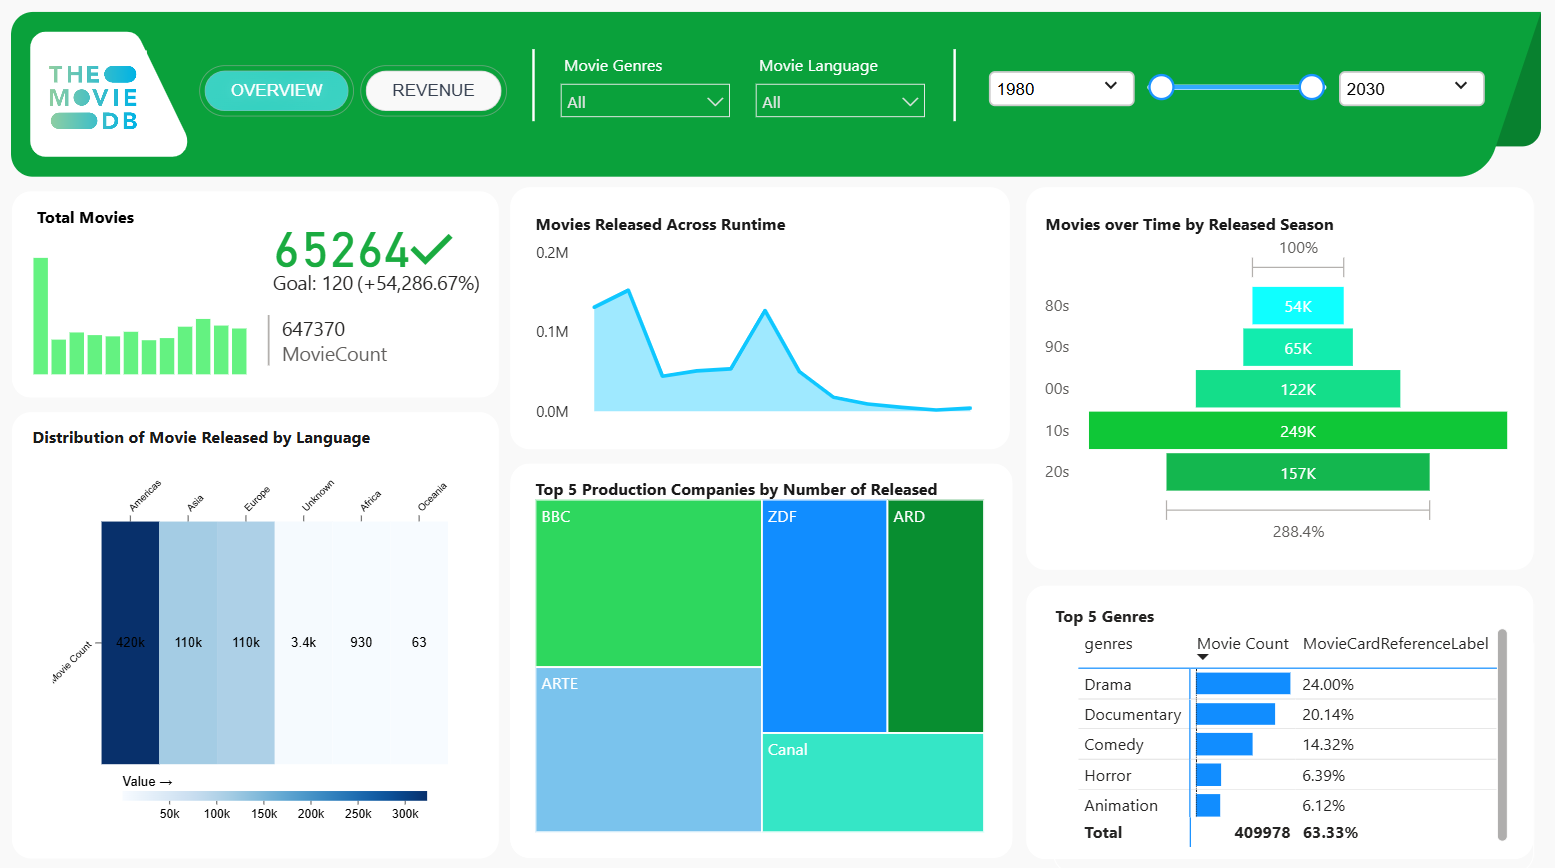
The Movie DB Overview dashboard
.png?alt=media&token=e3dd6a14-fcf2-497f-b998-4464ee141dd9) $10
$10Marketing Campaigns Dashboard
 Free
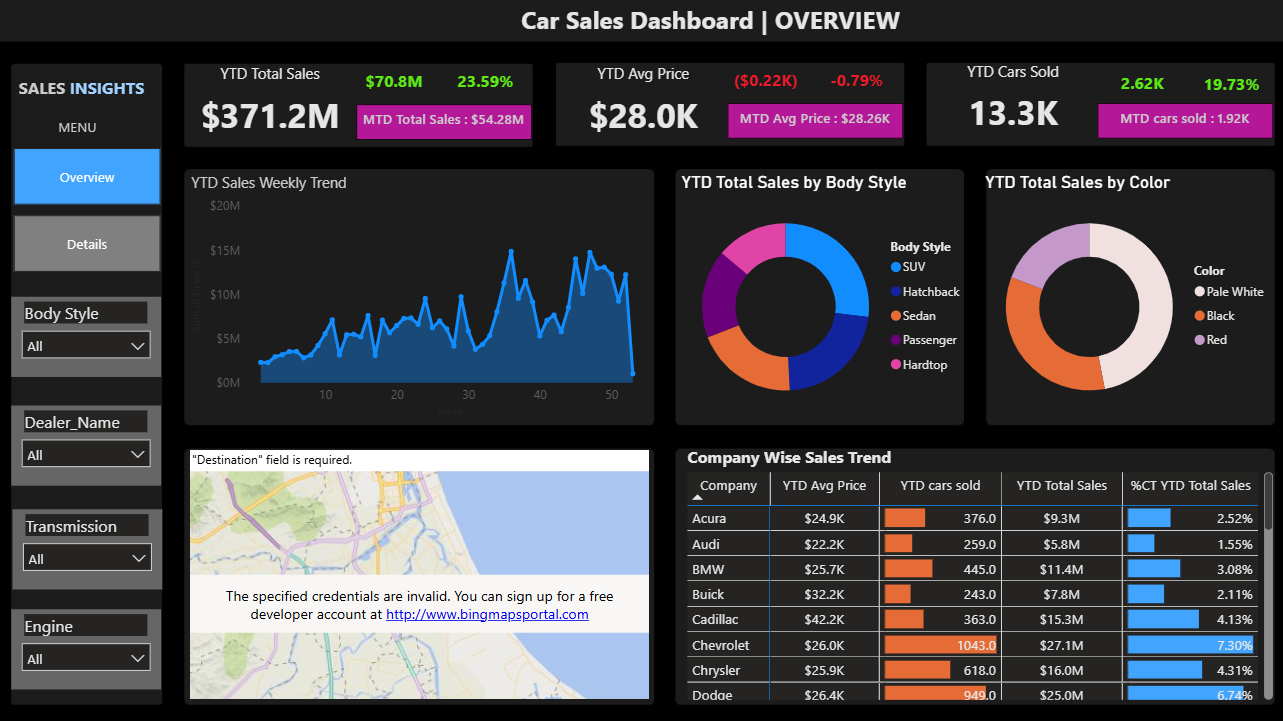
Free Power BI Car Sales Dashboard Template — Automotive Overview (Free PBIX Download)
If you find this website helpful, share it with friends and colleagues to boost their Power BI skills and work efficiency!
Like this site? Share it