Power BI Sales & Financial Performance Dashboard Template — FMCG Retail Analytics (Free PBIX Download)
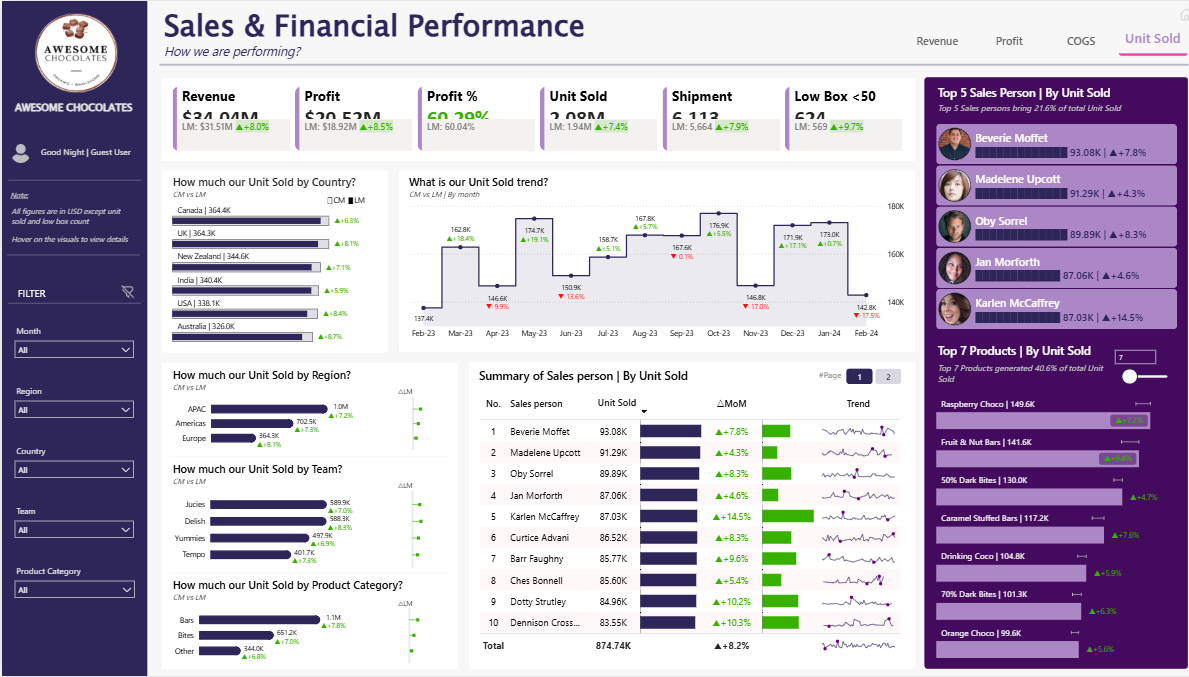
Introduction: This Power BI Sales & Financial Performance dashboard tracks a chocolate brand's complete commercial operation — from headline revenue and profit KPIs down to individual sales rep performance, product-level unit rankings, and geographic distribution across 6 countries and 3 regions. Built with Current Month vs Last Month (CM vs LM) variance logic baked into every visual, it gives sales managers and commercial directors a live pulse on whether the business is accelerating or decelerating — at every level of the hierarchy simultaneously.
What's Inside This Template
Top KPI Banner (CM vs LM with variance)
All KPIs show current month value, last month baseline, and directional variance — every metric is green/positive in this view:
| MetricCurrentLast MonthVariance | |||
| Revenue | ~$34.04M | $31.51M | +8.0% |
| Profit | ~$20.53M | $18.92M | +8.5% |
| Profit % | ~60.29% | 60.04% | +0.4pp |
| Unit Sold | ~2.08M | 1.94M | +7.4% |
| Shipment | ~6,113 | 5,664 | +7.9% |
| Low Box <50 | ~534 | 565 | -9.7% |
Four-tab navigation at top right: Revenue | Profit | COGS | Unit Sold (active) — confirming this is a multi-metric dashboard where the entire layout recontextualizes around the selected KPI dimension.
The Low Box <50 metric at -9.7% MoM is the only red KPI — tracking small-order shipments (boxes with fewer than 50 units), a common proxy for inefficient micro-orders that inflate logistics costs. Its decline is actually a positive operational signal: fewer small, costly shipments.
Unit Sold by Country (CM vs LM bar chart)
| CountryUnitsMoM | ||
| Canada | 364.4K | +6.8% |
| UK | 364.3K | +8.1% |
| New Zealand | 344.6K | +7.1% |
| India | 340.4K | +5.9% |
| USA | 338.1K | +8.4% |
| Australia | 326.0K | +8.7% |
Remarkably uniform distribution — all six countries within a 38.4K unit range (326K–364.4K), each approximately 16–17% of total. Every country shows positive MoM growth between +5.9% and +8.7%. Australia has the lowest absolute volume but the highest growth rate (+8.7%), suggesting it is the fastest-accelerating market despite being smallest. India has the lowest growth rate (+5.9%) — worth monitoring as the only major emerging market in the portfolio.
Unit Sold by Region (CM vs LM)
| RegionUnitsMoM | ||
| APAC | 1.0M | +7.2% |
| Americas | 702.5K | +7.1% |
| Europe | 364.3K | +8.1% |
APAC dominates at 1.0M units — comprising New Zealand, India, and Australia combined. Europe (364.3K) maps exactly to the UK figure, confirming UK is the sole European market in this dataset.
Unit Sold by Team (CM vs LM)
| TeamUnitsMoM | ||
| Jucies | 589.9K | +7.0% |
| Delish | 588.3K | +8.9% |
| Yummies | 497.9K | +6.3% |
| Tempo | 401.7K | +7.5% |
Four teams with Jucies and Delish nearly tied at the top (~589K each). Delish has the highest MoM growth (+8.9%) while Yummies has the lowest (+6.3%) — the gap between best and worst team growth rate is 2.6 percentage points, a manageable spread that doesn't indicate structural underperformance in any team.
Unit Sold by Product Category (CM vs LM)
| CategoryUnitsMoM | ||
| Bars | 1.1M | +7.8% |
| Bites | 651.2K | +7.0% |
| Other | 344.0K | +6.8% |
Bars dominate at 1.1M units (52.6% of total), Bites at 31.3%, Other at 16.6%. Growth is positive across all three but Bars leads both volume and growth rate — the core category driving commercial performance.
Unit Sold Monthly Trend (Feb 2023 – Feb 2024)
13-month area/line chart with CM vs LM overlaid and MoM variance labeled at each data point:
| MonthUnitsMoM | ||
| Feb-23 | 137.4K | — |
| Mar-23 | 146.6K | — |
| Apr-23 | 162.8K | +18.4% |
| May-23 | 174.7K | +19.1% |
| Jun-23 | 150.9K | -13.6% |
| Jul-23 | 158.7K | +5.1% |
| Aug-23 | 167.8K | +5.7% |
| Sep-23 | 167.6K | +5.3% |
| Oct-23 | 146.8K | -17.0% |
| Nov-23 | 171.9K | +17.1% |
| Dec-23 | 173.0K | +0.7% |
| Jan-24 | 142.8K | -37.5% |
| Feb-24 | 176.9K | +5.7% |
Three major dips visible: Jun-23 (-13.6%), Oct-23 (-17.0%), Jan-24 (-37.5%). The Jan-24 drop of -37.5% is the sharpest single-month decline in the dataset — a post-holiday demand reset typical in confectionery. The recovery to Feb-24 (+5.7%) is modest relative to the January drop, suggesting February has not yet recovered to December levels. The Apr–May 2023 surge (+18–19%) likely reflects an Easter/spring promotional push — the largest positive spike in the entire period.
Summary of Sales Person | By Unit Sold (Table with Sparklines)
| RankSales PersonUnit SoldMoMTrend | ||||
| 1 | Beverie Moffet | 93.08K | +7.8% | Sparkline |
| 2 | Madelene Upcott | 91.29K | +4.3% | Sparkline |
| 3 | Oby Sorrel | 89.89K | +8.3% | Sparkline |
| 4 | Jan Morforth | 87.06K | +4.6% | Sparkline |
| 5 | Karlen McCaffrey | 87.03K | +14.5% | Sparkline |
| 6 | Curtice Advani | 86.52K | +8.3% | Sparkline |
| 7 | Barr Faughny | 85.77K | +9.6% | Sparkline |
| 8 | Ches Bonnell | 85.60K | +5.4% | Sparkline |
| 9 | Dotty Strutley | 84.96K | +10.2% | Sparkline |
| 10 | Dennison Cross... | 83.55K | +10.3% | Sparkline |
| Total | 874.74K | +8.2% |
Top 5 Sales Persons panel (right sidebar) with profile photos and MoM badges confirms the top 5 generate 21.6% of total unit sold — meaning 5 reps out of the full team account for roughly one-fifth of all volume.
Karlen McCaffrey at +14.5% MoM is the standout growth performer despite ranking 5th by volume — the highest acceleration rate of any top-10 rep. Dennison Cross at +10.3% and Dotty Strutley at +10.2% are the two fastest-growing reps outside the top 4 by volume — strong candidates for expanded territory or quota increase.
Top 7 Products | By Unit Sold (right sidebar)
Top 7 products generate 40.6% of total unit sold:
| ProductUnitsMoM | ||
| Raspberry Choco | 149.6K | — |
| Fruit & Nut Bars | 141.6K | — |
| 50% Dark Bites | 130.0K | +4.7% |
| Caramel Stuffed Bars | 117.2K | +7.6% |
| Drinking Coco | 104.8K | +5.9% |
| 70% Dark Bites | 101.3K | +6.3% |
| Orange Choco | 99.6K | +5.6% |
Raspberry Choco (149.6K) and Fruit & Nut Bars (141.6K) are the clear volume leaders. The 50.0K unit gap between #1 (Raspberry Choco) and #7 (Orange Choco) across the top 7 shows meaningful differentiation — this is not a flat long-tail; the top 2 products each outsell #7 by 50%+.
Key Insights
- Karlen McCaffrey is the most important rep to watch — +14.5% MoM growth while ranked 5th by volume. If this growth rate is sustained for 2–3 more months, McCaffrey will break into the top 3 by volume. This is a coaching signal: whatever McCaffrey is doing differently this month should be extracted and replicated across the team. The +14.5% MoM is nearly double the team average of +8.2%.
- The Jan-24 -37.5% crash is structurally expected in confectionery but the Feb-24 recovery of only +5.7% is insufficient. Feb-24 at 176.9K has not recovered to December levels (173.0K → Jan → 176.9K), suggesting demand has recovered but the post-Christmas hangover is deeper than prior years. The Apr–May surge pattern from 2023 (+18–19%) should be the target benchmark for the spring recovery — if Apr-24 doesn't show a similar surge, the business is losing seasonal momentum.
- 60.29% profit margin on a chocolate/FMCG brand is exceptionally high — consumer goods companies typically run 20–40% gross margins. This suggests either the revenue figure represents net revenue after significant COGS offset, the product mix skews heavily toward premium/high-ASP items, or the profit metric in this dataset is gross contribution rather than net profit. The COGS tab is essential to verify the cost structure before presenting these margins to external stakeholders.
- All 6 countries within a 38.4K unit range (326K–364.4K) is statistically improbable for an organic demand distribution. Markets with different sizes, demographics, and chocolate consumption cultures should not produce near-identical unit volumes. This either reflects quota-based territory management (sales targets set by country rather than by market potential) or a dataset structured for demonstration symmetry. Analysts using this template should expect real-world data to show much higher geographic concentration.
- Top 7 products (40.6% of volume) with Raspberry Choco and Fruit & Nut Bars each 50%+ larger than #7 confirms a healthy portfolio leader dynamic — the top 2 are genuine hero SKUs that can anchor promotional strategy, while products #5–7 (Drinking Coco, 70% Dark Bites, Orange Choco at 99–105K) are strong enough to sustain without promotion but not yet hero candidates. The 7-product toggle slider in the sidebar allows expanding or contracting the product leaderboard — a useful UX feature for different audience levels.
- The Low Box <50 decline of -9.7% MoM (534 vs 565) is the only metric in red and the only genuinely positive operational development. Small-order boxes drive disproportionate per-unit logistics costs in chocolate distribution (temperature-controlled shipping, packaging overhead). Fewer micro-orders means better shipment consolidation and lower cost-per-unit delivered — a supply chain efficiency improvement that won't show in revenue but will show in COGS margin over time.
Who This Template Is For
- Commercial Directors and Sales Managers at FMCG, food & beverage, or consumer goods brands who need a single-page dashboard combining KPI headline performance, geographic distribution, team ranking, product leaderboard, and individual rep tracking with MoM variance at every level
- Sales Operations Analysts building territory and quota performance reporting that shows which reps are accelerating vs plateauing, which markets are outgrowing their peers, and which products are gaining or losing volume momentum month-over-month
- BI Developers building sales performance systems for branded goods companies who need a production-ready template with sparkline trend columns, photo-card leaderboards, multi-tab KPI switching (Revenue/Profit/COGS/Units), and CM vs LM comparison logic throughout
How to Use
- Download the PBIX file
- Open in Power BI Desktop
- Connect your sales transactions data source — the model requires a fact table with date, sales rep, country, region, team, product, product category, revenue, profit, COGS, units sold, shipment count, and box size fields
- Use the Month, Region, Country, Team, and Product Category slicers (left panel) to filter all visuals simultaneously; switch between Revenue, Profit, COGS, and Unit Sold tabs to recontextualize the entire dashboard around each financial dimension
"The sales rep summary table in this dashboard uses a native Power BI matrix with sparklines. To add expandable team hierarchies, variance-to-target columns per rep, and conditional formatting by performance band (above/below quota) — Flexa Tables is a Microsoft-certified Power BI visual built for exactly this kind of structured sales performance tabular reporting."
Other Templates
 Free Retail & E-commerce
Power BI Electronic Product Reviews Dashboard Template (Free PBIX Download)
 Free Sales & Revenue
Power BI Blinkit Grocery Sales Dashboard Template (Free PBIX Download)
 Free Sales & Revenue
ConocoPhillips Oil Pipeline Accidents: Key Patterns (2010–Present) – Key Insights
If you find this website helpful, share it with friends and colleagues to boost their Power BI skills and work efficiency!
Like this site? Share it