Power BI Sales Dashboard with Variance Analysis — Contoso BI Template (Free PBIX Download)

Introduction
This free Power BI Sales Dashboard template delivers a professional-grade management reporting experience — combining product hierarchy sales tables, month-to-month variance analysis, seasonal trend charts, and a Top 10 product performance matrix in a single view. Designed around the Contoso BI dataset, it demonstrates how to build a boardroom-ready sales report with inline sparkline variance indicators, showing not just what the numbers are, but how much they changed from the previous period.
Filtered to December 2009 with MTM (Month-to-Month) comparison mode active, this dashboard is a masterclass in variance reporting — one of the most searched Power BI use cases for finance and sales analysts.
What's Inside This Template
1. Product Hierarchy Sales & Margin Table (Top Section)
A hierarchical matrix table breaks performance down by Product Category → SKU level, showing four columns:
| ColumnMeaning | |
| Sales AC | Actual sales for the selected period |
| Sales ΔPM | Variance vs. Previous Month (with red/green inline bars) |
| Margin AC | Actual gross margin |
| Margin ΔPM | Margin variance vs. Previous Month |
Audio Category — December 2009:
| ProductSales ACSales ΔPMMargin ACMargin ΔPM | ||||
| Bluetooth Headphones | $456.5K | -$8.4K ❌ | $215.6K | -$0.9K |
| MP4&MP3 | $482.6K | -$64.6K ❌ | $233.2K | -$24.9K |
| Recording Pen | $412.8K | +$54.7K ✅ | $173.0K | +$20.1K ✅ |
| Audio Total | $1.4M | -$18.3K | $621.9K | -$5.6K |
The Audio category as a whole declined vs. previous month (-$18.3K), dragged down by MP4&MP3 (-$64.6K) despite Recording Pen's strong recovery (+$54.7K). This variance offset pattern is a key insight — one SKU is masking weakness in the others.
Cameras & Camcorders Category:
| ProductSales ACSales ΔPMMargin ACMargin ΔPM | ||||
| Camcorders | $5.5M | -$237.0K ❌ | $2.7M | -$144.9K |
| Cameras & Camcorders | $604.3K | -$46.9K ❌ | $264.7K | -$27.5K |
| Digital Cameras | $1.8M | -$12.3K | $840.8K | -$4.2K |
| Digital SLR Cameras | $4.0M | +$596.0K ✅ | $2.1M | +$325.2K ✅ |
| Category Total | $11.9M | +$299.7K ✅ | $5.9M | +$148.6K ✅ |
Cameras & Camcorders is the strongest category in December — driven almost entirely by Digital SLR Cameras (+$596K vs. PM). This single SKU more than offset a -$237K decline in Camcorders, delivering net category growth of +$299.7K. A classic example of how product-mix shift drives overall performance.
Cell Phones Category:
- Cell Phone Accessories: $1.4M sales, +$406.7K ΔPM ✅ — strong month-over-month growth
- Home & Office Phones: $224.4K, +$11.0K — modest positive variance
Cell Phone Accessories is showing the second-strongest individual product variance in the table — a signal worth watching for inventory and promotional planning.
2. Monthly Sales Trend Chart (Jan–Dec 2009)
The bar chart tracks full-year monthly sales with ΔPM variance bars (green = above PM, red = below PM) overlaid above:
| PeriodSalesΔPM | ||
| Jan | $57.5M | — |
| Feb | $59.9M | +$2.4M ✅ |
| Mar | $60.8M | +$0.9M ✅ |
| Apr | $69.9M | +$9.1M ✅ |
| May | $82.1M | +$12.2M ✅ Peak |
| Jun | $81.8M | -$0.3M ⚠️ |
| Jul | $82.8M | +$1.0M ✅ |
| Aug | $77.6M | -$5.2M ❌ |
| Sep | $74.7M | -$2.9M ❌ |
| Oct | $75.2M | +$0.5M |
| Nov | $67.2M | -$8.0M ❌ |
| Dec | $68.3M | +$1.2M ✅ |
Key trend observations:
- May is the peak month at $82.1M with the largest single-month jump (+$12.2M vs. April) — a seasonal spike that likely corresponds to a promotional event or product launch
- August through November is a sustained 4-month decline — sales fell from $82.8M in July to $67.2M in November (-$15.6M / -19%). This is a significant second-half slowdown
- December shows early recovery (+$1.2M vs. November) — typical holiday season lift beginning to materialize
- The Q1 growth trajectory (Jan→May: +$24.6M, +42.8%) contrasts sharply with the Q3–Q4 erosion — a business with strong spring demand and weak back-to-school/pre-holiday performance
3. Products Top 10 Table — Sales, Margin & Quantity with Variance
The bottom table shows the top 10 individual SKUs with full variance analysis across three dimensions: Sales, Margin, and Quantity.
| ProductSales ACSales ΔPMMargin ACMargin ΔPMQty ACQty ΔPM | ||||||
| Adventure Works 52" LCD HDTV X590 | $191.1K | +$88.2K ✅ | $112.3K | +$51.6K ✅ | 82 | +38 |
| Cigarette Lighter Adapter Contoso P. | $198.2K | +$128.6K ✅ | $74.3K | +$49.1K ✅ | 9.7K | +6.2K ✅ |
| Contoso Washer & Dryer 15.5in E155 | $173.2K | +$74.7K ✅ | $65.2K | +$28.8K ✅ | 211 | +91 |
| Fabrikam Laptop19 M9000 Black | $180.0K | -$76.4K ❌ | $107.1K | -$45.9K ❌ | 199 | -85 ❌ |
| Fabrikam Laptop19W M9800 Black | $195.0K | +$14.0K | $115.6K | +$8.5K | 196 | +13 |
| Fabrikam Refrigerator 24.7CuFt X9800 | $192.0K | +$90.9K ✅ | $114.6K | +$54.8K ✅ | 72 | +34 |
| Litware Refrigerator 24.7CuFt X980 Brown | $239.0K | -$113.0K ❌ | $141.5K | -$64.2K ❌ | 90 | -46 ❌ |
| Litware Refrigerator 24.7CuFt X980 Grey | $196.5K | -$83.5K ❌ | $115.9K | -$50.7K ❌ | 76 | -30 ❌ |
| Litware Refrigerator L1200 Orange | $202.6K | +$73.9K ✅ | $119.9K | +$45.3K ✅ | 78 | +30 |
| WWI Projector 1080p LCD86 White | $174.0K | +$20.0K ✅ | $101.0K | +$12.4K ✅ | 94 | +12 |
Three sharp observations from the Top 10 table:
- Litware Refrigerators are deeply split by color variant — Brown (-$113K) and Grey (-$83.5K) are both declining sharply, while Orange (+$73.9K) is growing. This is a product variant/color preference story that has direct implications for inventory allocation and merchandising.
- Fabrikam Laptop19 M9000 Black is the biggest single-product concern — declining across all three metrics (Sales -$76.4K, Margin -$45.9K, Quantity -85 units). May indicate a competitive displacement or end-of-lifecycle situation.
- Cigarette Lighter Adapter volume surge — 9.7K units sold with +6.2K vs PM. This is an accessory/low-ticket item generating volume at scale — likely bundled or promoted alongside a device launch.
Key Insights Summary
- Digital SLR Cameras is the MVP of December — a single subcategory driving +$596K variance and lifting the entire Cameras category into positive territory. Without it, the category would have declined -$296K.
- MP4&MP3 players are in structural decline — MP4&MP3 shows -$64.6K vs PM and is likely facing obsolescence pressure from smartphones. A product lifecycle management decision is needed.
- May peak to November trough = -19% revenue erosion — the 4-month decline from July to November is too sustained to be random. Likely reflects category seasonality or a missed promotional window in back-to-school season (August–September).
- Litware Refrigerator color variants reveal demand concentration risk — two of three color variants declining while one grows suggests the grey/brown colorways may need to be phased out or discounted to clear inventory.
- Margin % is consistent with sales % across most SKUs — when sales variance and margin variance move in the same direction and proportion, it confirms pricing/discount rates are stable. No margin-dilutive promotions are visible in December.
- Cell Phone Accessories +$406.7K is the hidden growth driver — this subcategory has the second-largest positive variance in the entire table but sits below the fold. An analyst relying only on category totals would miss this entirely.
- December's +$1.2M recovery vs. November is encouraging but modest relative to the May peak ($82.1M vs $68.3M). The business is entering year-end $13.8M below its seasonal high — a gap that warrants a Q4 promotional strategy review.
Dashboard Design Highlights
This template demonstrates several advanced Power BI techniques that BI developers can study and reuse:
- Inline variance bars embedded directly in table cells (red/green bullet chart columns)
- Dual-axis variance chart — absolute sales bars combined with ΔPM variance bars above the chart area
- MTM toggle — switchable time intelligence using a dropdown slicer (MTM / YTD / PY modes)
- Hierarchical drilldown matrix — expandable/collapsible product category rows
- Legend panel defining all abbreviations (AC, PM, PY, BU, FC, MTM, YTD) — best practice for executive dashboards
Who This Template Is For
| RoleUse Case | |
| Sales Analysts | Month-to-month variance tracking across product hierarchies |
| Category Managers | Identify which SKUs are driving or dragging category performance |
| BI Developers | Learn advanced variance table design, inline indicators, and time intelligence toggles |
| Finance Controllers | Monitor margin performance alongside sales at SKU level |
How to Use This Template
- Download the PBIX file
- Open in Power BI Desktop
- Connect your own sales data source (replace Contoso sample data)
- The MTM/YTD toggle, product hierarchy, and trend chart all update automatically
- Publish to Power BI Service for live monthly reporting
Take Your Variance Reporting Further
Want richer variance tables with conditional row shading, subtotal formatting, and dynamic column switching between AC / Budget / Forecast? Explore Flexa Tables — a Microsoft-certified Power BI visual purpose-built for management reporting and financial dashboards.
Tags
power bi sales dashboard · power bi variance analysis template · MTM dashboard power bi · power bi product hierarchy table · sales margin variance power bi · contoso bi power bi template · power bi management reporting · power bi month over month comparison · top 10 products power bi · free power bi sales dashboard pbix download
Other Templates
 Free Sales & Revenue
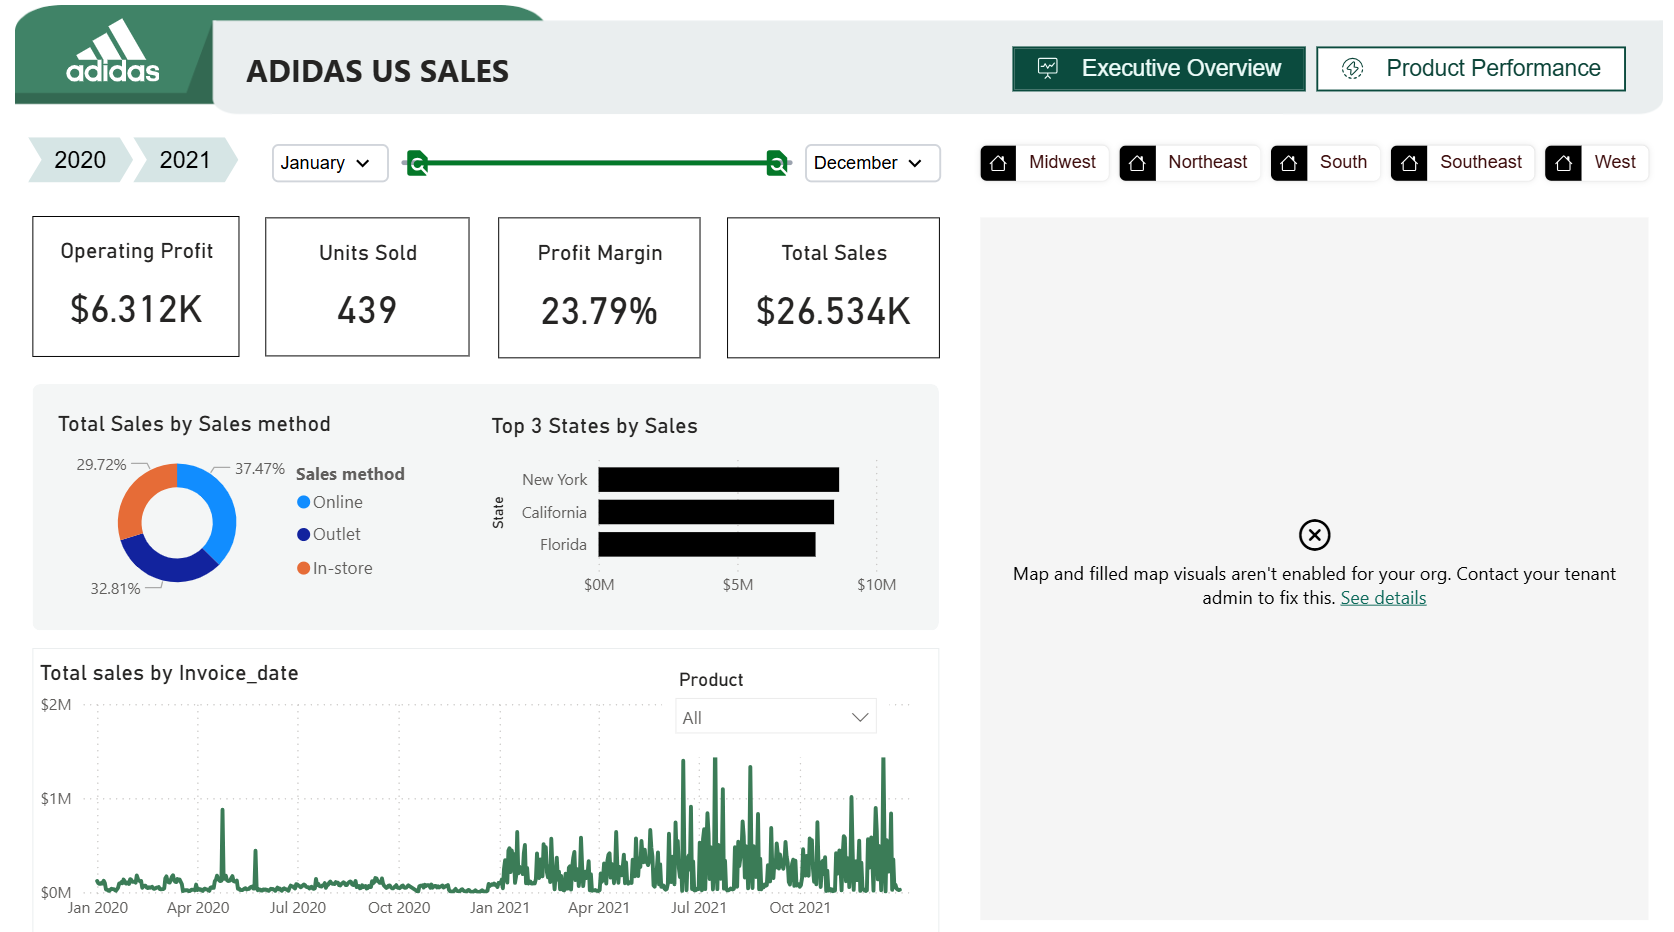
Adidas US Sales (2020–2021)
 Free Sales & Revenue
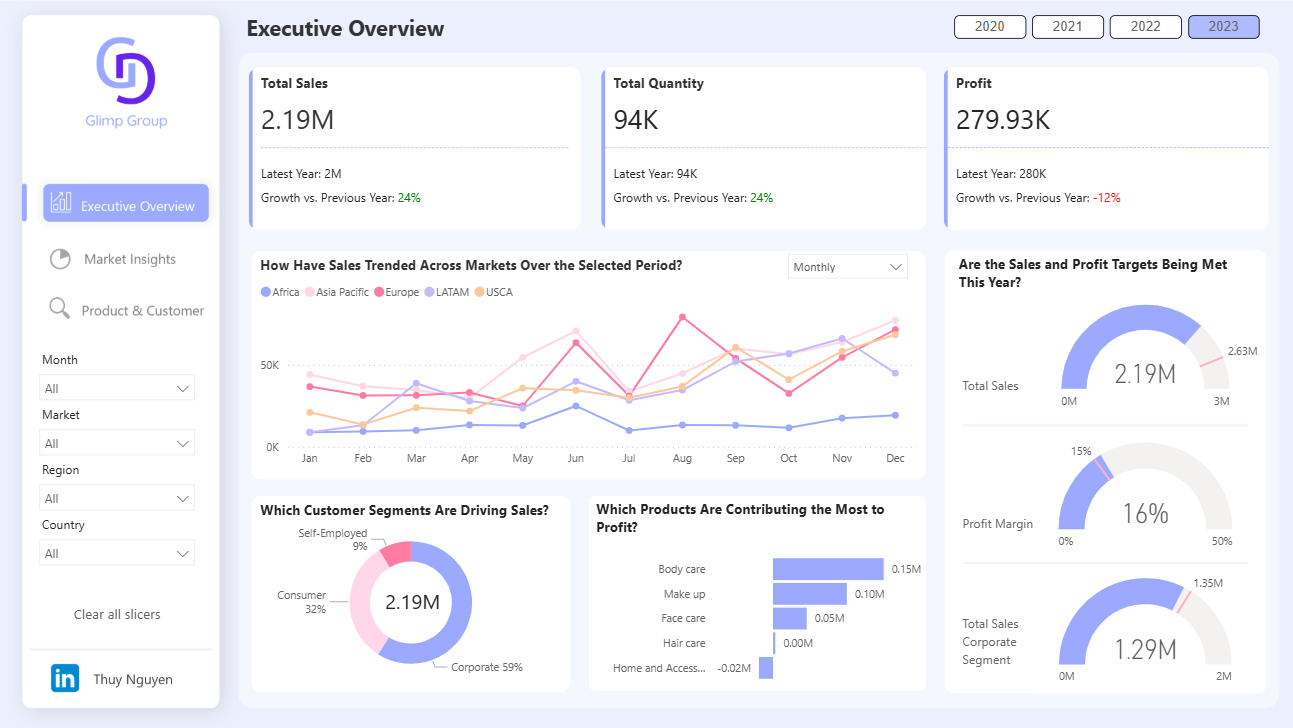
Power BI Executive Overview Dashboard Template — Global Sales & Profit Target Tracking (Free PBIX Download)
 Free Sales & Revenue
Power BI Shark Tank Analytics Dashboard Template (Free PBIX Download)
If you find this website helpful, share it with friends and colleagues to boost their Power BI skills and work efficiency!
Like this site? Share it