Power BI Sales Agents Performance Dashboard Template (Free PBIX Download)
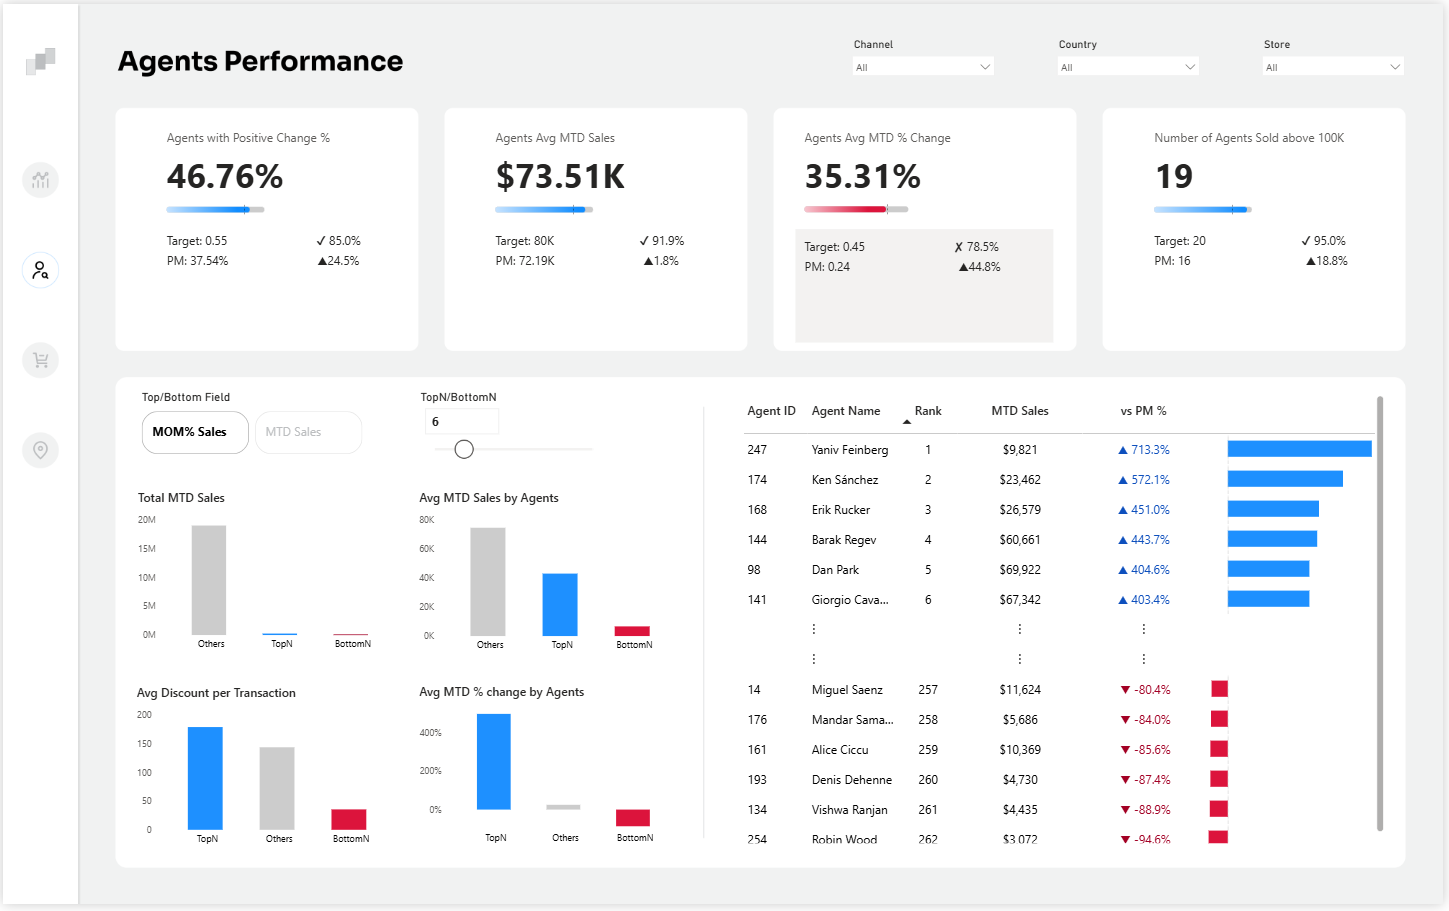
Introduction: This Power BI Agents Performance dashboard tracks 262 sales agents across MTD revenue, MoM growth rates, target attainment, and Top/Bottom N comparative analysis — with dynamic N-selector that lets managers instantly adjust how many top and bottom performers they want to compare. Built for sales operations teams managing large agent networks across multiple channels, countries, and stores, it surfaces both the acceleration leaders and the declining agents in a single view — making it the reference template for retail chains, insurance agencies, and B2B sales organizations running performance management on large distributed teams.
What's Inside This Template
Top KPI Banner — 4 cards with Target, Prior Month (PM), and attainment metrics
| MetricValueTargetAttainmentPMvs PM | |||||
| Agents with Positive Change % | 46.76% | 0.55 (55%) | ✓ 85.0% | 37.54% | ▲24.5% |
| Agents Avg MTD Sales | $73.51K | $80K | ✓ 91.9% | $72.19K | ▲1.8% |
| Agents Avg MTD % Change | 35.31% | 0.45 (45%) | ✗ 78.5% | 0.24 (24%) | ▲44.8% |
| Agents Sold Above $100K | 19 | 20 | ✓ 95.0% | 16 | ▲18.8% |
Four observations from this banner simultaneously:
46.76% agents with positive change — fewer than half the agent base is growing MoM. The target was 55%, and while attainment is 85% of target, the underlying reality is that 53.24% of agents are declining or flat. Combined with only 19 agents selling above $100K (out of 262 total = 7.3%), the portfolio is heavily concentrated in a small high-performing cohort.
$73.51K avg MTD sales at 91.9% of $80K target — close but not there. The $6.49K gap to target across all agents represents significant aggregate revenue: if 262 agents each close that gap, it's $1.7M in additional monthly revenue.
Avg MTD % Change at 35.31% is the one MISSED target (✗ 78.5% attainment vs 45% target) — growth rate is the single underperforming metric. Agents are selling, but not accelerating fast enough. The prior month comparison (24% → 35.31%, ▲44.8%) shows the trend is improving, but not fast enough to close the target gap within this period.
19 agents above $100K vs target of 20 — one agent short of the milestone target. PM was 16, so 3 agents crossed the $100K threshold this month — meaningful progress but not enough to hit the target.
Filters: Channel | Country | Store — three slicers enabling instant segmentation of the full agent leaderboard and comparative charts by any organizational dimension.
Top/Bottom Field Selector: MOM% Sales | MTD Sales — toggles whether the Top N and Bottom N groupings are ranked by growth rate or by absolute revenue. This dual-mode ranking is the most analytically sophisticated UX feature in the dashboard — it allows managers to separate "Who is growing fastest?" from "Who is selling the most?" — two entirely different performance questions.
TopN/BottomN Selector: Set to 6 in this view — adjustable slider that dynamically recomputes all four comparative charts (Total MTD Sales, Avg MTD Sales, Avg Discount per Transaction, Avg MTD % Change) for whatever N the manager selects.
Comparative Charts (TopN vs BottomN vs Others)
Total MTD Sales by Group:
| GroupSales | |
| Others | ~$17M |
| TopN (6) | ~$3M (estimated) |
| BottomN (6) | ~$0M (near zero) |
"Others" (250 agents) generate the majority of total sales — mathematically expected. The top 6 agents generate meaningful but not dominant volume, and the bottom 6 generate near-zero — consistent with the individual leaderboard showing bottom agents at $3K–$11K MTD.
Avg MTD Sales by Agent Group:
| GroupAvg Sales | |
| TopN (6) | ~$65K |
| Others | ~$45K |
| BottomN (6) | ~negative/zero |
The per-agent average gap between TopN (~$65K) and Others (~$45K) is ~$20K — meaningful but not extraordinary. The top agents are not 10x better than average; they are approximately 1.5x better, suggesting the performance distribution is relatively compressed rather than winner-takes-all.
Avg Discount per Transaction:
| GroupAvg Discount | |
| TopN | ~$170 |
| Others | ~$140 |
| BottomN | ~$40 |
Top performers give higher discounts (~$170) than average agents (~$140) and dramatically more than bottom performers (~$40). This is a critical insight for sales management: top agents are closing deals with higher discount authority, not just better sales skills. The question is whether their higher volume justifies the discount margin erosion — or whether discount limits should be tightened to protect margin even from top performers.
Avg MTD % Change by Group:
| GroupAvg MoM% | |
| TopN | ~400%+ |
| Others | ~flat/near-zero |
| BottomN | ~negative |
The TopN % change chart shows an extraordinary ~400%+ MoM growth for the top 6 agents — driven entirely by Yaniv Feinberg (+713.3%) and the other top-ranked agents with 400–572% growth. This extreme MoM% is almost certainly a base effect: agents who had very low or zero sales last month now have any sales this month, producing inflated percentage growth. A $100 → $800 sale is +700% MoM. The leaderboard confirms this — Yaniv Feinberg at Rank 1 with only $9,821 MTD sales having the highest MoM% (713.3%) while Rank 4 (Barak Regev, $60,661) has "only" 443.7%.
Agent Leaderboard (Top 6 and Bottom 6 visible)
Top 6 by MoM% Sales:
| Agent IDNameRankMTD Salesvs PM % | ||||
| 247 | Yaniv Feinberg | 1 | $9,821 | ▲713.3% |
| 174 | Ken Sánchez | 2 | $23,462 | ▲572.1% |
| 168 | Erik Rucker | 3 | $26,579 | ▲451.0% |
| 144 | Barak Regev | 4 | $60,661 | ▲443.7% |
| 98 | Dan Park | 5 | $69,922 | ▲404.6% |
| 141 | Giorgio Cava... | 6 | $67,342 | ▲403.4% |
Bottom 6 by MoM% Sales (Ranks 257–262):
| Agent IDNameRankMTD Salesvs PM % | ||||
| 14 | Miguel Saenz | 257 | $11,624 | ▼-80.4% |
| 176 | Mandar Sama... | 258 | $5,686 | ▼-84.0% |
| 161 | Alice Ciccu | 259 | $10,369 | ▼-85.6% |
| 193 | Denis Dehenne | 260 | $4,730 | ▼-87.4% |
| 134 | Vishwa Ranjan | 261 | $4,435 | ▼-88.9% |
| 254 | Robin Wood | 262 | $3,072 | ▼-94.6% |
Robin Wood at -94.6% MoM — from prior month sales to $3,072 this month, representing a near-complete sales collapse. This level of decline is not a performance dip; it is a crisis signal — account loss, health issue, territory problem, or disengagement. At -94.6%, Robin Wood sold approximately $55K last month and only $3K this month.
Key Insights
- MoM% ranking is a base-effect trap for this leaderboard. Yaniv Feinberg ranks #1 by MoM% at 713.3% but generates only $9,821 in MTD sales — less than Robin Wood's estimated prior month performance. Ranking agents by MoM% without a minimum volume threshold promotes agents recovering from near-zero bases over genuinely high-performing agents. Dan Park (Rank 5, $69,922, +404.6%) and Giorgio Cava (Rank 6, $67,342, +403.4%) are the more strategically valuable performers: high absolute volume AND high growth rate simultaneously. The MTD Sales toggle exists precisely to correct this — managers should use both views together, not independently.
- Top performers give 4.25x more average discount than bottom performers ($170 vs $40) — discount authority is driving the performance gap more than sales skill. If bottom performers had access to $170 average discounts, would their close rates improve proportionally? If yes, the discount policy is the primary performance barrier, not talent. If no, the top agents are combining discount authority with better qualification and pipeline management. This is the most operationally important question this dashboard raises — and it requires a discount-to-close-rate analysis the dashboard doesn't yet show.
- Robin Wood at -94.6% and Denis Dehenne at -87.4% require immediate management intervention — not performance improvement plans. Declines of this magnitude in a single month indicate a specific acute problem (account lost, personal crisis, territory disruption), not a gradual performance trend. Standard PIP processes are the wrong response; the right response is a direct manager conversation within 24 hours of seeing this data.
- Only 19 agents above $100K MTD (7.3% of 262) generating significant revenue concentration risk. If even 5 of these 19 agents churn to competitors next month, the portfolio loses a disproportionate share of high-value revenue. Agent retention investment should be concentrated almost entirely on this cohort — not spread evenly across all 262 agents. The cost of replacing one $100K+ agent (recruiting, onboarding, ramp time) vastly exceeds the cost of retention incentives.
- 46.76% agents with positive MoM change — despite the 35.31% average MoM growth — means a small number of extreme growers (Yaniv Feinberg at +713%) are pulling the average well above median. If fewer than half of agents are growing, the median MoM change is likely flat or slightly negative. The average is being skewed by base-effect recoveries. A more useful metric for portfolio health is the median MoM change across all 262 agents — if it's negative or near-zero while the average is +35%, the portfolio has a concentration-of-growth problem that aggregate metrics are hiding.
- The dynamic N-selector is the highest-value UX feature in this dashboard and the primary differentiator from static leaderboards. Setting N=6 shows the extreme tails; setting N=20 or N=30 shows whether the performance gap between top and bottom is driven by a handful of outliers or a structural two-tier distribution. Managers should be trained to use different N values for different decisions: N=5 for individual coaching conversations, N=20 for territory reallocation decisions, N=50 for incentive plan redesign.
Who This Template Is For
- Sales Directors and Regional Sales Managers running large distributed agent networks (262+ agents) across retail chains, insurance agencies, financial services distribution, or B2B sales organizations who need weekly MTD performance ranking with MoM variance — replacing manual Excel leaderboards with a live, filterable Power BI agent scorecard
- Sales Operations Analysts building agent performance reporting that identifies acceleration leaders vs declining agents simultaneously, tracks target attainment at both individual and portfolio level, and monitors discount behavior by performance tier
- BI Developers building sales performance management systems who need a production-ready template with dynamic Top/Bottom N comparison, dual-mode ranking toggle (MoM% vs MTD absolute), multi-metric KPI cards with target and PM comparison, and a full agent leaderboard with sparkline-style variance bars
How to Use
- Download the PBIX file
- Open in Power BI Desktop
- Connect your sales transactions data source — the model requires an agent transactions table with agent ID, agent name, transaction date, sale amount, discount amount, channel, country, and store fields; target values require a separate targets table linked by agent ID and period
- Use the Channel, Country, and Store slicers to filter the entire dashboard to any segment; adjust the TopN/BottomN slider to dynamically resize the comparison groups; toggle between MOM% Sales and MTD Sales to switch ranking mode across all comparative charts simultaneously
"The agent leaderboard in this dashboard is a native Power BI table. To display all 262 agents in a structured, sortable table with expandable team hierarchies, MTD vs target variance columns per agent, and conditional formatting flagging at-risk agents by MoM decline threshold — Flexa Tables is a Microsoft-certified Power BI visual purpose-built for structured sales agent performance reporting with full drill-down and formatting control."
Other Templates
 Free Sales & Revenue
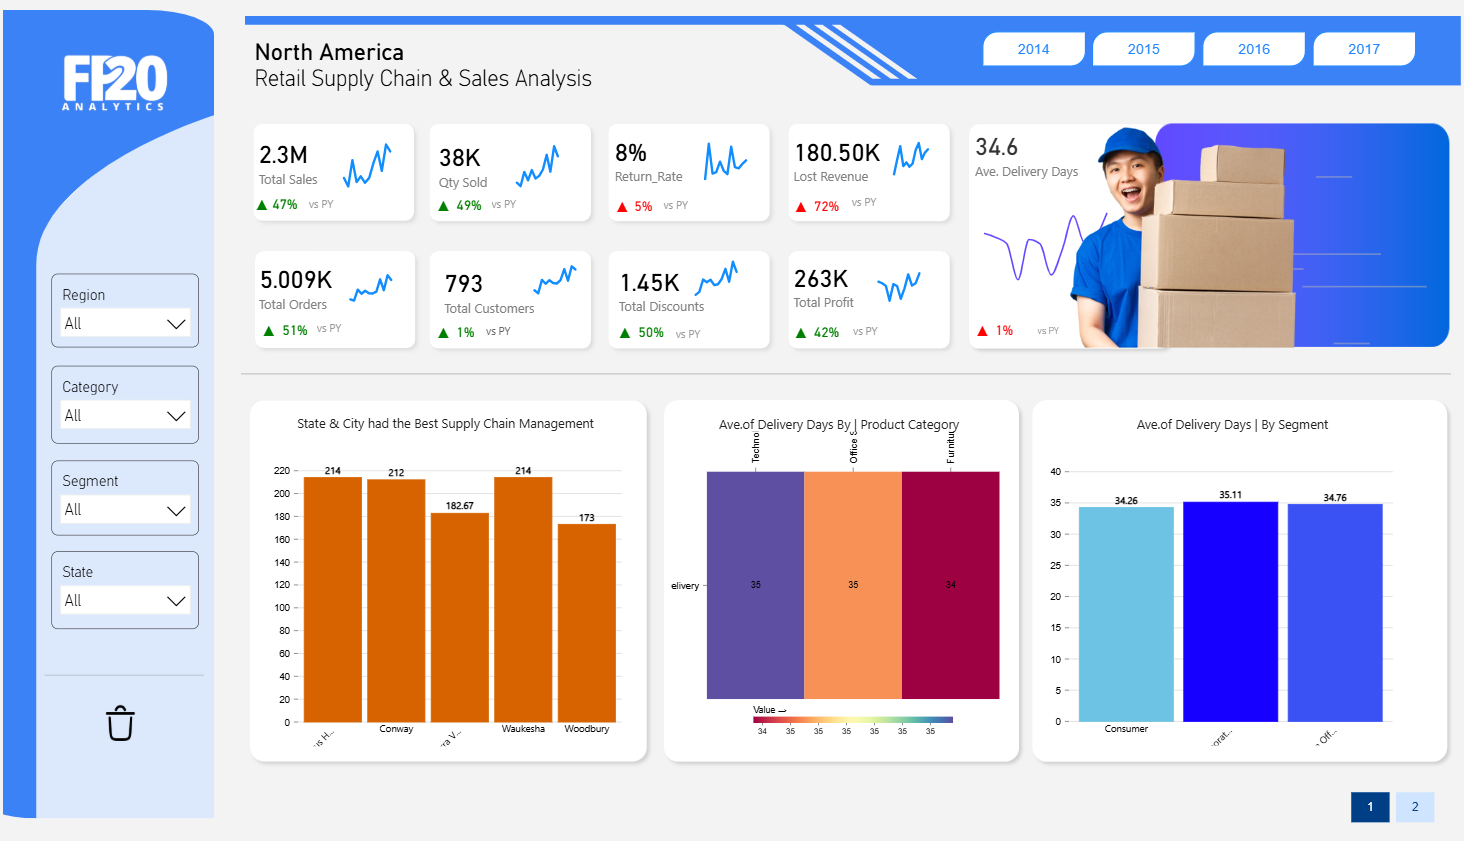
Retail Supply Chain & Sales Analysis dashboard
 Free Sales & Revenue
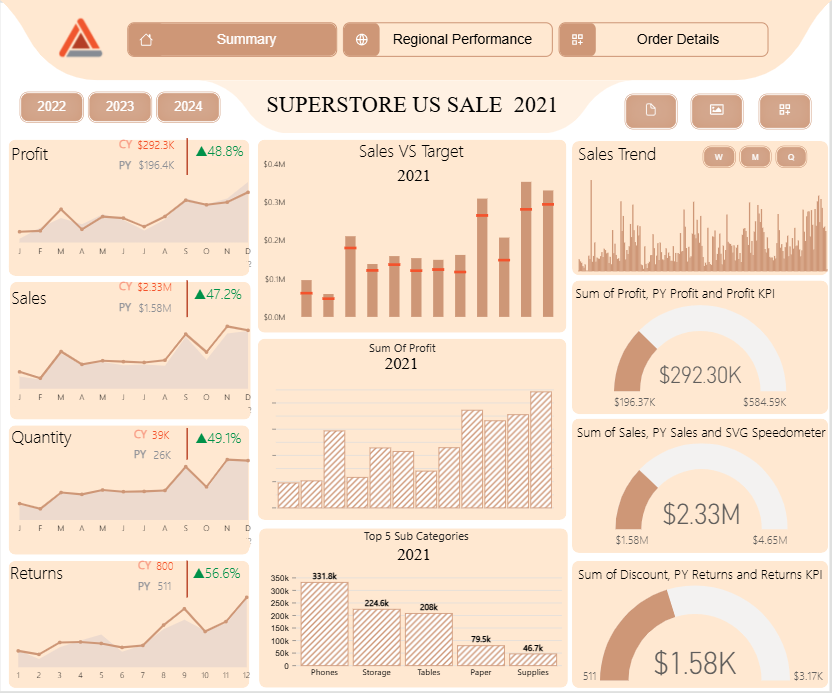
Superstore US Sale
 Free Sales & Revenue
Power BI Executive Overview Dashboard Template — Global Sales & Profit Target Tracking (Free PBIX Download)
If you find this website helpful, share it with friends and colleagues to boost their Power BI skills and work efficiency!
Like this site? Share it