Power BI Movie Analytics Dashboard Template — TMDB Dataset (Free PBIX Download)
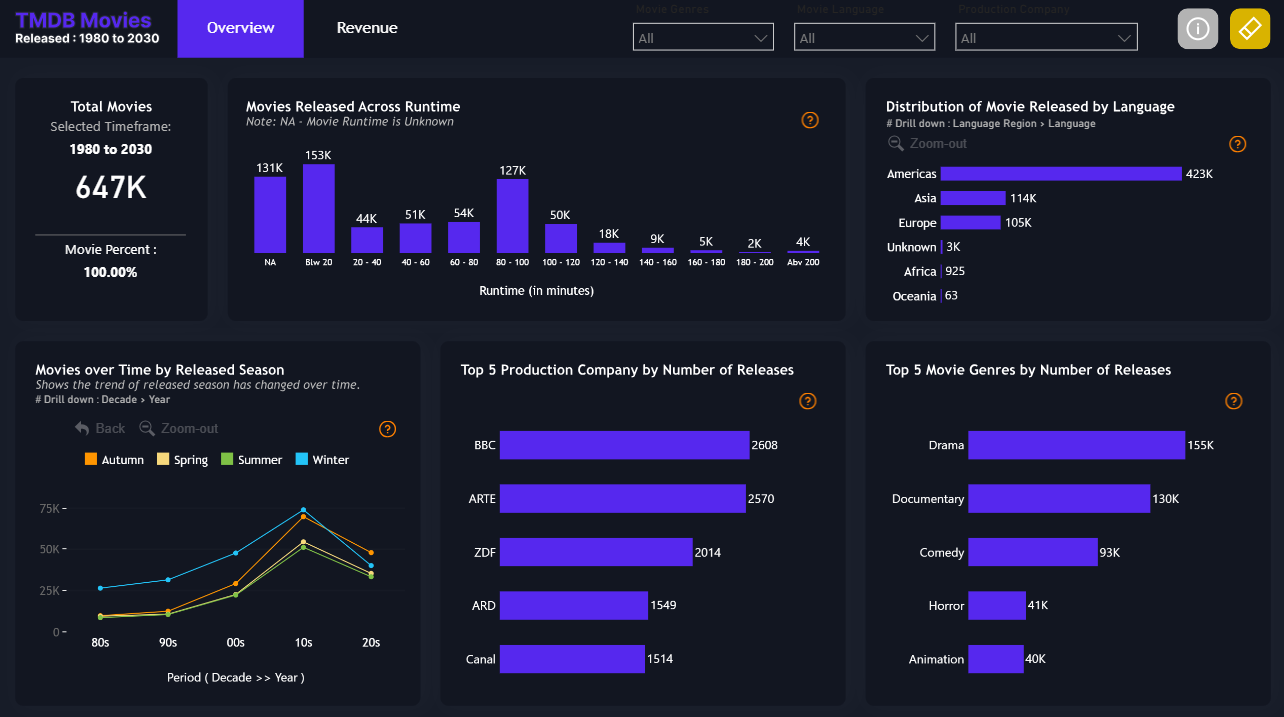
Introduction: This Power BI dashboard analyzes 647,000 movies from the TMDB (The Movie Database) dataset spanning 1980 to 2030. Unlike finance or HR dashboards, this template demonstrates Power BI's capability on large entertainment datasets — making it a strong reference for analysts working with media, content catalogs, or any high-volume categorical data. The Overview page shown here covers distribution by runtime, language region, production company, genre, and seasonal release patterns across five decades.
What's Inside This Template
Total Movies KPI
- 647K total movies across the selected timeframe (1980–2030)
- Filters available: Movie Genre, Movie Language, Production Company — all set to "All" in this view
- Two-tab structure: Overview (volume/distribution analysis) and Revenue (monetization analysis)
Movies Released Across Runtime
The runtime distribution reveals a clear industry standard:
| Runtime BucketCount | |
| NA (unknown) | 131K |
| Below 20 min | 153K |
| 20–40 min | 44K |
| 40–60 min | 51K |
| 60–80 min | 54K |
| 80–100 min | 127K |
| 100–120 min | 50K |
| 120–140 min | 18K |
| 140–160 min | 9K |
| 160–180 min | 5K |
| 180–200 min | 2K |
| Above 200 min | 4K |
Three key observations:
- "Below 20 min" is the single largest known-runtime bucket at 153K — this reflects the dominance of short-form content (shorts, episodes, web series) in the TMDB catalog, not just theatrical features
- 80–100 min is the dominant feature-length bucket at 127K — confirming the industry standard for theatrical runtime sits squarely in this range
- 131K entries have no runtime data (NA) — 20% of the dataset has missing runtime, which is a data quality signal relevant for analysts planning to filter on runtime
Distribution of Movie Released by Language Region
| RegionCount | |
| Americas | 423K |
| Asia | 114K |
| Europe | 105K |
| Unknown | 3K |
| Africa | 925 |
| Oceania | 63 |
The Americas dominance (65% of all releases) reflects both Hollywood volume and the TMDB platform's English-language user base driving more entries for American content. Asia (114K) and Europe (105K) are nearly equal — surprising given Europe has more countries but Asia has larger individual film industries (Bollywood, South Korean, Japanese cinema). Africa (925) and Oceania (63) are severely underrepresented — a data coverage gap, not a true reflection of production volume in those regions.
The drill-down capability (Language Region → Language) allows users to break Americas into English, Spanish, Portuguese sub-segments for deeper analysis.
Movies over Time by Released Season (1980s–2020s)
Four seasonal release lines tracked by decade:
- Winter (cyan) peaks sharply in the 2010s at ~75K — the dominant release season by volume, driven by holiday blockbuster strategy and streaming platform content dumps in Q1
- Spring (yellow) and Summer (green) grow steadily, converging around 50K in the 2010s, then both declining in the 2020s
- Autumn (orange) is consistently the lowest season across all decades, dipping further in the 2020s to ~37K
The 2020s decline across all seasons is the most significant pattern — likely reflecting COVID-19's impact on theatrical releases in 2020–2021 compressing total release counts for the decade so far (the dataset likely captures incomplete 2020s data since the decade isn't finished).
The drill-down from Decade to Year allows analysts to identify which specific years drove the seasonal peaks.
Top 5 Production Companies by Number of Releases
| CompanyReleases | |
| BBC | 2,608 |
| ARTE | 2,570 |
| ZDF | 2,014 |
| ARD | 1,549 |
| Canal+ | 1,514 |
This ranking is dominated entirely by European public broadcasters — BBC (UK), ARTE (France/Germany), ZDF (Germany), ARD (Germany), Canal+ (France). Hollywood studios are absent from the top 5 entirely. This is a dataset artifact: public broadcasters produce enormous volumes of TV content cataloged in TMDB, while studios like Disney or Warner Bros. produce fewer but higher-revenue titles. This chart measures volume, not revenue or cultural impact — a distinction the Revenue tab likely addresses.
Top 5 Movie Genres by Number of Releases
| GenreCount | |
| Drama | 155K |
| Documentary | 130K |
| Comedy | 93K |
| Horror | 41K |
| Animation | 40K |
Drama (155K) and Documentary (130K) together account for 285K releases — 44% of the entire 647K catalog. This reflects both the low production cost of documentary content and Drama's universal appeal across markets and languages. Horror (41K) and Animation (40K) are nearly tied despite vastly different production budgets — Horror is a high-volume, low-budget genre while Animation is low-volume, high-cost, indicating these numbers represent fundamentally different business models.
Key Insights
- Short-form content dominates by volume — the "Below 20 min" bucket (153K) is larger than any feature-length category, meaning TMDB is a catalog of all screen content, not just movies. Analysts filtering for cinematic features should apply a runtime filter of 60+ minutes to get a cleaner dataset.
- Americas produces 4x more catalog entries than Asia or Europe combined — but this is a platform bias, not a true production volume ratio. Bollywood alone produces 1,500–2,000 films annually; the undercount suggests TMDB coverage of non-English content has room to grow.
- European public broadcasters own the top production company rankings — anyone expecting Netflix, Disney, or Universal in the top 5 will be surprised. This is the most counterintuitive finding in the dashboard and reflects how TMDB categorizes TV content ownership.
- Winter releases surged in the 2010s and then fell in the 2020s — the streaming era initially intensified the holiday release window, but platform content now releases year-round without seasonal strategy, flattening the seasonal distribution curve.
- Drama + Documentary = 44% of all content — the long tail of low-budget, high-volume genres dwarfs the high-budget genres (Action, Sci-Fi, Animation) that generate most revenue. The Revenue tab is essential for correcting this volume-vs-value perception gap.
- 20% missing runtime data is a realistic data quality challenge that analysts will recognize immediately — making this dashboard a useful teaching tool for Power BI data modeling with incomplete datasets.
Who This Template Is For
- Data Analysts and BI Developers looking for a large, complex, real-world dataset to practice Power BI modeling, DAX, and visualization design
- Media and Entertainment analysts building content catalog reports for streaming platforms, distributors, or production companies
- Students and Power BI learners who want a visually rich, non-corporate dataset to experiment with filters, drill-downs, and cross-tab interactions
How to Use
- Download the PBIX file
- Open in Power BI Desktop
- Data is embedded from the TMDB public dataset — no connection setup required
- Use the Genre, Language, and Production Company slicers to filter all visuals simultaneously
- Drill down from Decade to Year in the seasonal chart, and from Language Region to Language in the distribution chart
Soft CTA:
"Want to display your content catalog data in a structured, sortable table with conditional formatting and expandable categories? Flexa Tables is a Microsoft-certified Power BI visual built for exactly this kind of multi-level tabular reporting."
Other Templates
 Free Other / General
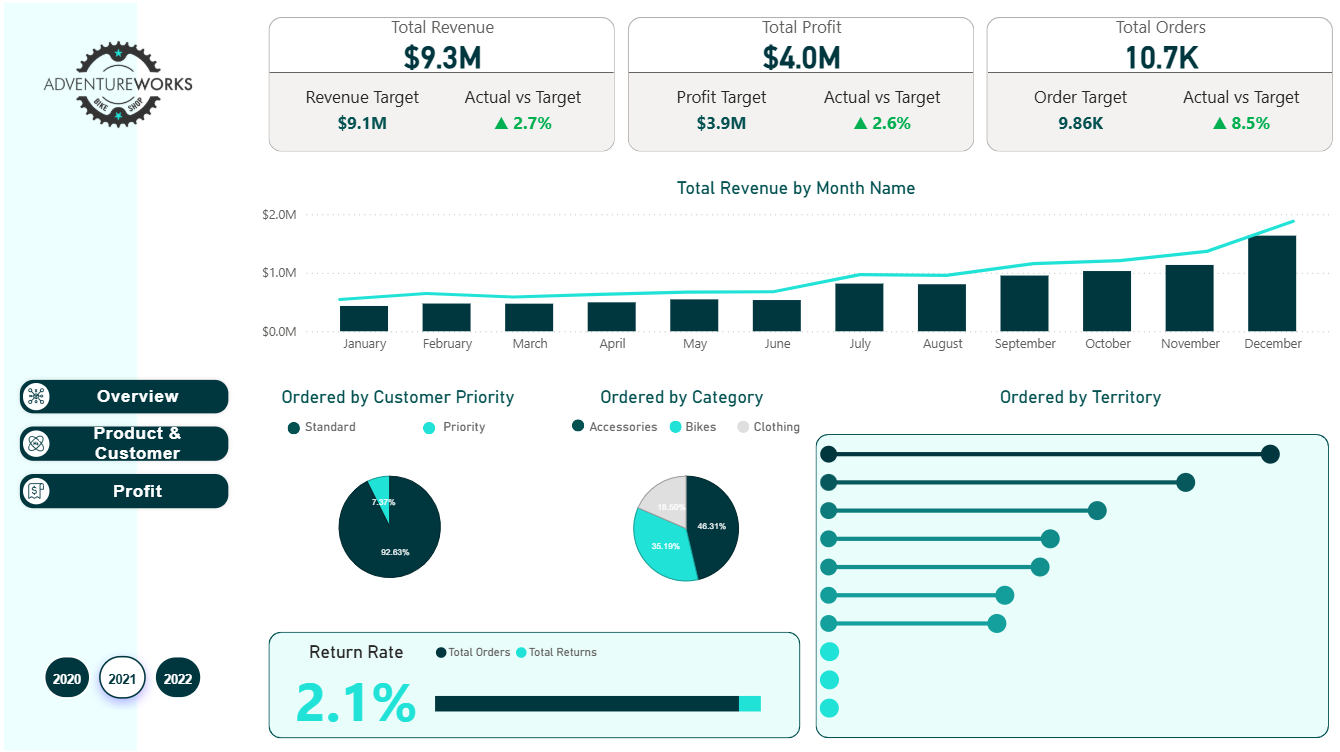
Adventure Works Report
 Free Other / General
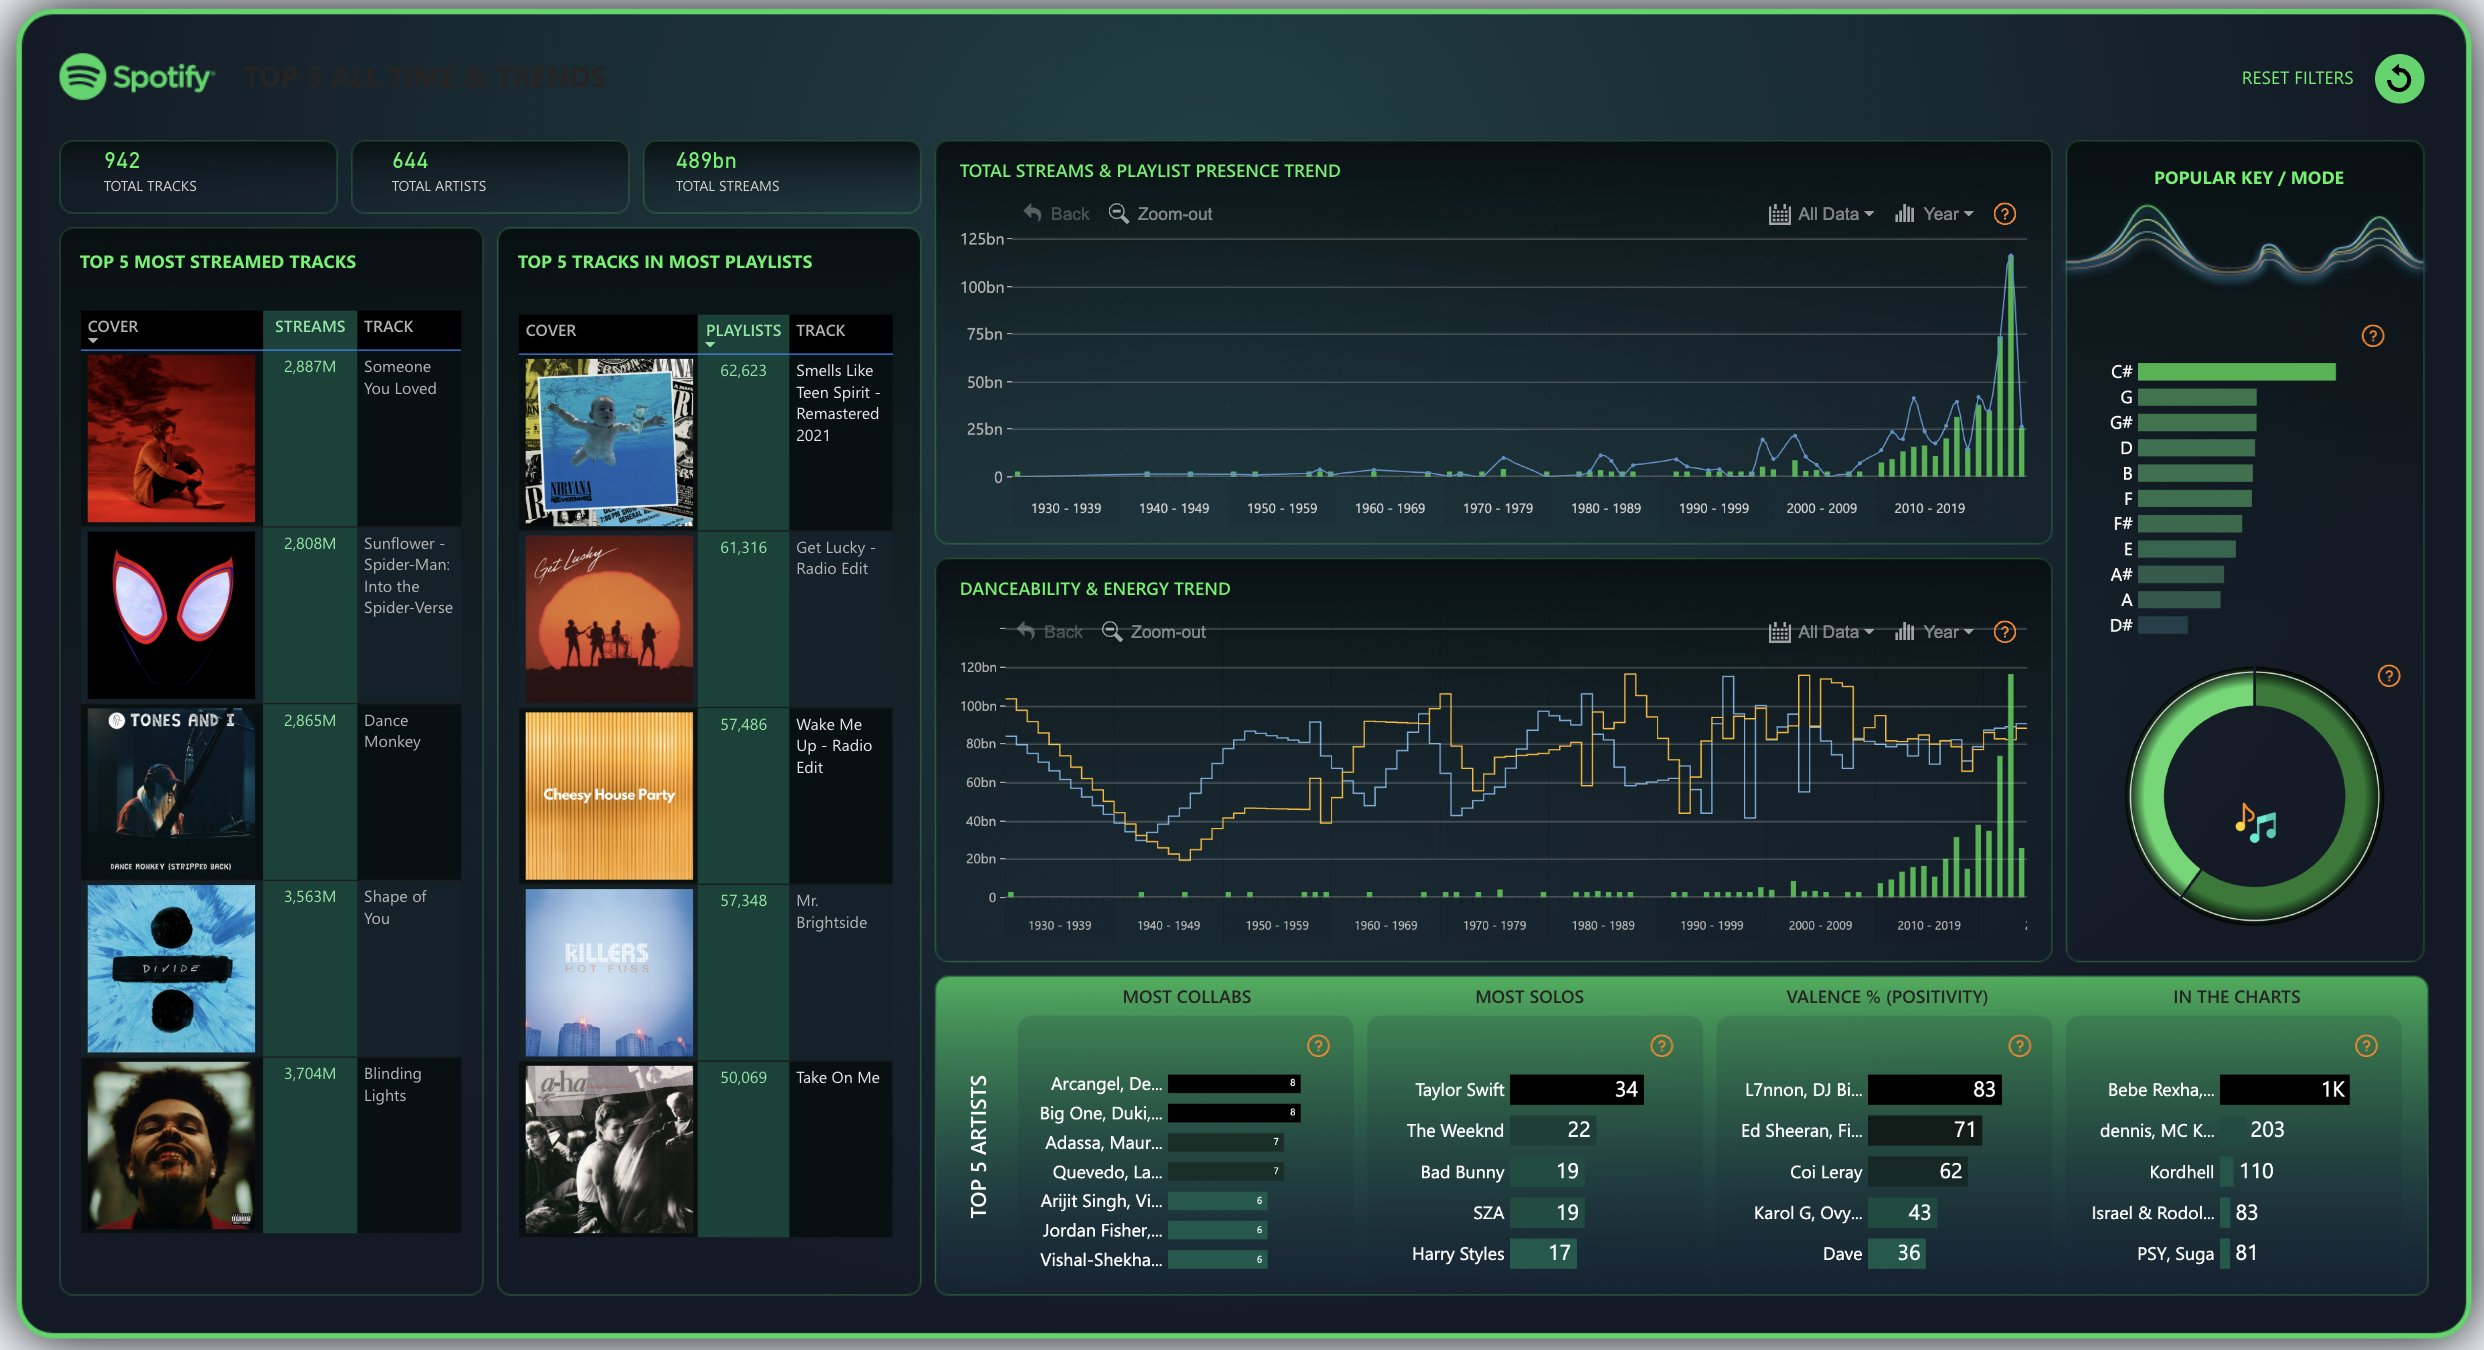
Power BI Spotify Music Analytics Dashboard Template (Free PBIX Download)
 Free Other / General
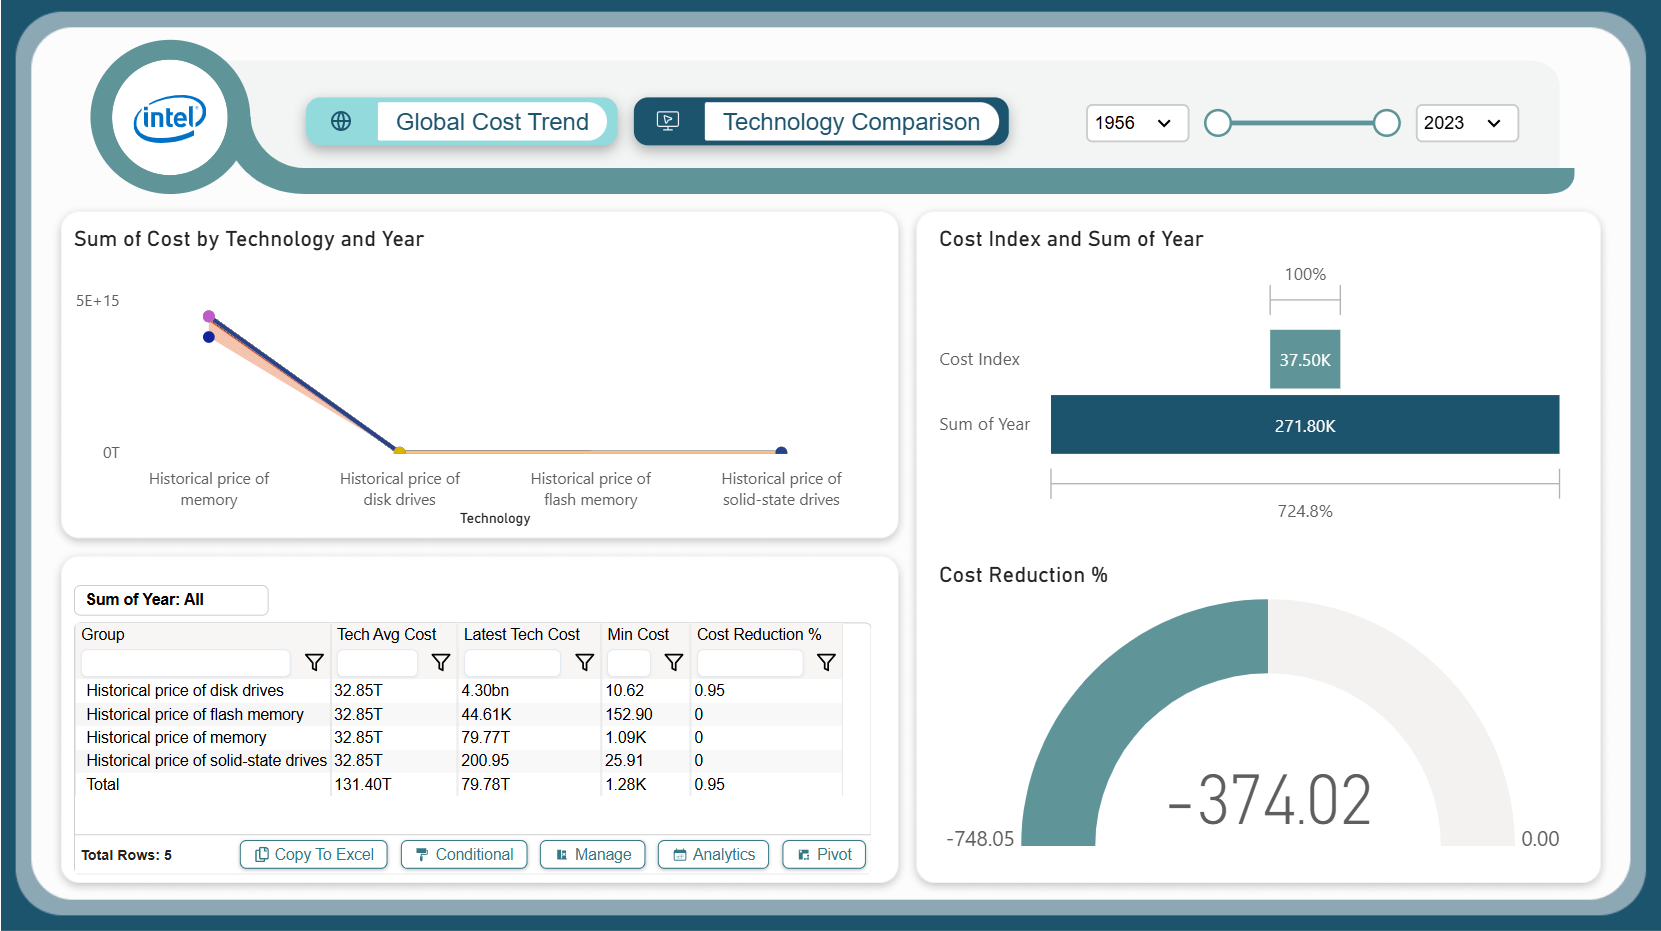
Intel Storage Cost Trends Dashboard – Key Insights (1956–2023)
If you find this website helpful, share it with friends and colleagues to boost their Power BI skills and work efficiency!
Like this site? Share it