Power BI Marketing Campaign Analysis Dashboard Template (Free PBIX Download)
Introduction
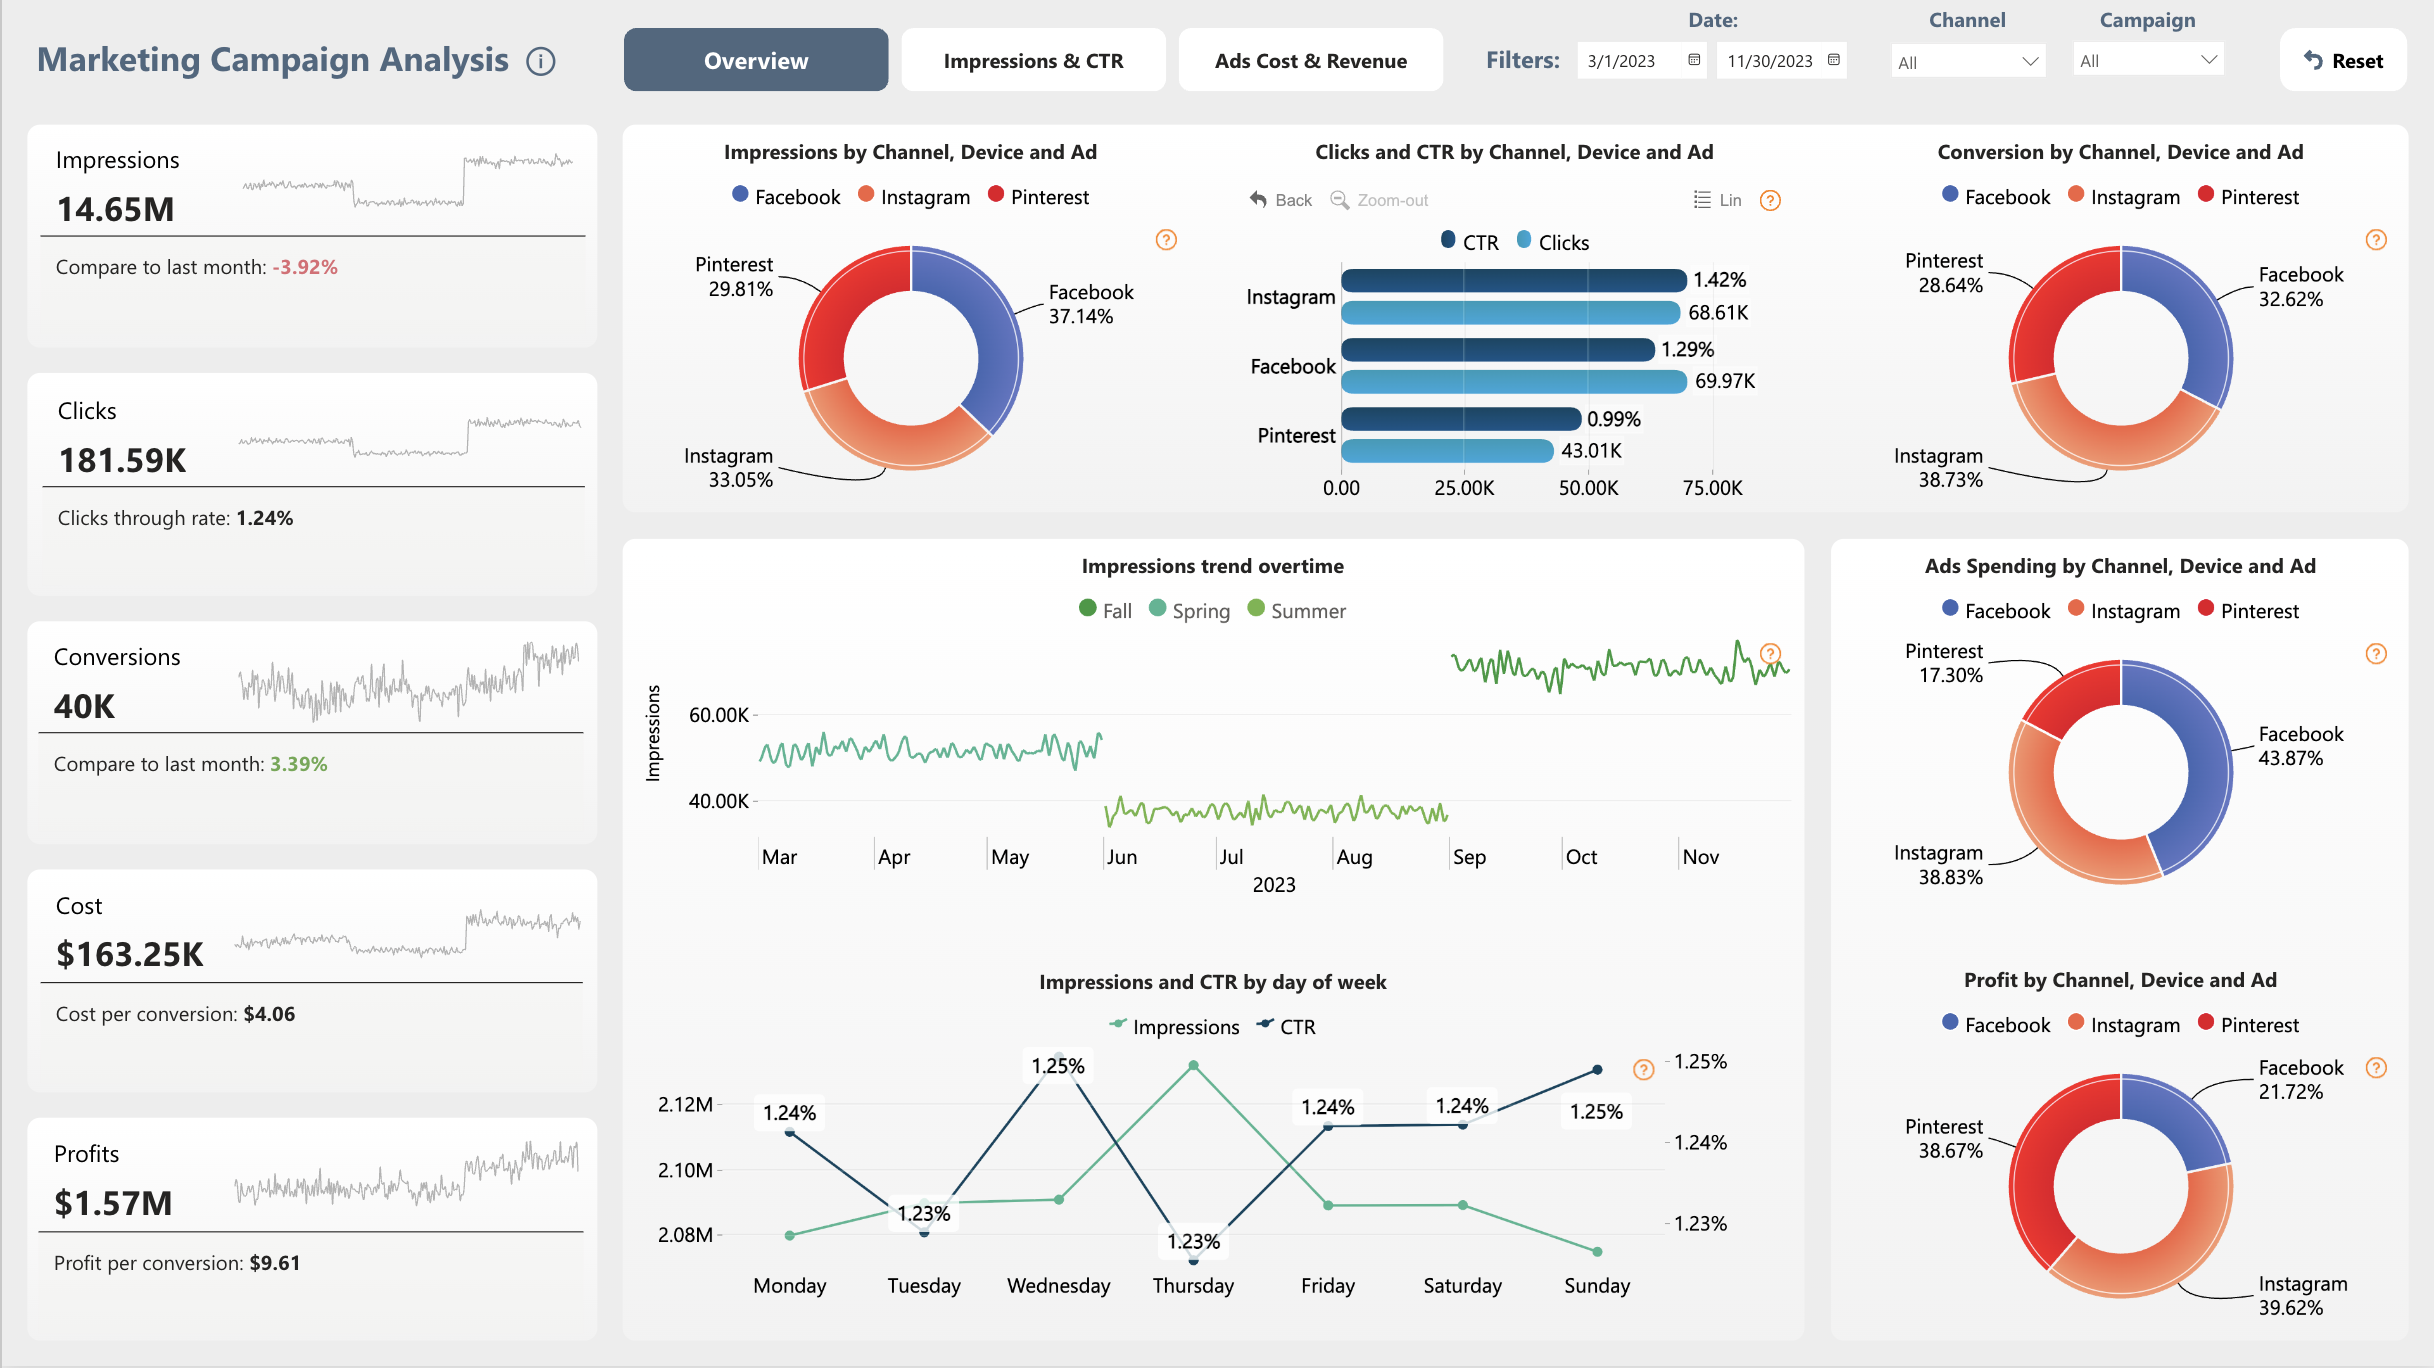
This Power BI dashboard analyzes paid marketing campaign performance across Facebook, Instagram, and Pinterest for March–November 2023, covering 14.65M impressions, 181.59K clicks, 40K conversions, and $1.57M in profit on $163.25K in ad spend. It is built for Digital Marketing Managers, Performance Marketers, and CMOs who need a single-view comparison of channel efficiency, spend allocation, and conversion economics across platforms. The three-tab structure — Overview, Impressions & CTR, and Ads Cost & Revenue — enables both executive summary and deep-dive campaign analysis without switching tools.
What's Inside This Template
KPI Sidebar — Five Core Metrics with MoM Trend Sparklines
| MetricValueContext | ||
| Impressions | 14.65M | −3.92% vs last month |
| Clicks | 181.59K | CTR: 1.24% |
| Conversions | 40K | +3.39% vs last month |
| Cost | $163.25K | Cost per conversion: $4.06 |
| Profits | $1.57M | Profit per conversion: $9.61 |
Each KPI includes a sparkline showing trend direction — a fast visual cue for whether momentum is accelerating or decelerating before reading the full charts.
Impressions by Channel, Device and Ad (Donut)
| ChannelImpressions Share | |
| 37.14% | |
| 33.05% | |
| 29.81% |
Facebook leads on raw reach, but at roughly equal distribution across three channels, no platform dominates visibility to a degree that creates lock-in risk.
Clicks and CTR by Channel, Device and Ad (Bar Chart)
| ChannelCTRClicks | ||
| 1.42% | 68.61K | |
| 1.29% | 69.97K | |
| 0.99% | 43.01K |
Despite Facebook's larger impression share, Instagram achieves a higher CTR (1.42% vs 1.29%), generating nearly identical click volume with fewer impressions. Pinterest lags both on CTR but, as the profit analysis reveals, converts more economically.
Conversion by Channel, Device and Ad (Donut)
| ChannelConversion Share | |
| 38.73% | |
| 32.62% | |
| 28.64% |
Instagram leads on conversions despite receiving less spend than Facebook — a direct efficiency signal.
Impressions Trend Overtime (Line Chart, Mar–Nov 2023, by Season)
| SeasonImpression Band | |
| Fall | ~60K (highest) |
| Spring | ~45K (mid) |
| Summer | ~40K (lowest) |
Fall campaigns significantly outperform both Spring and Summer in raw impression delivery, likely due to Q4 budget increases and seasonal demand alignment. The gap between Fall and Summer (~50% higher) suggests significant seasonality that should drive budget scheduling decisions.
Impressions and CTR by Day of Week (Dual-Line Chart)
| DayImpressionsCTR | ||
| Monday | 2.12M | 1.24% |
| Tuesday | 2.08M | 1.23% |
| Wednesday | ~2.09M | 1.25% |
| Thursday | ~2.10M | 1.23% |
| Friday | ~2.10M | 1.24% |
| Saturday | ~2.11M | 1.24% |
| Sunday | ~2.09M | 1.25% |
The inverse relationship between impressions and CTR is visible on Tuesday (highest impressions → lowest CTR) and Wednesday/Sunday (lower impressions → peak CTR 1.25%). Higher volume days dilute engagement quality — a classic reach vs relevance tradeoff.
Ads Spending by Channel (Donut)
| ChannelSpend Share | |
| 43.87% | |
| 38.83% | |
| 17.30% |
Profit by Channel, Device and Ad (Donut)
| ChannelProfit Share | |
| 39.62% | |
| 38.67% | |
| 21.72% |
Key Insights
- Pinterest is 4.5× more profit-efficient per ad dollar than Facebook — yet receives less than half the budget. Pinterest captures 38.67% of total profit on only 17.30% of spend (efficiency ratio: 2.24×). Facebook captures just 21.72% of profit on 43.87% of spend (efficiency ratio: 0.50×). Reallocating even 10 percentage points of Facebook budget to Pinterest would, at current ratios, materially increase total profit without increasing total spend.
- Conversions grew +3.39% MoM while impressions declined −3.92% — the campaign is becoming more efficient, not just scaling down. This divergence means the audience targeting or creative quality improved: fewer eyeballs converted at a higher rate. This is the ideal optimization trajectory, and the Impressions & CTR tab should be used to identify which specific channel or ad type drove this improvement.
- Instagram is the only channel achieving efficiency parity across all three metrics. It ranks #1 in CTR (1.42%), #1 in conversions (38.73%), and #1 in profit share (39.62%), while receiving the middle budget allocation (38.83%). No other channel closes the loop from click engagement to profit dominance — making Instagram the highest-confidence channel for incremental spend.
- Monday delivers the highest impression volume (2.12M) but Wednesday and Sunday deliver the best CTR (1.25% each) — these days should not receive the same creative or budget treatment. Running awareness-oriented campaigns on Monday and conversion-focused creatives on Wednesday/Sunday would align budget to the audience behavior pattern already visible in the data.
- Fall campaigns deliver ~50% more impressions than Summer campaigns — but whether they deliver proportionally more conversions is the critical unanswered question. If Summer campaigns convert at a higher rate despite lower impressions (possible given the tighter audience in off-peak periods), Summer is underinvested. The Ads Cost & Revenue tab, filtered by season, would confirm this directly.
- At $4.06 cost per conversion and $9.61 profit per conversion, the blended ROAS multiple is 2.37× — but Facebook's underperformance is dragging the average down. If Facebook's profit efficiency matched even Instagram's level, total profit would expand significantly without increasing spend. The current blended figure masks a wide performance spread that demands channel-level budget rebalancing.
Who This Template Is For
- Performance Marketing Managers who need a channel-by-channel breakdown of CTR, conversion rate, and profit contribution to make weekly bid and budget decisions backed by actual platform data rather than platform-native dashboards that each report their own metrics in isolation.
- CMOs and Marketing Directors who need a single executive-facing view of campaign ROI across all paid social channels for March–November 2023, including MoM trend direction on impressions, conversions, and profit without manually reconciling three different ad platforms.
- Media Planners and Paid Social Strategists who are building the Q1 budget allocation and need a historical baseline showing which channels (Pinterest, Instagram) deliver outsized profit per dollar spent versus which (Facebook) are consuming the largest share of budget at the lowest return.
How to Use
- Download the PBIX file from the Flexa Intel gallery.
- Open in Power BI Desktop and navigate to the data model to review the table structure (typically: campaign fact table with impressions, clicks, conversions, cost, and revenue columns, plus a channel/platform dimension).
- Connect your data source — most commonly a flat CSV or Excel export from Meta Ads Manager, Pinterest Analytics, or a unified marketing data warehouse (e.g., Google BigQuery, Snowflake, or a Supermetrics feed).
- All visuals — KPI cards, donut charts, the seasonal trend line, and the day-of-week analysis — update automatically once your source data is refreshed.
The donut charts in this template are excellent for share-of-total comparisons, but they make it hard to simultaneously compare absolute spend, absolute profit, efficiency ratios, and MoM variance across all three channels in a single view. Flexa Tables is a Microsoft-certified Power BI custom visual that adds a structured, sortable table with conditional formatting by performance tier — letting you flag Facebook's 0.50× profit efficiency ratio in red and Pinterest's 2.24× in green at a glance, with full drill-down from channel to device to individual ad creative.
Other Templates
 Free Sales & Revenue
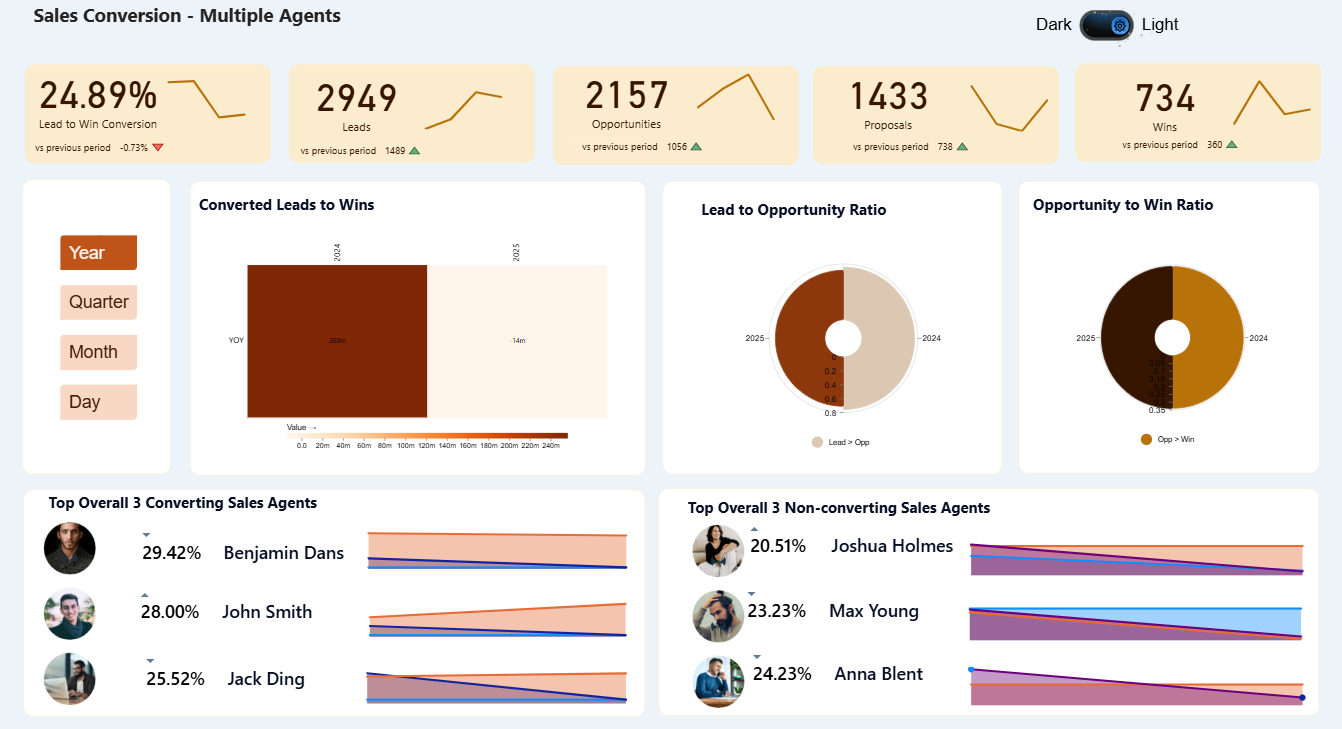
Sales Conversion – Multiple Agents Dashboard
 Free Marketing
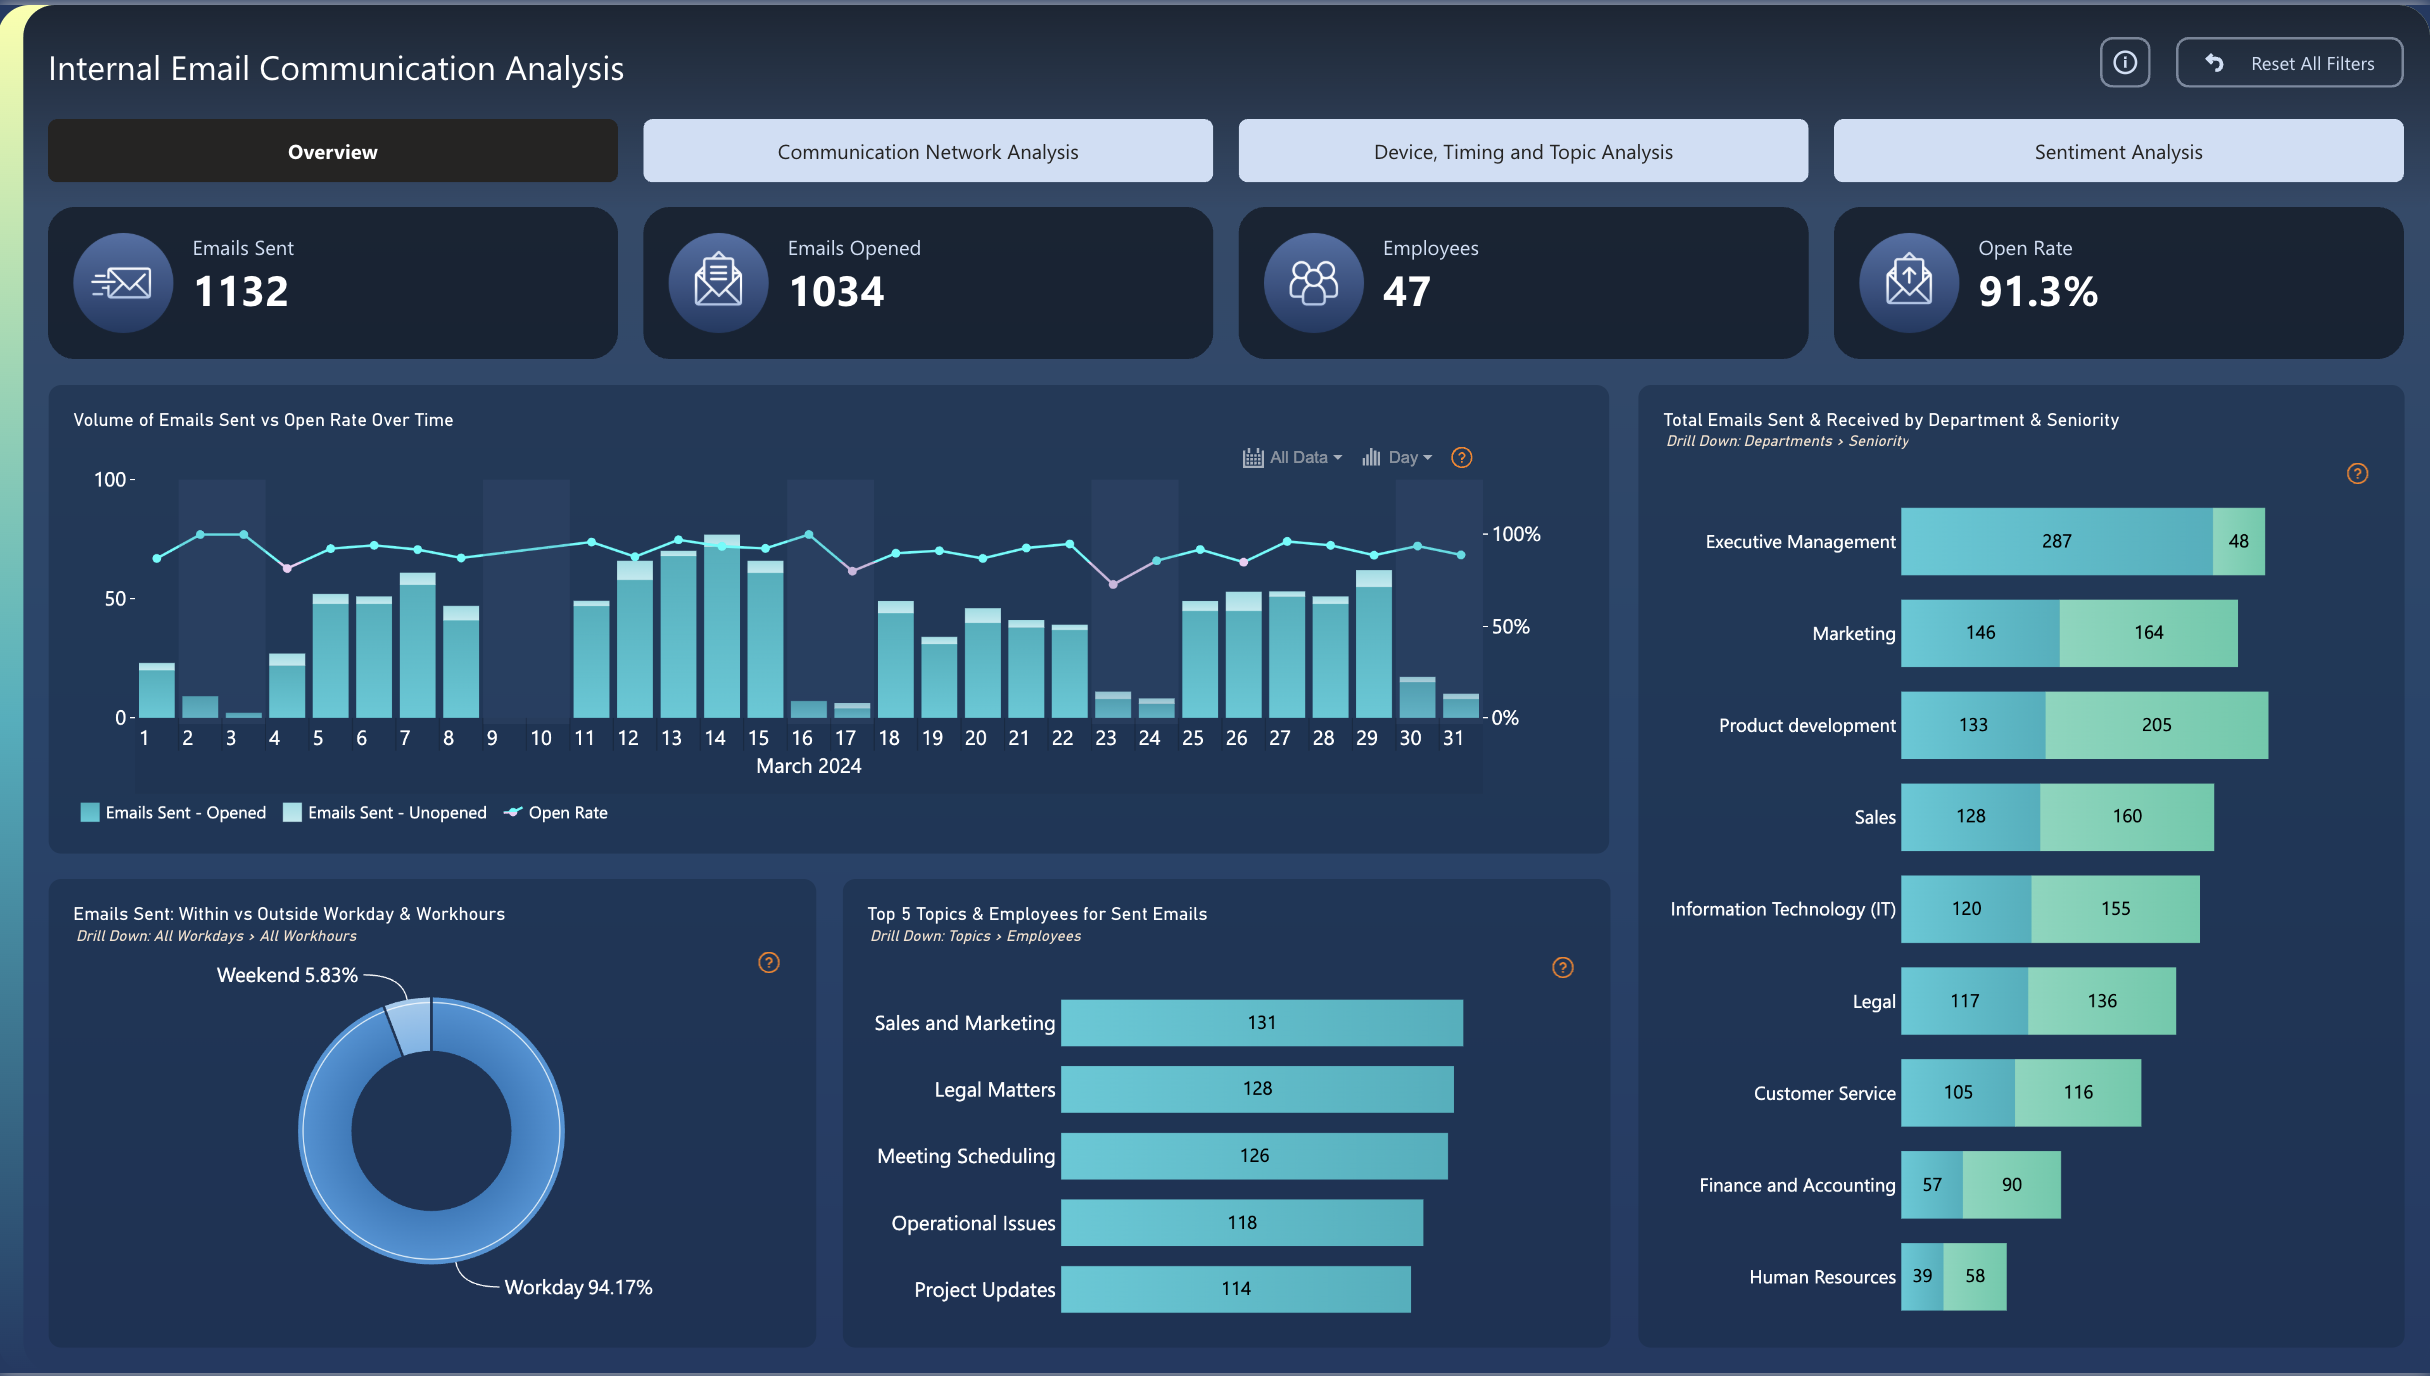
Power BI Internal Email Communication Dashboard Template (Free PBIX Download)
 Free Marketing
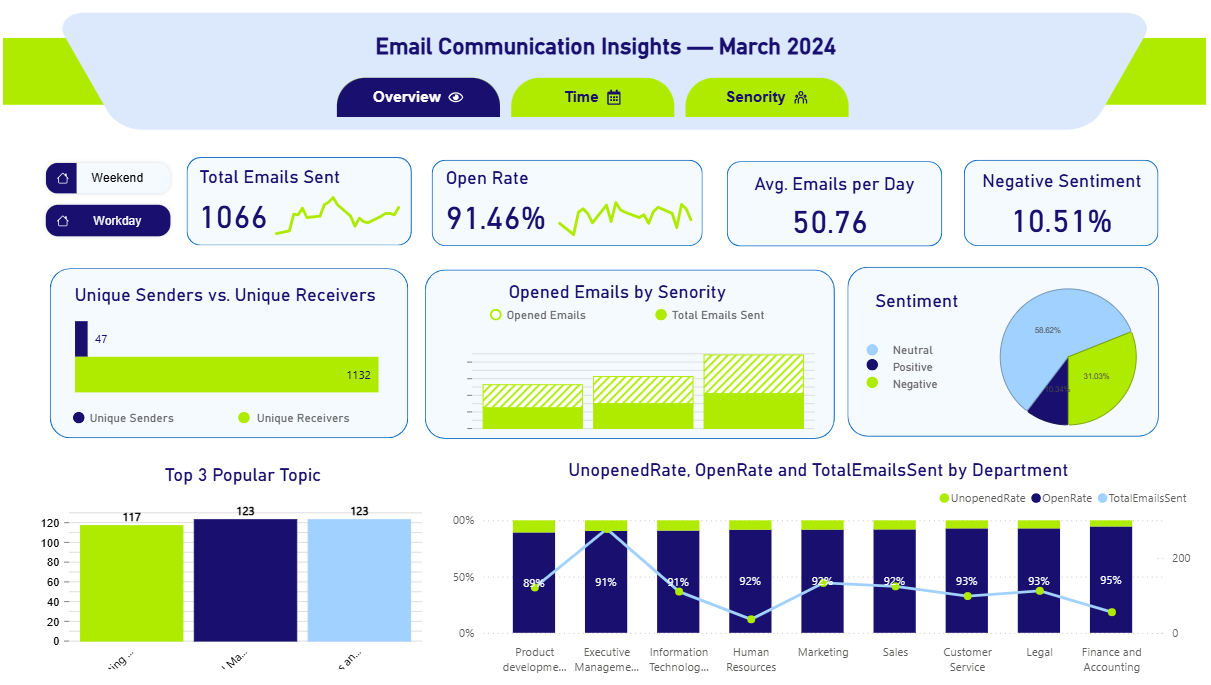
Email Communication Report
If you find this website helpful, share it with friends and colleagues to boost their Power BI skills and work efficiency!
Like this site? Share it