Power BI Internal Email Communication Dashboard Template (Free PBIX Download)
Introduction
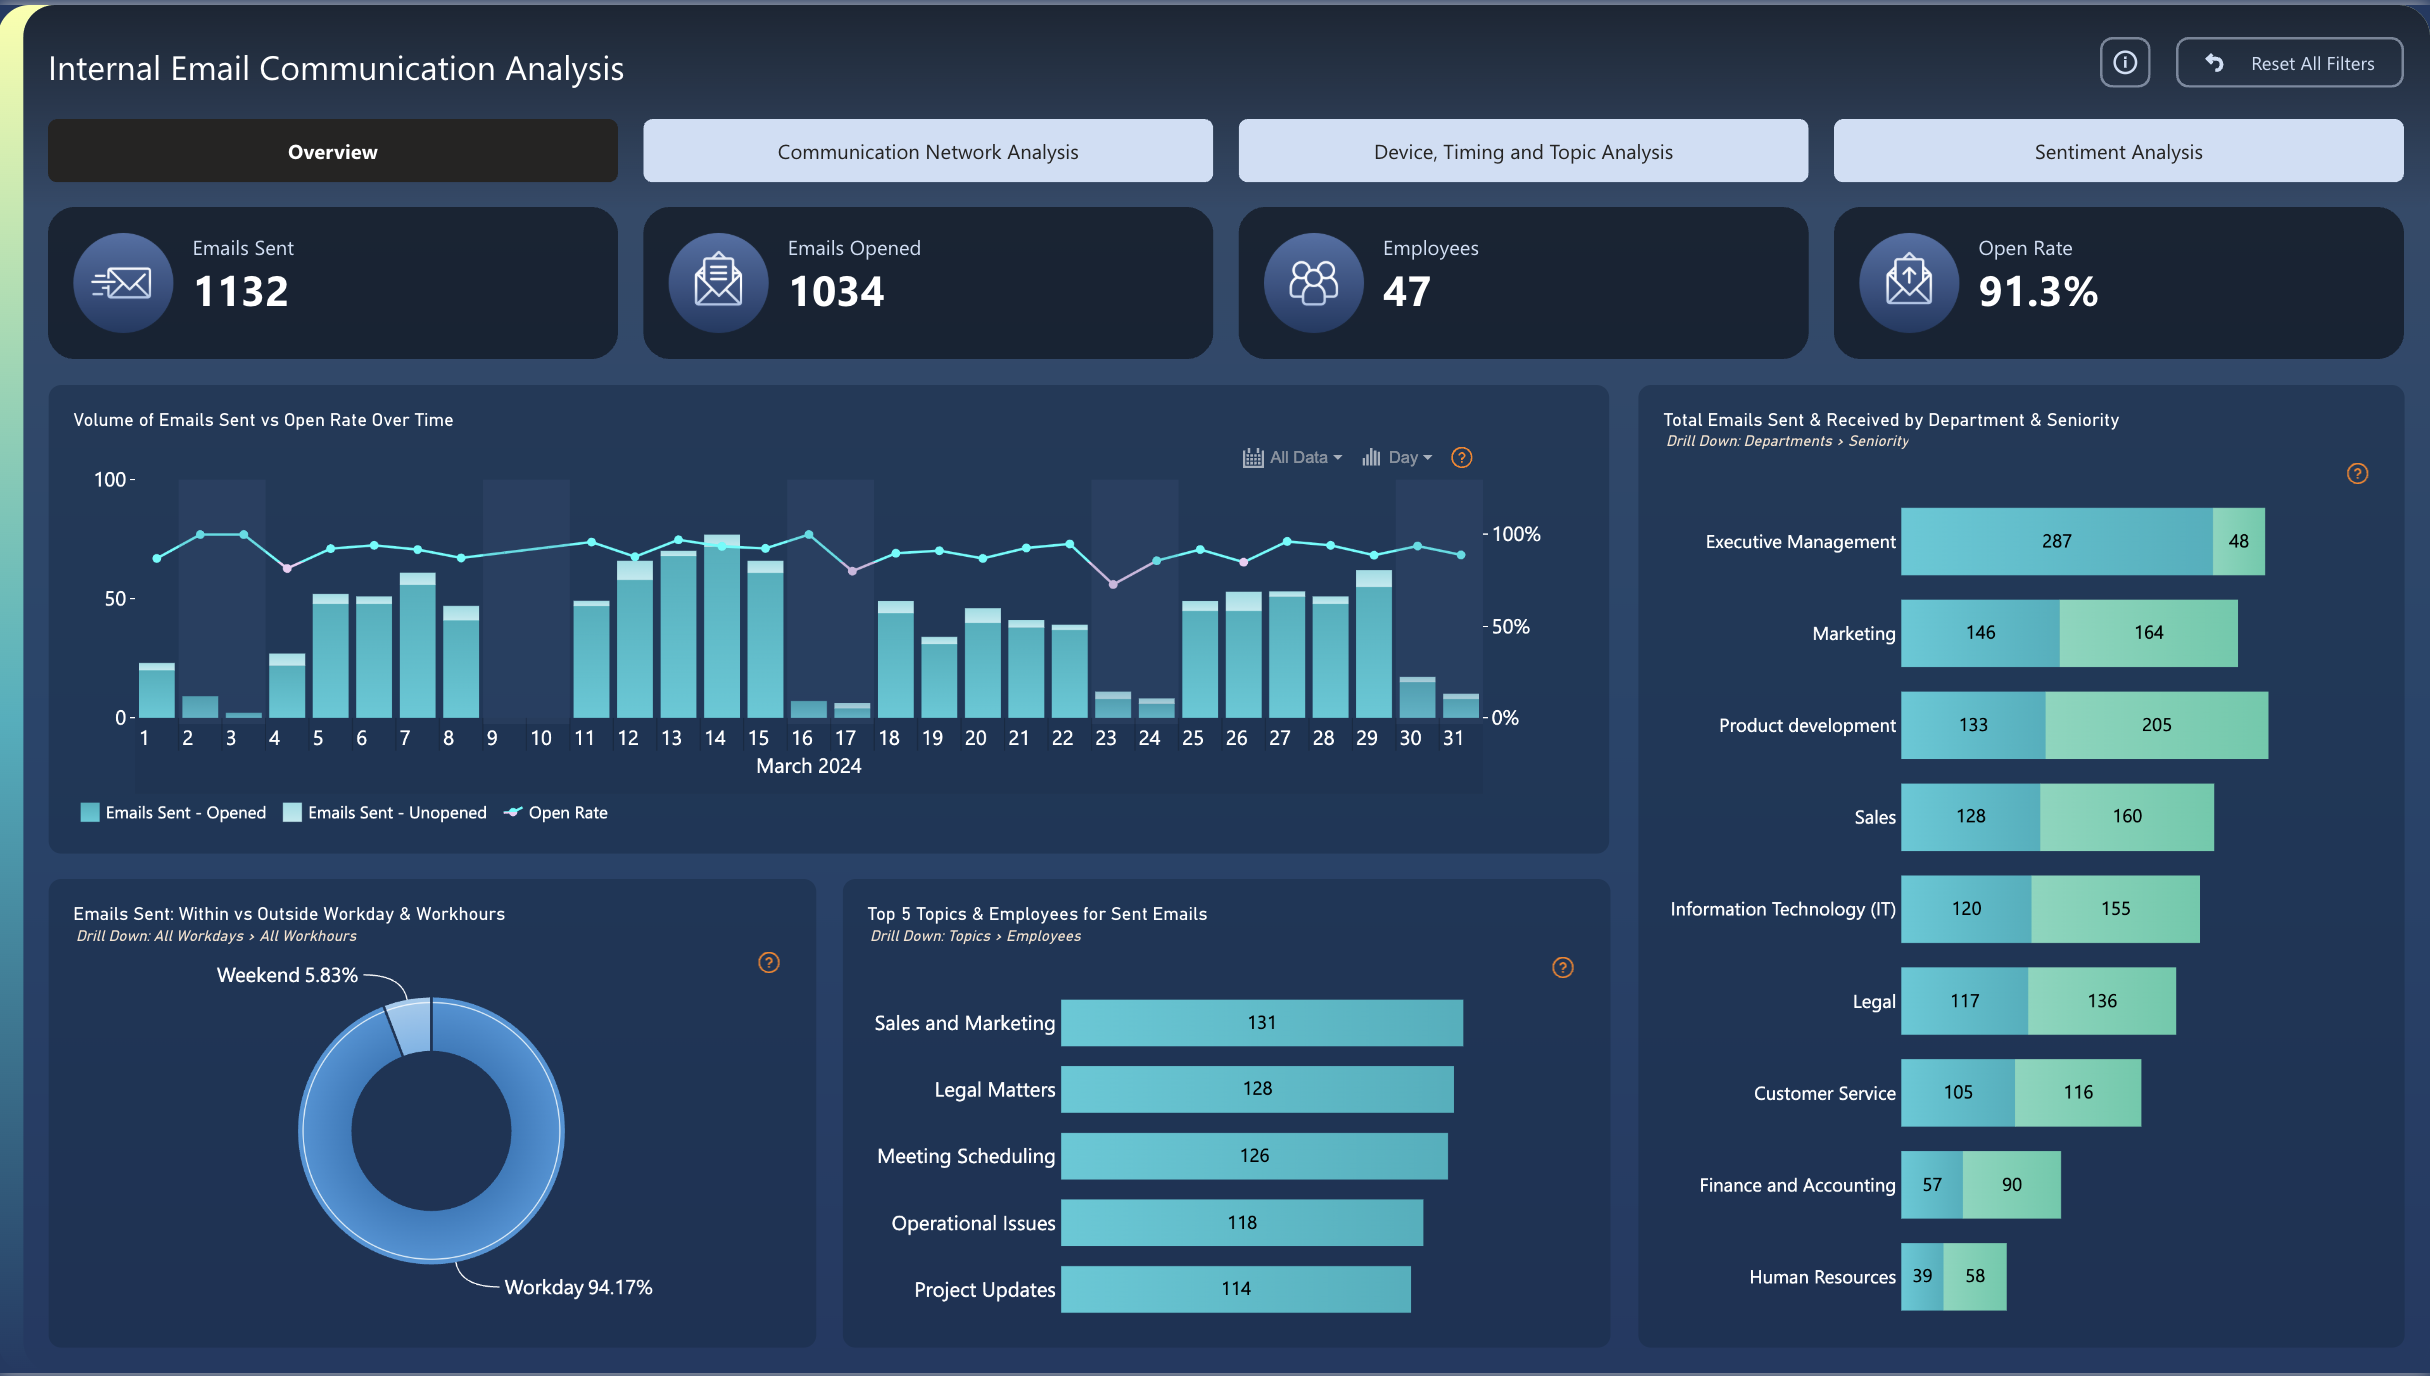
This Power BI dashboard delivers a comprehensive view of internal organizational email behavior for March 2024, covering 1,132 emails sent across 47 employees with a 91.3% open rate. It is designed for HR Managers, Internal Communications leads, and IT administrators who need to monitor employee engagement, workload distribution, and communication patterns across departments and seniority levels. With four analysis tabs — Overview, Communication Network Analysis, Device/Timing/Topic Analysis, and Sentiment Analysis — the template gives decision-makers both the macro picture and the granular signal needed to optimize internal communication strategy.
What's Inside This Template
KPI Banner — Four Core Metrics at a Glance
| MetricValueInterpretation | ||
| Emails Sent | 1,132 | Total internal emails dispatched in March 2024 |
| Emails Opened | 1,034 | Unique opens tracked across all recipients |
| Employees | 47 | Active workforce covered in this analysis |
| Open Rate | 91.3% | 98 emails remained unopened out of 1,132 sent |
Volume of Emails Sent vs Open Rate Over Time (Line + Bar, March 2024)
A dual-axis combo chart tracking daily email volume (stacked bars: opened vs unopened) against the open rate line across all 31 days. The open rate stays consistently near 100% for most of the month, with minor dips on high-volume days. Peak sending concentrates around days 11–15 and 25–29, likely corresponding to mid-month reporting cycles and end-of-month deadline pressure.
Emails Sent: Within vs Outside Workday & Workhours (Donut Chart)
| SegmentShare | |
| Workday (within hours) | 94.17% |
| Weekend | 5.83% |
Top 5 Topics for Sent Emails
| TopicEmails Sent | |
| Sales and Marketing | 131 |
| Legal Matters | 128 |
| Meeting Scheduling | 126 |
| Operational Issues | 118 |
| Project Updates | 114 |
The five topics span only 131 to 114 — a 14.9% spread — suggesting no single theme dominates, pointing to a well-distributed operational agenda.
Total Emails Sent & Received by Department & Seniority
| DepartmentSentReceived | ||
| Executive Management | 287 | 48 |
| Marketing | 146 | 164 |
| Product Development | 133 | 205 |
| Sales | 128 | 160 |
| Information Technology (IT) | 120 | 155 |
| Legal | 117 | 136 |
| Customer Service | 105 | 116 |
| Finance and Accounting | 57 | 90 |
| Human Resources | 39 | 58 |
Key Insights
- Executive Management sends 6× more than it receives — a structural broadcast dynamic. With 287 sent vs only 48 received (85.7% outbound), leadership functions primarily as a one-way announcer. If this ratio persists across months, it may indicate a culture where replies are discouraged rather than a genuine two-way dialogue channel.
- Product Development is the most information-hungry department — 205 received vs 133 sent (1.54× intake ratio). Product teams consume far more than they generate, consistent with cross-functional dependency on Sales, Legal, and IT input. If delivery timelines are slipping, this high-intake pattern warrants investigation as a bottleneck signal.
- The 91.3% open rate masks 98 permanently unread emails — and the culprit days are visible. The time-series shows open rate dips on high-volume days around days 14–15 and 28–30. Those are the precise windows where subject-line optimization or volume pacing would recover the most engagement.
- Legal Matters is the #2 topic at 128 emails — nearly matching Sales & Marketing at 131. For a 47-person org, having Legal as a top-2 communication theme is non-trivial: it likely signals an active compliance period, contract-heavy quarter, or M&A activity. Leadership should validate whether this volume is expected or a leading indicator of organizational stress.
- Only 5.83% of emails are sent on weekends — a positive wellbeing signal, but likely unevenly distributed. In aggregate this looks healthy, but weekend senders are almost certainly concentrated in a small number of senior individuals. The Device, Timing and Topic Analysis tab is the right place to identify and address those outliers.
- Finance and HR are dramatically underrepresented — 57 and 39 emails sent respectively — despite being operationally critical. Both departments likely rely on HRIS and ERP ticketing rather than email, but their low volume also means they may be excluded from informal information loops. The Communication Network Analysis tab can confirm whether these teams are structurally isolated.
Who This Template Is For
- HR Managers and Chief People Officers who need to monitor whether communication load is equitably distributed, identify burnout signals from after-hours volume, and understand which departments are under-informed or overloaded.
- Internal Communications Managers who want a data-driven baseline for open rates, topic prioritization, and send-time optimization — moving from intuition-based to evidence-based internal messaging strategy.
- IT and Digital Workplace Administrators auditing email behavior for compliance, data governance, or collaboration tool consolidation — particularly when evaluating whether email is the right channel for specific communication types.
How to Use
- Download the PBIX file from the Flexa Intel gallery and save it locally.
- Open in Power BI Desktop (any version from 2023 onward supports all visuals used).
- Connect your data source — likely an Exchange Online / Microsoft 365 email log export, an HR system headcount extract, or a custom SQL table storing email metadata (sender, recipient, timestamp, subject, open status).
- All visuals update automatically — KPI cards, the time-series, department breakdown, topic classification, and sentiment tab will all refresh to reflect your organization's actual data.
The department and seniority breakdown is visualized as a bar chart — great for comparison, but limited for row-level exploration. Want to drill into individual sender/recipient pairs, filter by topic and seniority simultaneously, or add conditional formatting to flag departments with anomalous send-to-receive ratios? Flexa Tables is a Microsoft-certified Power BI visual built for multi-level tabular reporting — with expandable department rows, sortable columns, and built-in variance indicators that make outliers like Executive Management's 6:1 ratio impossible to miss.
Other Templates
 Free Marketing
Power BI Marketing Campaign Analysis Dashboard Template (Free PBIX Download)
 Free Sales & Revenue
Sales Conversion – Multiple Agents Dashboard
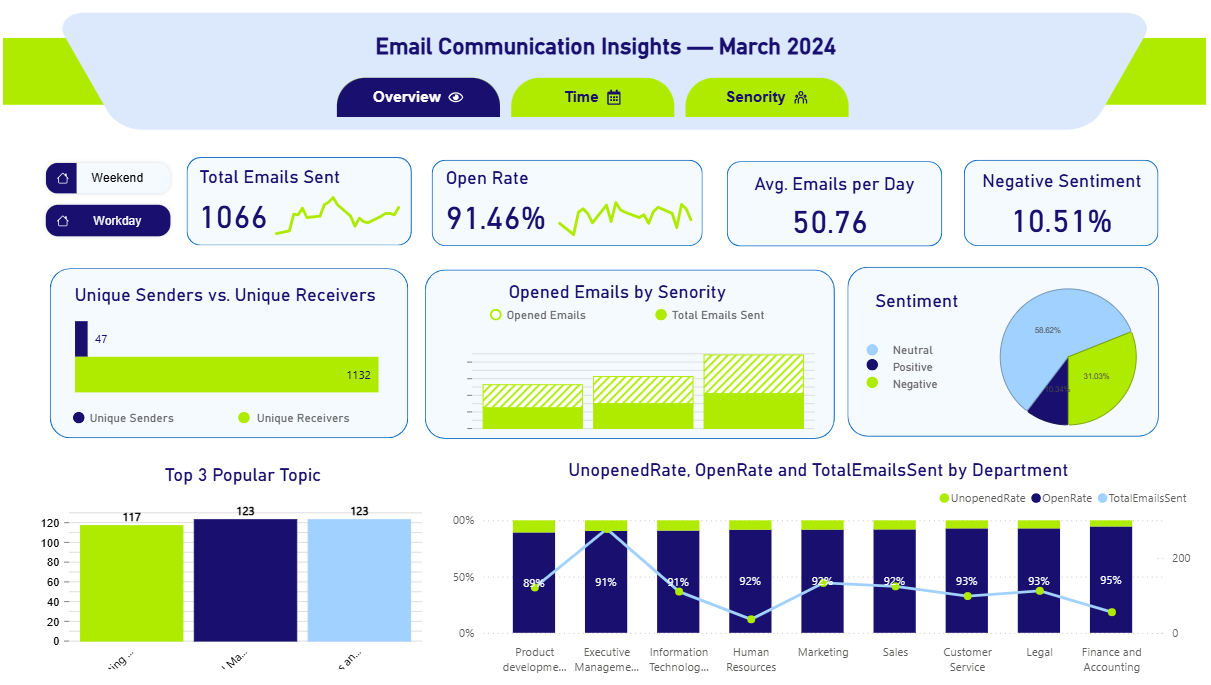 Free Marketing
Email Communication Report
If you find this website helpful, share it with friends and colleagues to boost their Power BI skills and work efficiency!
Like this site? Share it