Power BI Electronic Product Reviews Dashboard Template (Free PBIX Download)
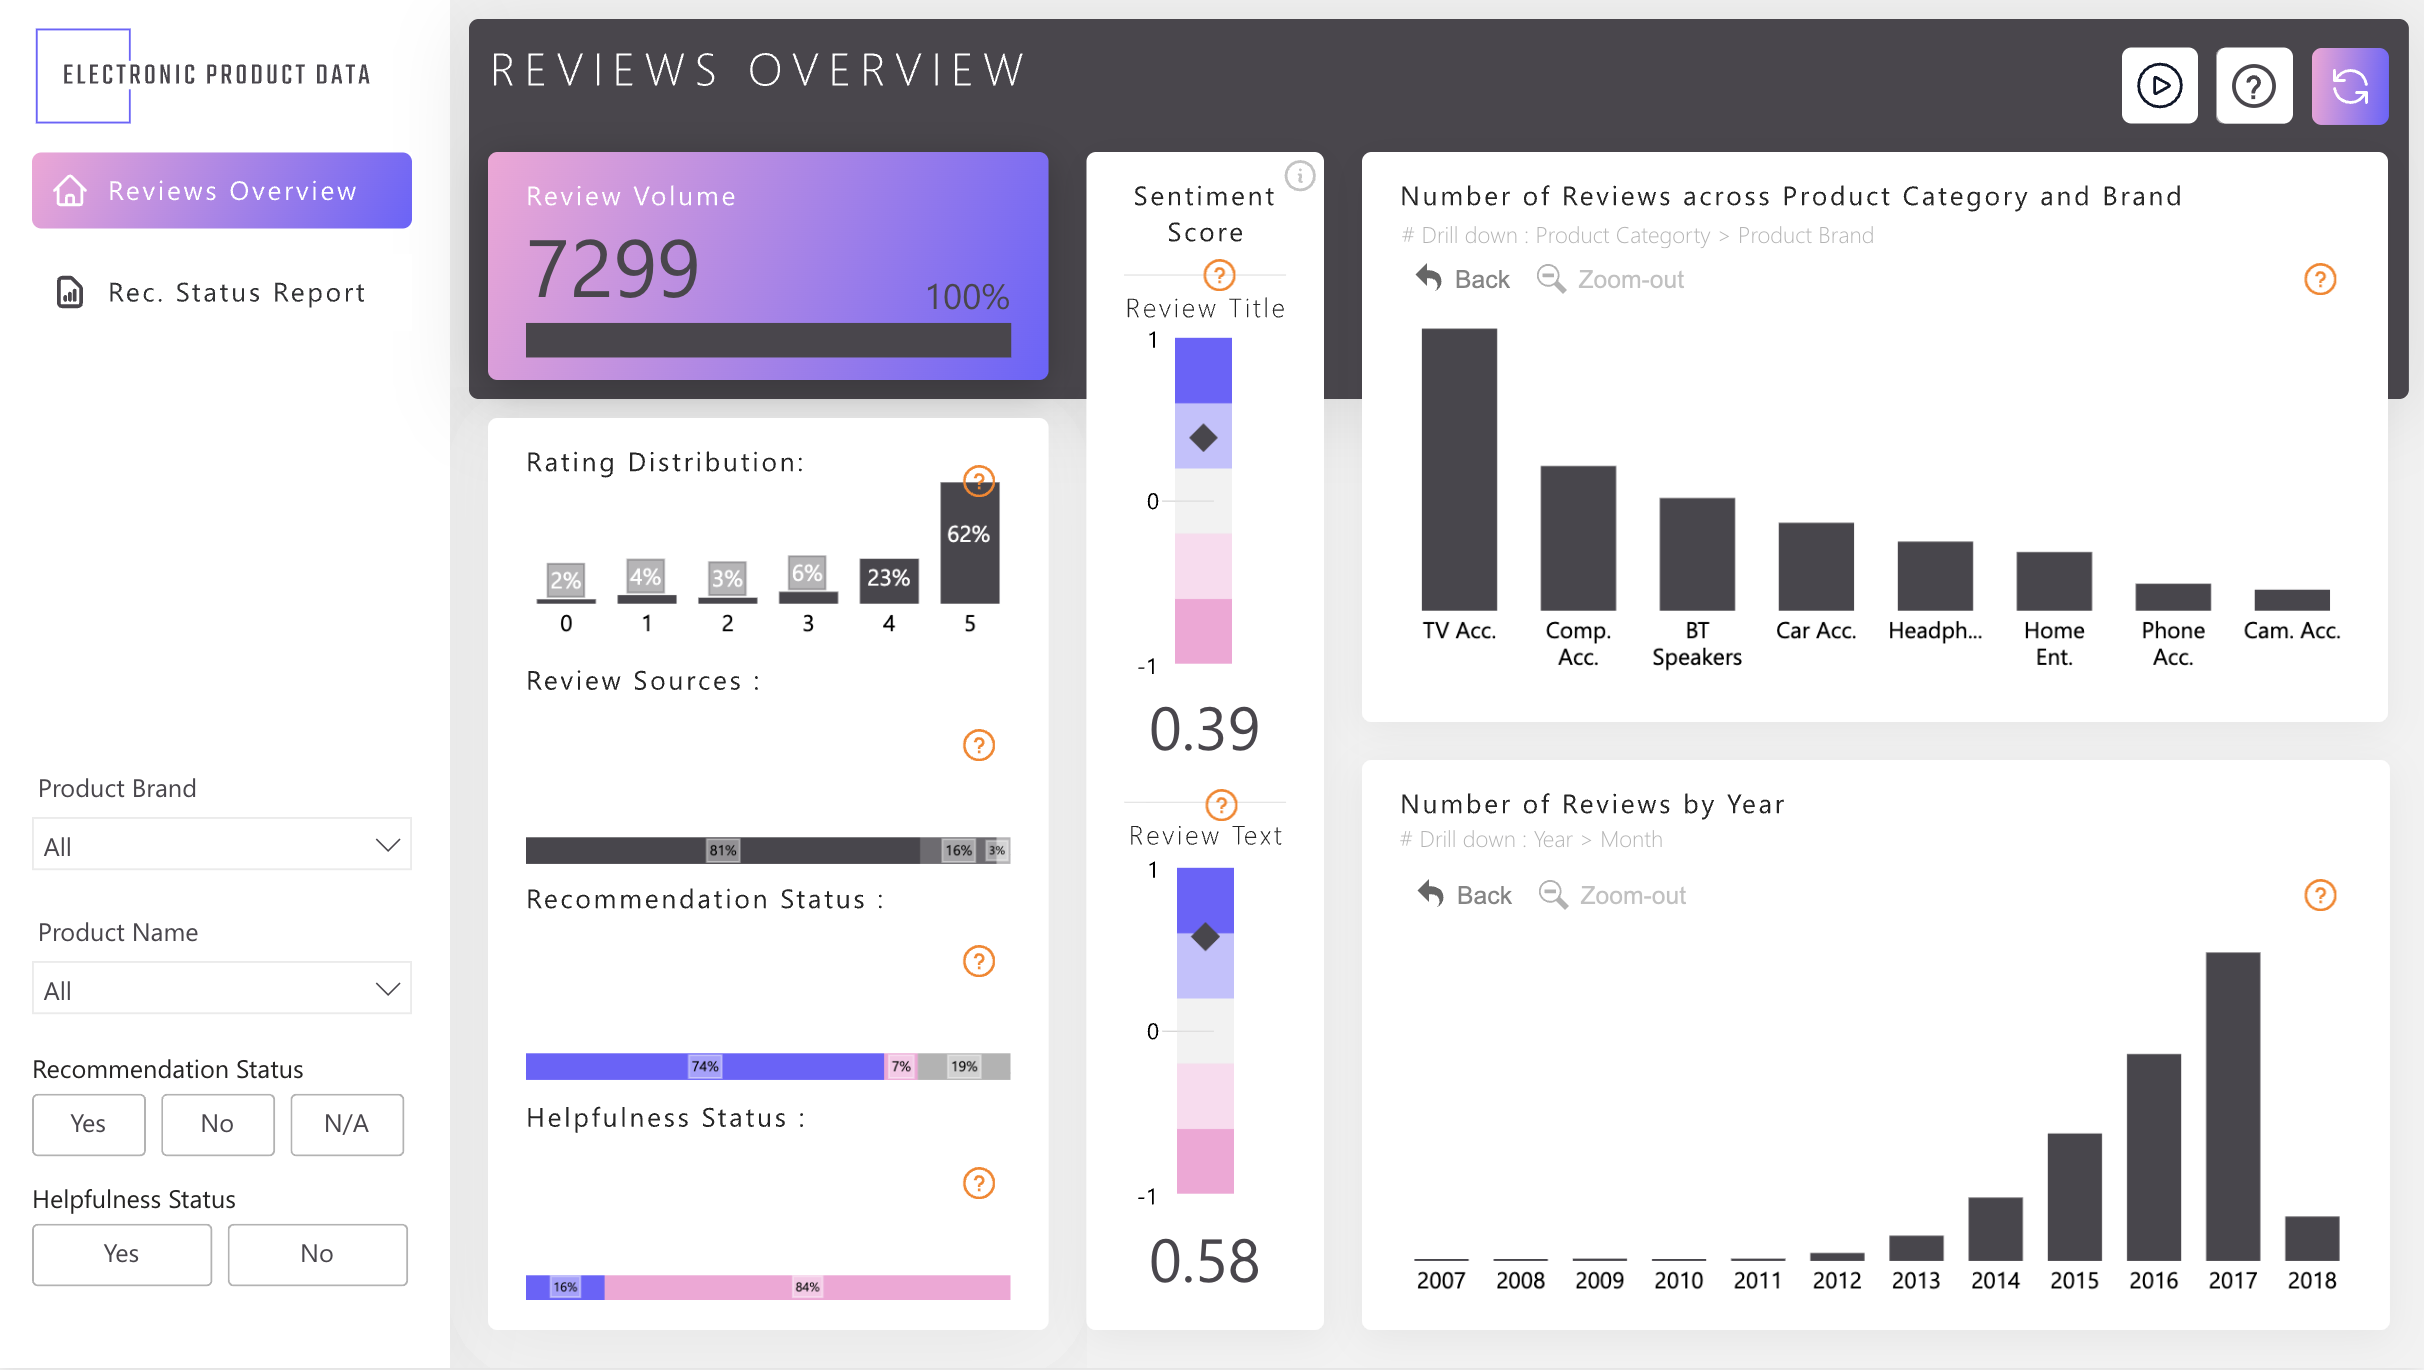
This dashboard delivers a comprehensive view of customer review behavior across electronic product categories — combining volume trends, sentiment scoring, rating distribution, and recommendation signals into one analytical surface. It serves Product Managers, E-commerce Analysts, and Brand Managers who need to understand not just how many reviews exist, but what those reviews mean in terms of customer sentiment and product-level satisfaction. The dual sentiment scoring (Review Title vs Review Text) adds a layer of analytical depth that standard star-rating dashboards entirely miss.
1. What's Inside This Template
KPI Card — Review Volume
| MetricValue | |
| Total Reviews | 7,299 |
| Coverage | 100% |
7,299 reviews form the analytical base — large enough for statistically meaningful sentiment segmentation by category and brand.
Rating Distribution
| Star RatingShare | |
| 0 stars | 2% |
| 1 star | 4% |
| 2 stars | 3% |
| 3 stars | 6% |
| 4 stars | 23% |
| 5 stars | 62% |
The distribution is extremely top-heavy — 85% of all reviews are 4 or 5 stars. Only 9% are negative (0–2 stars), and 6% are neutral (3 stars). This suggests either genuinely high product satisfaction or survivorship bias in the review dataset (unhappy customers not completing reviews).
Review Sources
An 81%/16%/3% split across three sources (labels not fully visible) indicates one dominant review platform contributing the overwhelming majority of data — concentration risk for representativeness.
Recommendation Status
| StatusShare | |
| Recommended | 74% |
| No | 7% |
| N/A | 19% |
74% of reviewers actively recommend the product. The 19% N/A is significant — nearly 1 in 5 reviewers did not answer the recommendation question, which is a data quality gap that affects net promoter calculations.
Helpfulness Status
| StatusShare | |
| Helpful | 16% |
| Not Helpful | 84% |
This is the most counterintuitive metric in the dashboard. Only 16% of reviews are marked "helpful" by other users — despite 62% being 5-star. High star ratings do not correlate with review usefulness, suggesting most positive reviews are short, generic, or unsubstantiated ("Great product!") rather than analytically detailed.
Sentiment Score — Review Title vs Review Text
| Sentiment DimensionScore | |
| Review Title Sentiment | 0.39 |
| Review Text Sentiment | 0.58 |
Both scores are on a scale of -1 (negative) to +1 (positive). Review Text (0.58) is meaningfully higher than Review Title (0.39) — customers write more positively in their detailed reviews than in their headline summaries. This divergence suggests titles are written more cautiously or critically, while the body text elaborates with more positive context.
Bar Chart — Number of Reviews by Product Category
| CategoryRelative Volume | |
| TV Accessories | Highest (~1,800+) |
| Computer Accessories | Second |
| BT Speakers | Third |
| Car Accessories | Fourth |
| Headphones | Fifth |
| Home Entertainment | Sixth |
| Phone Accessories | Seventh |
| Camera Accessories | Lowest |
TV Accessories dominate review volume by a significant margin — roughly 2× the second-largest category (Computer Accessories). Camera Accessories and Phone Accessories have the thinnest review coverage, making sentiment scores in those categories less statistically reliable.
Bar Chart — Number of Reviews by Year (2007–2018)
Review volume was near-zero from 2007–2012, then accelerated sharply from 2014 onward, peaking dramatically in 2017 before dropping in 2018. The 2017 peak likely reflects the dataset's collection window rather than a true market trend. The growth curve confirms this is a post-2013 dataset skewed toward recent years.
Navigation
Two-page structure: Reviews Overview (current) and Rec. Status Report — enabling drill-through into recommendation-level analysis. Filters available: Product Brand, Product Name, Recommendation Status, Helpfulness Status.
2. Key Insights
- The 84% "not helpful" rate on reviews demolishes the value of star ratings alone. Despite 62% five-star ratings, 84% of those reviews were not deemed useful by other shoppers. This means the review dataset is voluminous but low-quality — a product team relying on star averages alone is making decisions on noise, not signal. Sentiment scoring (0.58) is the more reliable quality metric here.
- Review Title sentiment (0.39) vs Review Text sentiment (0.58) reveals a "cautious headline" pattern. Customers systematically write more positive body text than their titles suggest. This 0.19-point gap indicates that brief, public-facing titles understate actual satisfaction — a finding that matters for any system scraping headlines for quick sentiment reads.
- The 2017 review volume peak followed by a sharp 2018 drop is a data collection artifact, not a market signal. Organizations using this dataset for trend analysis must account for this truncation — any year-over-year growth calculation that includes 2018 will show false decline.
- TV Accessories generating ~2× the review volume of Computer Accessories despite being a narrower product category suggests extreme brand or SKU concentration. A handful of high-selling TV accessory SKUs likely account for the bulk of that volume — the brand drill-down capability in this dashboard is critical to verify whether the category signal is real or SKU-driven.
- 19% N/A on Recommendation Status represents ~1,386 reviews with missing intent data. If N/A skews toward neutral or negative reviewers who opted out of the binary yes/no choice, the true recommendation rate could be materially below the stated 74%. This is an unknown risk that the dashboard currently obscures by excluding N/A from the denominator.
- 81% source concentration in one review platform is a systemic bias risk. If that platform attracts a specific customer demographic (e.g., tech-savvy early adopters), the entire sentiment and rating analysis reflects that segment's preferences — not the general buyer population. Cross-platform validation is essential before drawing product strategy conclusions.
2. Who This Template Is For
- E-commerce Product Managers at electronics brands or retailers who need to move beyond star-rating averages and understand sentiment quality, helpfulness signals, and category-level review concentration to prioritize product improvement investments.
- Brand Analysts and Market Research teams who want to track review volume trends over time by year and month, drill into brand-level performance within each product category, and identify which product lines generate the most actionable customer feedback.
- Data Analysts and BI Developers in consumer electronics who need a ready-to-use Power BI template connectable to Amazon, BestBuy, or proprietary review database exports, with pre-built sentiment scoring logic and multi-filter interactivity.
4. How to Use
- Download the PBIX file from the Flexa Intel gallery.
- Open in Power BI Desktop (2023 or later for sentiment visual compatibility).
- Connect your data source — typically a flat review export from Amazon Seller Central, a scraped review database, or an internal CRM review table with fields for product ID, category, brand, rating, review title, review text, review date, recommendation flag, and helpfulness vote.
- All visuals update automatically — review volume KPI, rating distribution bars, source/recommendation/helpfulness stacked bars, sentiment gauges, category bar chart, and year-over-year trend chart all recalculate from your connected review data.
This dashboard visualizes review patterns powerfully but lacks a structured brand-by-category matrix table — no ranked view showing each brand's review count, average rating, sentiment score, recommendation rate, and helpfulness rate side by side. Flexa Tables is a Microsoft-certified Power BI visual built for exactly this — multi-column tabular reporting with conditional formatting by sentiment tier, sortable brand rankings, and expandable category-to-brand hierarchies, making competitive brand review benchmarking fast and presentation-ready.
Other Templates
 Free Sales & Revenue
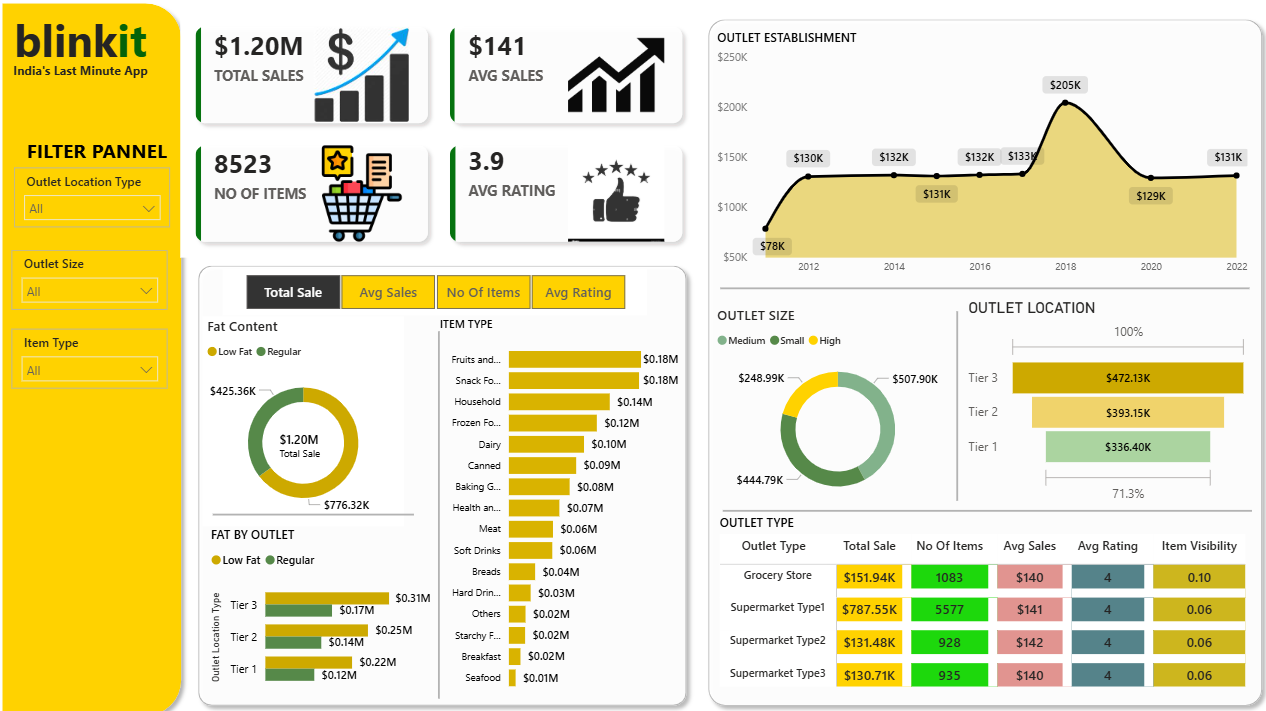
Power BI Blinkit Grocery Sales Dashboard Template (Free PBIX Download)
 Free Sales & Revenue
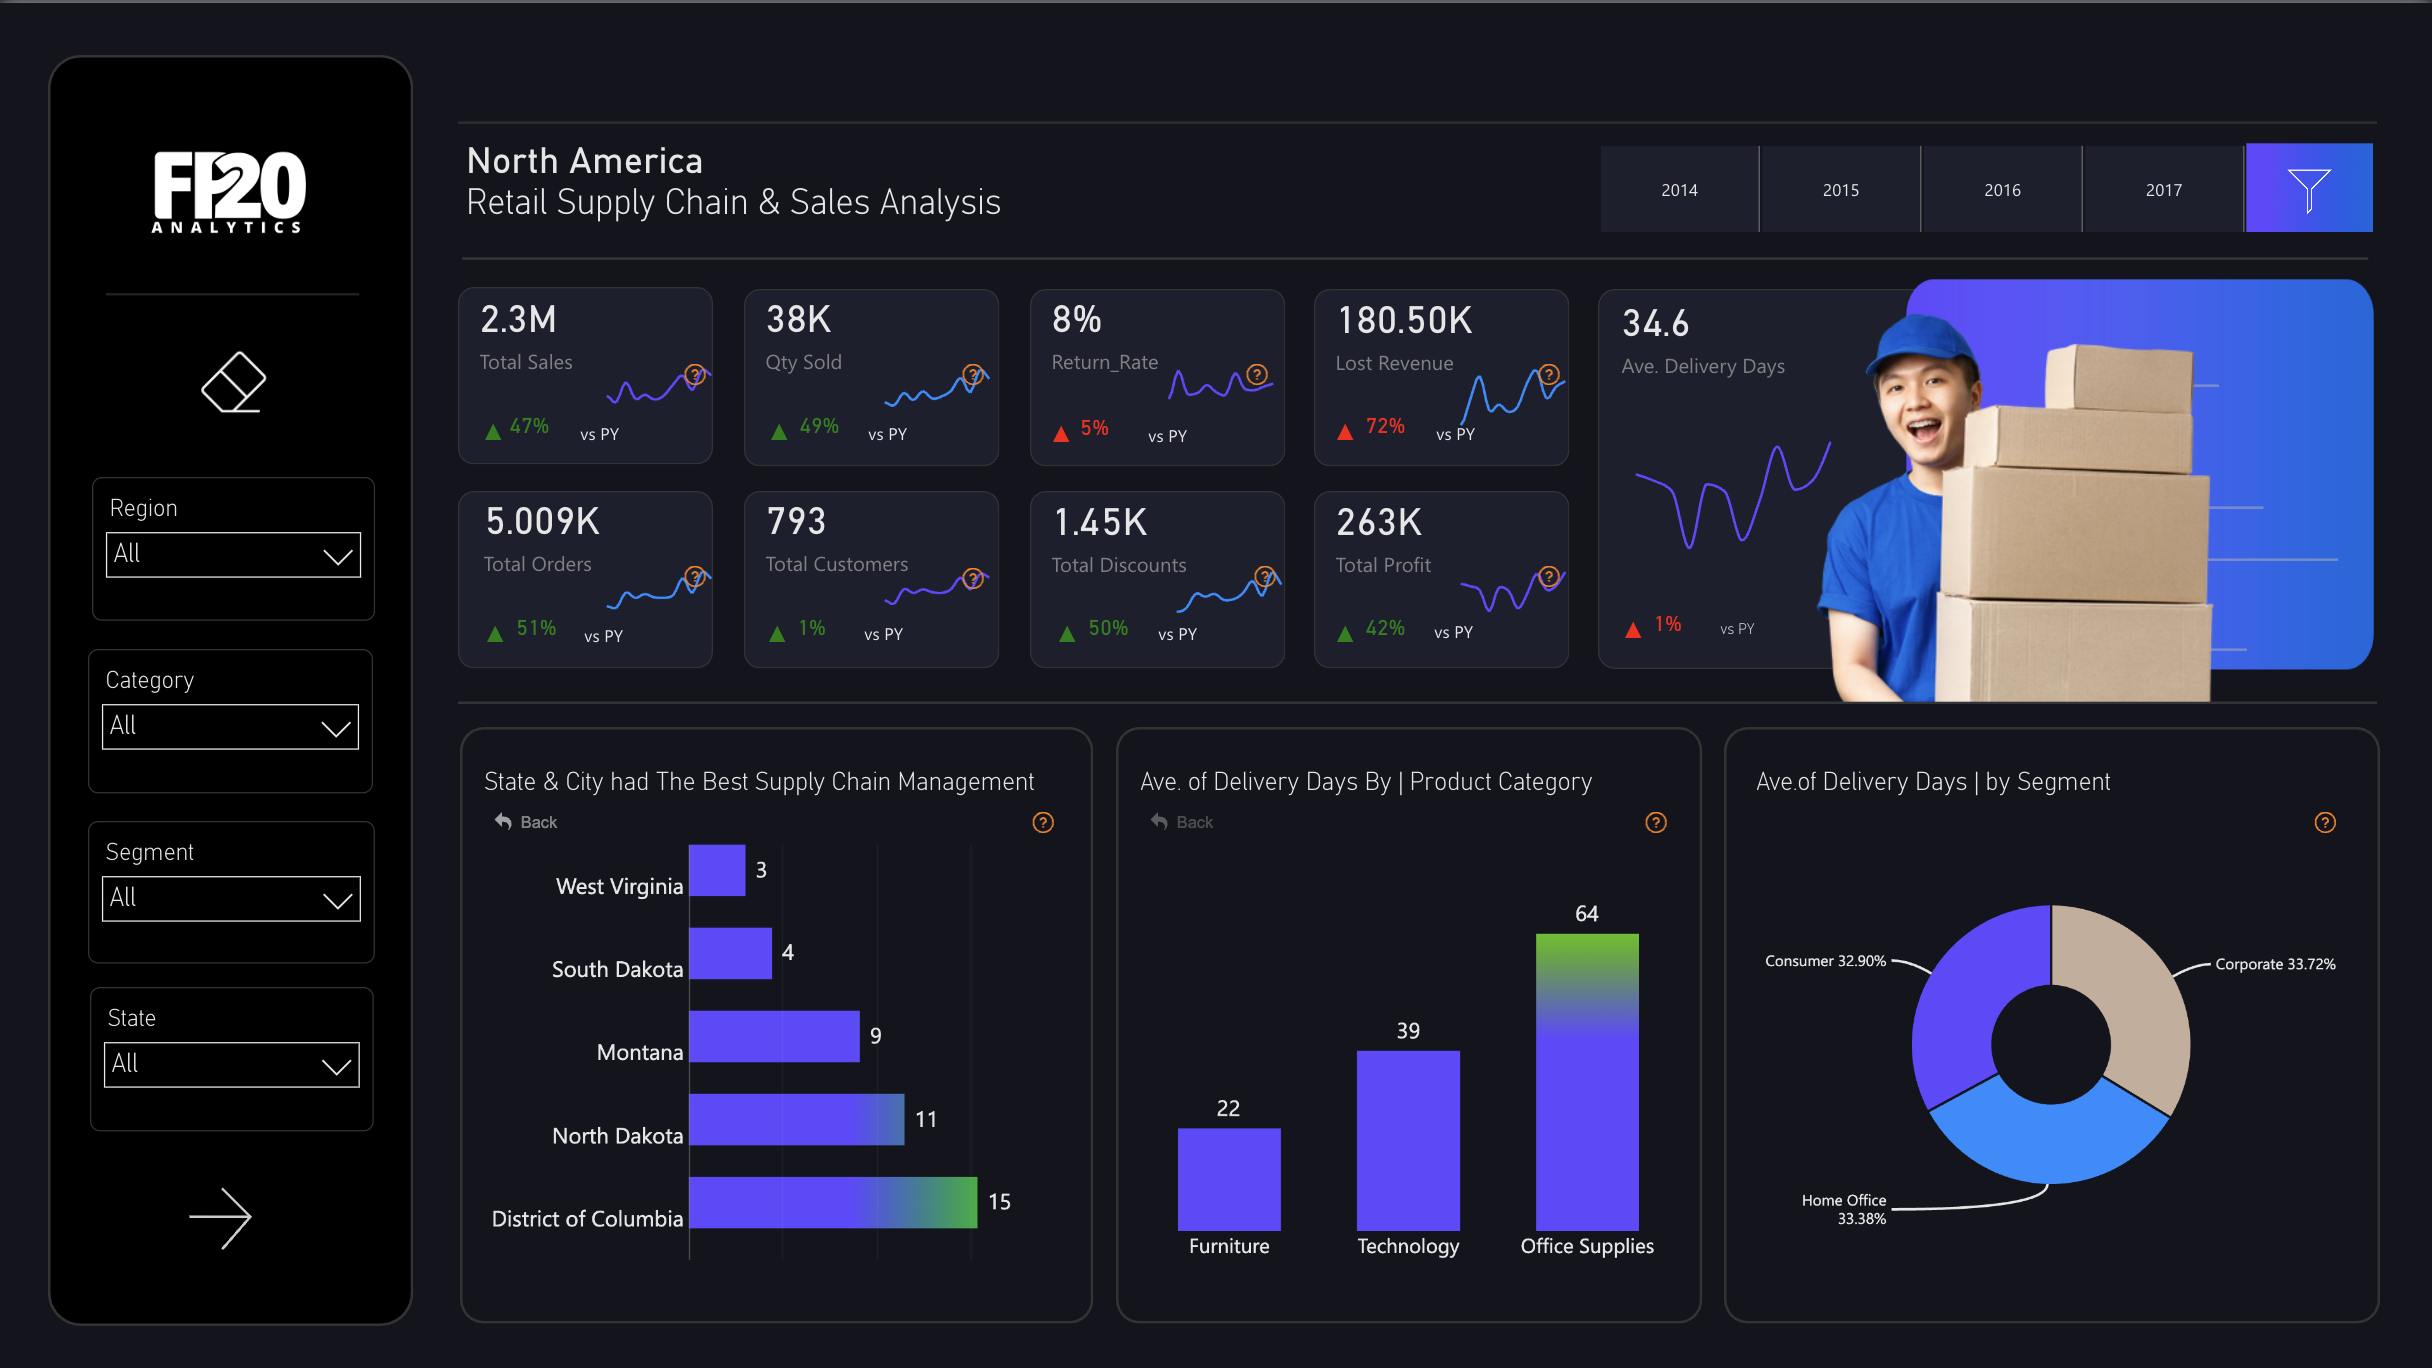
Power BI North America Retail Supply Chain & Sales Analysis Dashboard Template (Free PBIX Download)
 Free Sales & Revenue
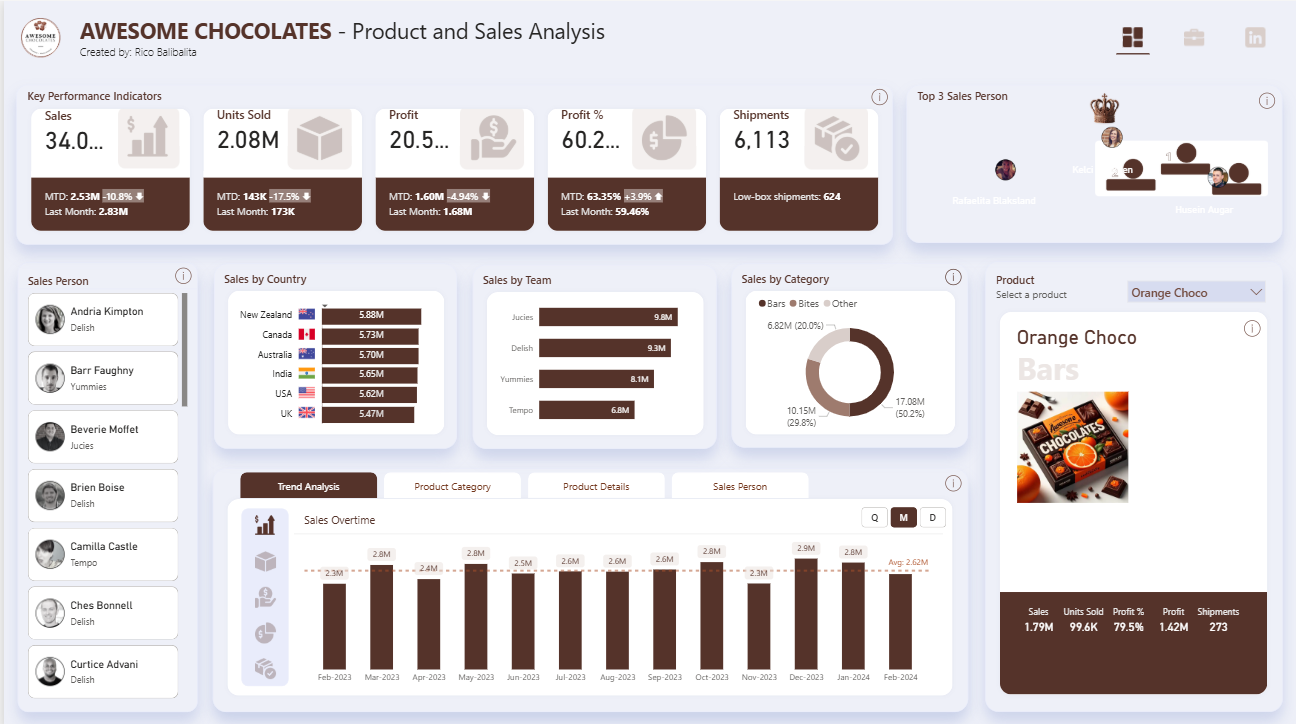
Power BI Product Sales Analysis Dashboard Template — FMCG Product Drill-Down (Free PBIX Download)
If you find this website helpful, share it with friends and colleagues to boost their Power BI skills and work efficiency!
Like this site? Share it