Power BI CRM Pipeline Analysis Dashboard Template (Free PBIX Download)
Introduction
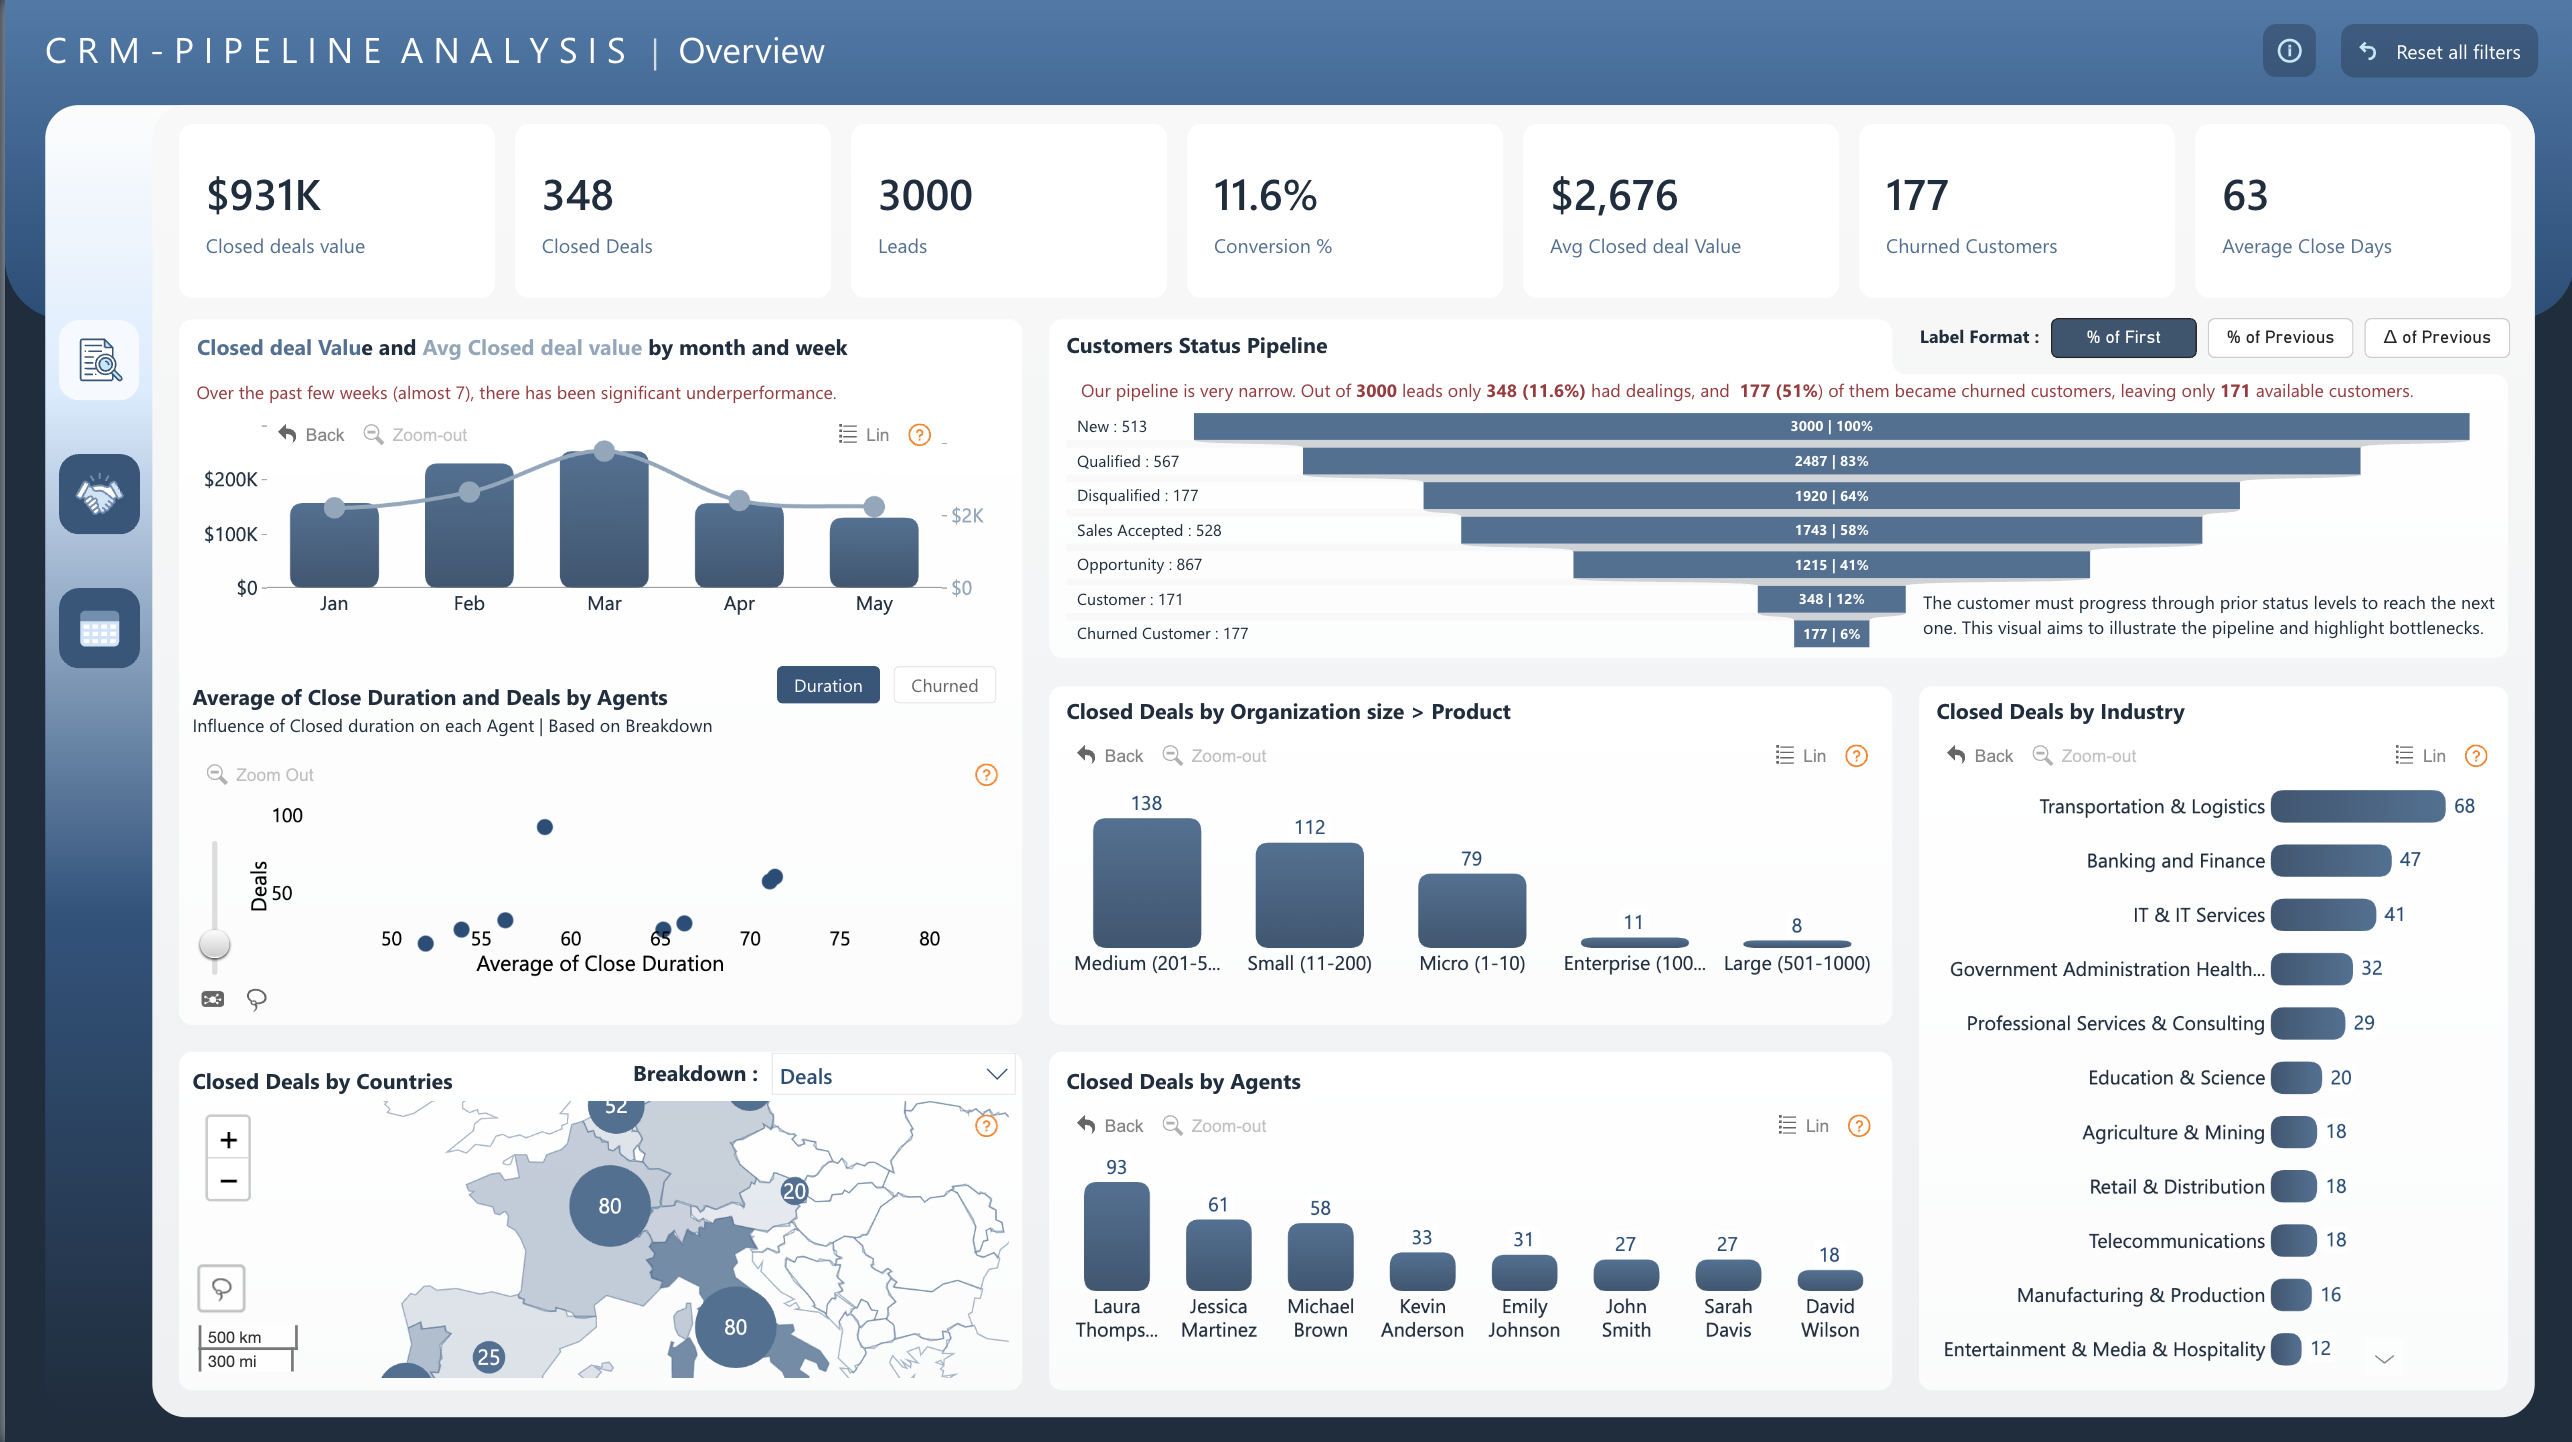
This Power BI CRM Pipeline Analysis dashboard gives sales leaders a complete view of deal flow — from raw lead intake to closed revenue — across agents, company sizes, geographies, and industries. It surfaces the full funnel drop-off story: out of 3,000 leads, only 348 (11.6%) convert to closed deals, while 177 customers churn immediately after — a pipeline efficiency problem that demands structural attention. Built for B2B sales operations, it delivers the KPIs, trend lines, and segment-level breakdowns that revenue and CRM managers need to diagnose bottlenecks and prioritize interventions.
What's Inside This Template
KPI Banner
| MetricValueWhat It Reveals | ||
| Closed Deals Value | $931K | Total realized revenue from won deals |
| Closed Deals | 348 | Volume of won deals out of 3,000 leads |
| Leads | 3,000 | Total leads entering the pipeline |
| Conversion % | 11.6% | Only 1 in ~8.6 leads closes |
| Avg Closed Deal Value | $2,676 | Revenue per closed deal |
| Churned Customers | 177 | Post-sale attrition — 51% of customers lost |
| Average Close Days | 63 | Sales cycle length |
Closed Deal Value & Avg Closed Deal Value by Month and Week
A combination bar + line chart tracking monthly closed deal value (bars) alongside weekly average closed deal value (line). March is the clear peak; the dashboard explicitly flags "significant underperformance over the past 7 weeks."
| MonthClosed Deal Value (Approx.) | |
| January | ~$100K |
| February | ~$150K |
| March | ~$200K+ |
| April | ~$150K |
| May | ~$100K |
Customers Status Pipeline
Horizontal bar funnel showing lead progression through CRM stages with % of First (total) label.
| StatusCount% of 3,000 | ||
| New | 3,000 | 100% |
| Qualified | 2,487 | 83% |
| Disqualified | 1,920 | 64% |
| Sales Accepted | 1,743 | 58% |
| Opportunity | 1,215 | 41% |
| Customer | 348 | 12% |
| Churned Customer | 177 | 6% |
Average Close Duration and Deals by Agents (Scatter Plot)
Plots each agent by Average Close Duration (x-axis, days) vs. number of Deals (y-axis). Most agents cluster between 55–70 close days and 25–50 deals. One clear outlier closes ~100 deals at ~50 days — the highest performer by both volume and speed. Toggle available between Duration and Churned views.
Closed Deals by Organization Size
| Organization SizeClosed Deals | |
| Medium (201–500) | 138 |
| Small (11–200) | 112 |
| Micro (1–10) | 79 |
| Enterprise (100–...) | 11 |
| Large (501–1000) | 8 |
Closed Deals by Countries (Map)
Bubble map across Europe and neighboring regions. Two countries lead with ~80 deals each; secondary markets show 52, 25, and 20. Roughly 46% of all closed deals concentrate in just two markets.
Closed Deals by Agents
| AgentClosed Deals | |
| Laura Thompson | 93 |
| Jessica Martinez | 61 |
| Michael Brown | 58 |
| Kevin Anderson | 33 |
| Emily Johnson | 31 |
| John Smith | 27 |
| Sarah Davis | 27 |
| David Wilson | 18 |
Closed Deals by Industry
| IndustryClosed Deals | |
| Transportation & Logistics | 68 |
| Banking and Finance | 47 |
| IT & IT Services | 41 |
| Government Administration & Health | 32 |
| Professional Services & Consulting | 29 |
| Education & Science | 20 |
| Agriculture & Mining | 18 |
| Retail & Distribution | 18 |
| Telecommunications | 18 |
| Manufacturing & Production | 16 |
| Entertainment & Media & Hospitality | 12 |
Key Insights
The pipeline's net retention rate is just 5.7% — acquisition and retention are both broken simultaneously. Of 3,000 leads, 348 close (11.6%). Of those 348, 177 churn — leaving only 171 net active customers. Every dollar spent acquiring customers is immediately halved by attrition. CAC efficiency is structurally compromised until churn is addressed in parallel with conversion.
The Opportunity-to-Customer gate loses 71% of deals — this is where the pipeline bleeds out. 1,215 leads reach Opportunity status but only 348 close. That's a 29% close rate at the final stage. Whether the cause is pricing, proposal quality, or competitive loss, this single gate represents the highest-leverage fix in the entire funnel.
Revenue has dropped ~50% from its March peak and the decline has accelerated over 7 consecutive weeks. March closed at ~$200K+; May is tracking ~$100K. The dashboard explicitly flags "significant underperformance." This is not seasonal softness — it reflects pipeline depletion that was not replenished during the strong March period.
Laura Thompson drives 27% of all closed deals (93 of 348) — a dangerous single-point-of-failure for the team. The second-ranked agent, Jessica Martinez, closes 61 deals — 34% fewer. The top 3 agents together account for 212 of 348 deals (61%). If Thompson underperforms or churns, team output falls materially with no structural backstop.
Enterprise and Large companies account for only 19 closed deals combined — a near-total absence at the high-value end. Medium and Small companies drive 250 of 348 deals (72%). At an average deal value of $2,676, even adding 30 enterprise deals at a conservative $10K average would add $300K — a 32% revenue lift without touching SMB volume at all.
Transportation & Logistics alone accounts for 20% of closed deals, and the top 3 industries control 45% — vertical concentration risk is high. If Transportation or Banking faces a downturn, there is no diversified industry base to absorb the impact. Industries ranked 6–11 are each under 20 deals, too thin to compensate.
Who This Template Is For
- Sales Directors and VP of Sales who need a weekly CRM snapshot showing pipeline efficiency — conversion %, avg close days, churn rate — in one view without waiting on BI teams or exporting to Excel.
- Revenue Operations (RevOps) Analysts who need to pinpoint exactly where deals leak in the funnel — Qualified, Opportunity, or post-close churn — and present agent- and segment-level findings to leadership with data-backed visuals.
- CRM Managers and Sales Enablement Leads who need to identify coaching targets by comparing each agent's close duration against their deal volume, and benchmark underperformers against top closers like Laura Thompson.
How to Use
- Download the PBIX file from the Flexa Intel gallery.
- Open in Power BI Desktop (free from Microsoft — no premium license required).
- Connect your CRM data source — compatible with Salesforce, HubSpot, Pipedrive, Microsoft Dynamics 365, or any CRM exportable to CSV/Excel. Map fields to: Lead ID, Status, Close Date, Deal Value, Agent Name, Company Size, Country, Industry.
- All visuals refresh automatically — the funnel, KPI cards, scatter plot, map, and bar charts update instantly. Use date and region slicers to scope by quarter, territory, or agent team.
Want to drill beneath the pipeline charts into a structured deal-level table — showing each opportunity's status, agent, value, close date, and industry in a single sortable grid with conditional formatting by stage? Flexa Tables is a Microsoft-certified Power BI visual built for multi-column tabular CRM reporting with expandable row hierarchies by agent or territory and variance columns that highlight week-over-week close performance — exactly what pipeline reviews need beyond charts alone.
Other Templates
 Free Sales & Revenue
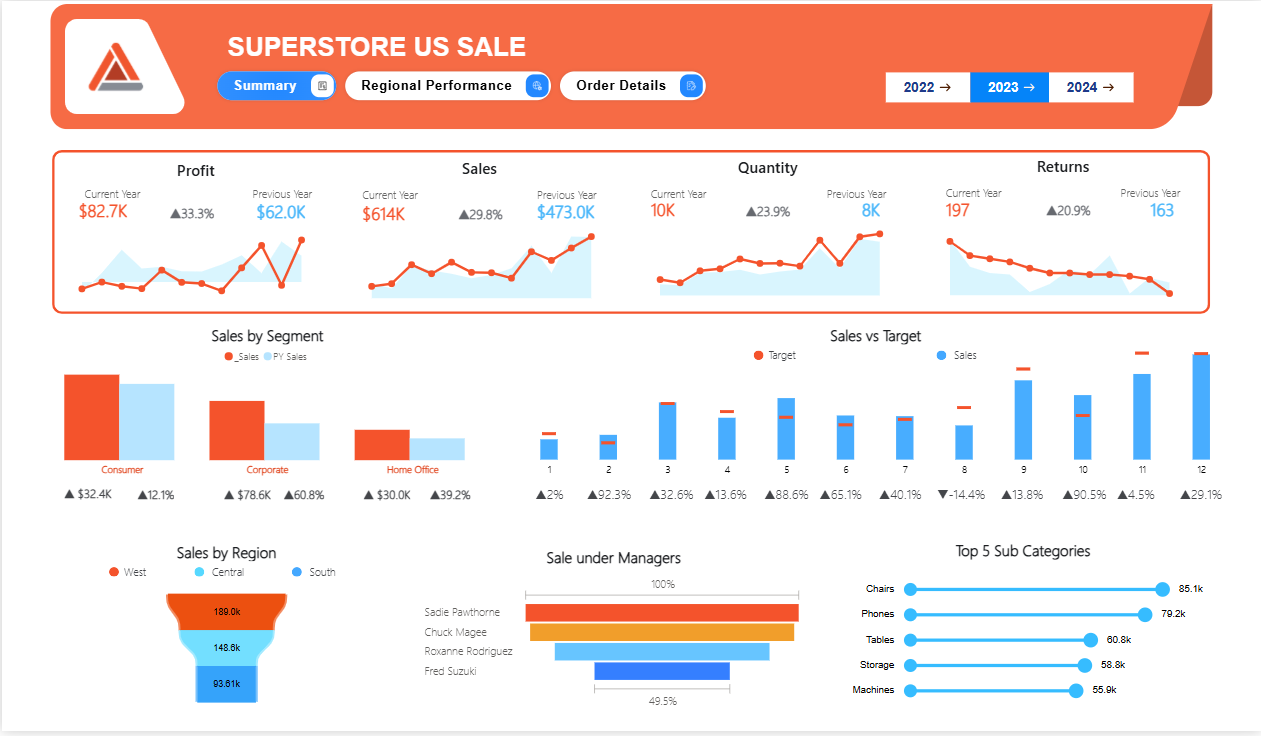
Superstore US Sale Report
 Free Sales & Revenue
Power BI Sales Dashboard with Variance Analysis — Contoso BI Template (Free PBIX Download)
 Free Sales & Revenue
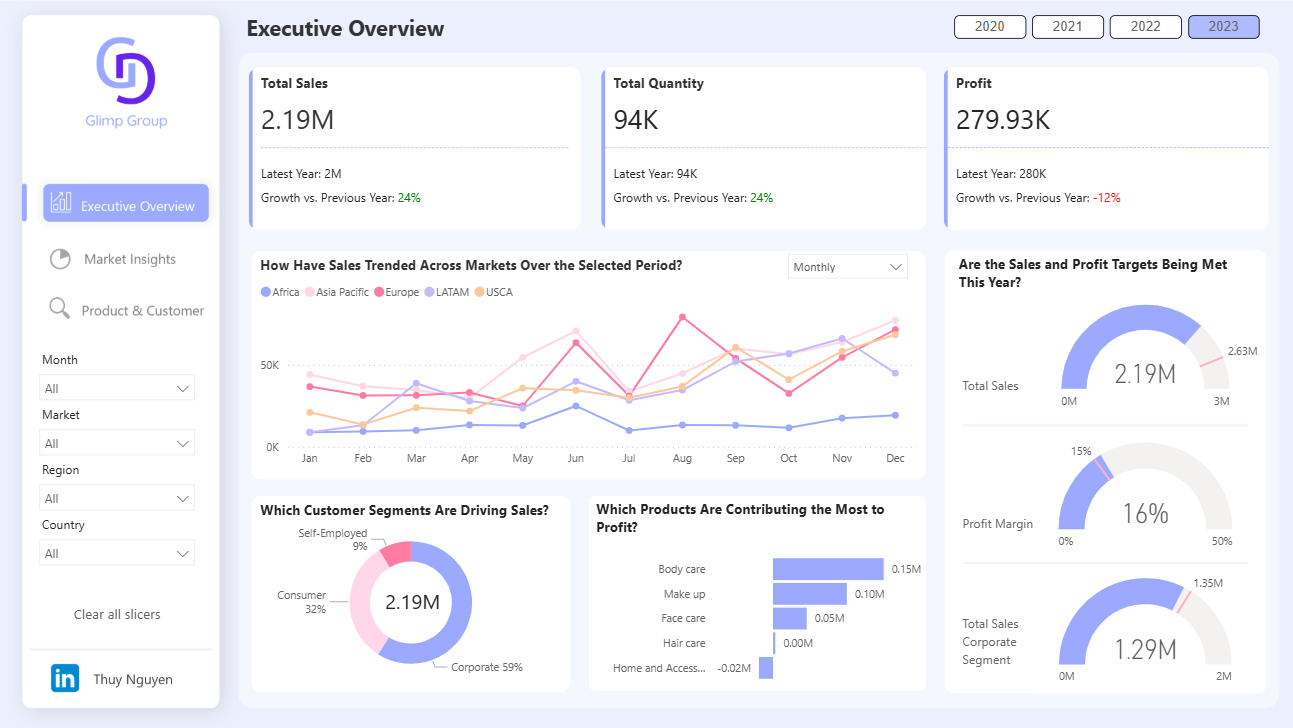
Power BI Executive Overview Dashboard Template — Global Sales & Profit Target Tracking (Free PBIX Download)
If you find this website helpful, share it with friends and colleagues to boost their Power BI skills and work efficiency!
Like this site? Share it