Power BI Competitive Marketing Analysis Dashboard Template (Free PBIX Download)
Introduction
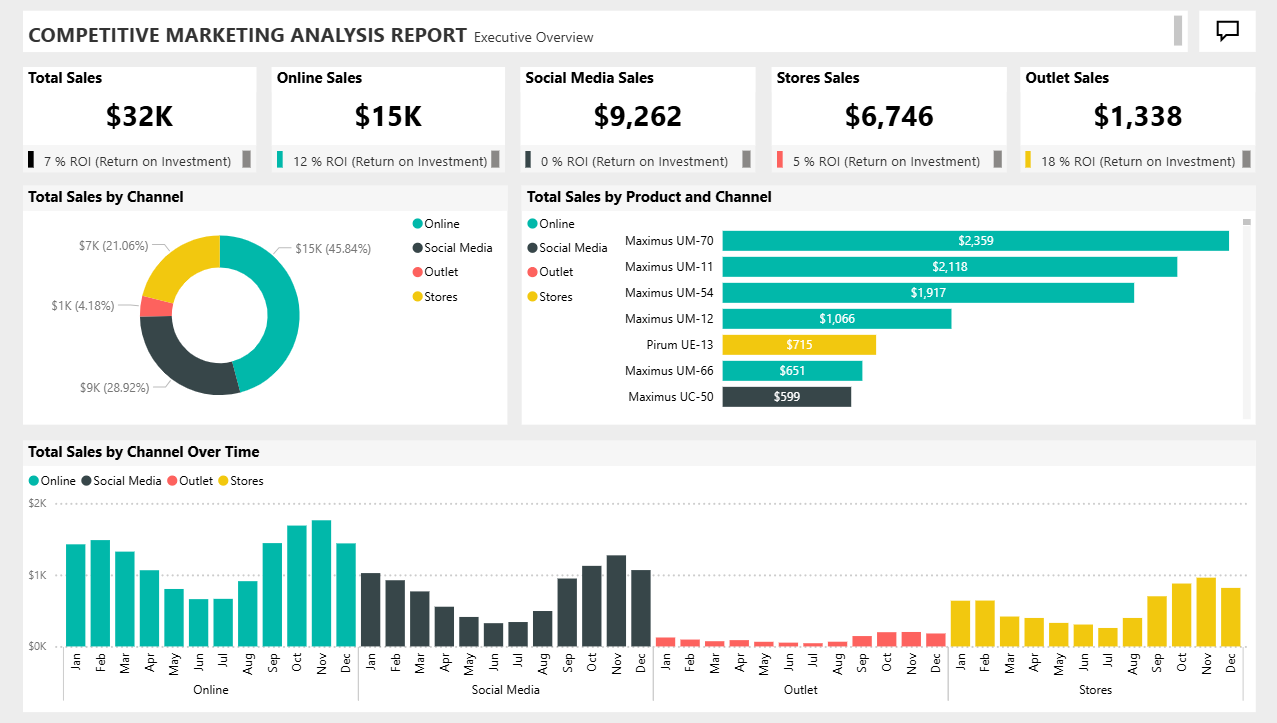
This Executive Overview dashboard gives marketing and sales leadership a unified view of channel performance, product-level sales contribution, and ROI efficiency across four distribution channels. It answers three questions simultaneously: which channel generates the most volume, which channel generates the best return, and which products are driving that revenue. The multi-panel layout separates channel mix (donut), product ranking (horizontal bar), and temporal trends (small multiples) into distinct analytical zones — enabling both strategic review and operational drill-down in a single page.
5. What's Inside This Template
KPI Cards — Channel Summary with ROI Benchmarks
| ChannelSalesROI | ||
| Total | $32K | 7% |
| Online | $15K | 12% |
| Social Media | $9,262 | 0% |
| Stores | $6,746 | 5% |
| Outlet | $1,338 | 18% |
Each card includes a bullet chart showing actual ROI vs a benchmark — the coloured bar indicates performance against target. This is more analytically useful than a plain number card because it shows whether ROI is above or below an internal threshold at a glance.
Total Sales by Channel — Donut Chart
| ChannelSalesShare | ||
| Online | $15K | 45.84% |
| Social Media | $9K | 28.92% |
| Stores | $7K | 21.06% |
| Outlet | $1K | 4.18% |
Online dominates at nearly half of total revenue. Outlet is the smallest channel by volume but — critically — the highest ROI channel at 18%.
Total Sales by Product and Channel — Horizontal Bar Chart
| ProductTop ChannelSales | ||
| Maximus UM-70 | Online | $2,359 |
| Maximus UM-11 | Online | $2,118 |
| Maximus UM-54 | Online | $1,917 |
| Maximus UM-12 | Online | $1,066 |
| Pirum UE-13 | Stores (yellow) | $715 |
| Maximus UM-66 | Online | $651 |
| Maximus UC-50 | Social Media (dark) | $599 |
The Maximus product line dominates the top 4 slots, all driven primarily by the Online channel (teal bars). Pirum UE-13 is the only product where Stores is the leading channel. Maximus UC-50 is the only product in this view where Social Media leads — notable given Social Media's 0% ROI.
Total Sales by Channel Over Time — Small Multiples Bar Chart Four side-by-side panels (Online, Social Media, Outlet, Stores), monthly granularity Jan–Dec.
Key observations from the chart:
- Online: peaks clearly in Oct–Nov (~$1.8–1.9K range), drops in spring months
- Social Media: relatively flat Jan–Aug, then accelerates Sep–Dec with a strong Q4 spike
- Outlet: consistently low flat bars all year (~$100–150/month range), minimal seasonality
- Stores: near-zero Jan–Jun, then ramps aggressively Jul–Dec, peaking Nov–Dec around $700–800K range — a dramatically different seasonality profile from Online
6. Key Insights
1. Outlet is the most capital-efficient channel in the business despite being the smallest by volume. At 18% ROI on $1,338 in sales, Outlet returns more per dollar invested than any other channel. Online generates 12× more revenue but only 12% ROI. If fixed costs allow, scaling Outlet investment is the highest-leverage move available — assuming the ROI holds at higher volumes.
2. Social Media has zero ROI on $9,262 in sales — the largest absolute value destruction in the portfolio. $9,262 (28.9% of total revenue) is being generated through a channel that returns 0% on its investment. This is not a rounding issue — the ROI indicator shows a yellow/amber benchmark miss. Social Media is either underpriced, overspent, or the attribution model is broken. This should be the first line item in any marketing budget review.
3. Stores channel has an extreme second-half seasonality bias that Online does not share. Stores generates near-zero revenue Jan–Jun, then accelerates sharply from Jul to Dec. Online shows a more moderate seasonal curve peaking in Oct–Nov. This means the two largest channels have opposite risk profiles — a business slowdown in H1 hits Stores disproportionately while Online provides the base load. An annual plan that doesn't account for this split will consistently miss H1 targets.
4. The Maximus product line is functionally the entire Online channel — no product diversification. The top 4 Online products (UM-70, UM-11, UM-54, UM-12) account for the majority of visible Online product revenue. Pirum UE-13, the only non-Maximus product in the top group, derives its sales primarily from Stores rather than Online. This concentration means any supply disruption, pricing change, or competitive entry in the Maximus line directly threatens the dominant channel.
5. Maximus UC-50's Social Media reliance is a strategic red flag given Social Media's 0% ROI. UC-50 is the only listed product where Social Media is the primary channel. Given that Social Media is the only channel with 0% ROI, UC-50 may be generating revenue at no or negative profit. A channel-level P&L for UC-50 specifically should be the immediate next analysis.
6. Total blended ROI (7%) masks a 18-point spread between best and worst channels. The 7% headline figure is mathematically correct but analytically misleading. Outlet (18%) and Online (12%) are pulling the average up; Social Media (0%) and Stores (5%) are pulling it down. A channel reallocation that moves 10% of Social Media budget to Outlet and Online would meaningfully lift the blended ROI without requiring revenue growth.
7. Who This Template Is For
- Marketing Directors and CMOs at multi-channel retail or consumer goods companies who need a single executive view of channel ROI, product sales rank, and seasonal trends — updated from a single data source without manual reporting.
- Sales Analysts tracking channel mix shifts who need to identify whether Online is cannibalising Stores, which products are channel-dependent, and where marketing spend is generating returns below internal thresholds.
- BI Developers building competitive marketing reports for brand or agency clients who want a production-ready template with ROI bullet charts, small multiples, and product-channel breakdowns that can be repointed to any client's sales database in under an hour.
8. How to Use
- Download the PBIX file from this page.
- Open in Power BI Desktop (2022 or later recommended for small multiples support).
- Connect your data source — replace the sample data with your CRM export (Salesforce, HubSpot), ecommerce platform (Shopify, WooCommerce), or ERP sales table. Map fields: Channel, Product, Sales Amount, Date, Marketing Cost (for ROI calculation).
- All visuals update automatically — donut chart, product bar chart, small multiples, KPI cards, and ROI bullet charts repopulate based on your data. Channel filters and date slicers work without any DAX modifications.
9. Soft CTA (Flexa Tables)
This dashboard shows which products are top performers by channel, but lacks a structured table that breaks down each product's sales by channel, MoM growth, and contribution % side by side. Flexa Tables is a Microsoft-certified Power BI visual that adds a multi-column product performance table with built-in MoM and YoY variance columns — letting sales teams compare Maximus vs Pirum line performance across channels directly in the published report, no DAX required.
Other Templates
 Free Other / General
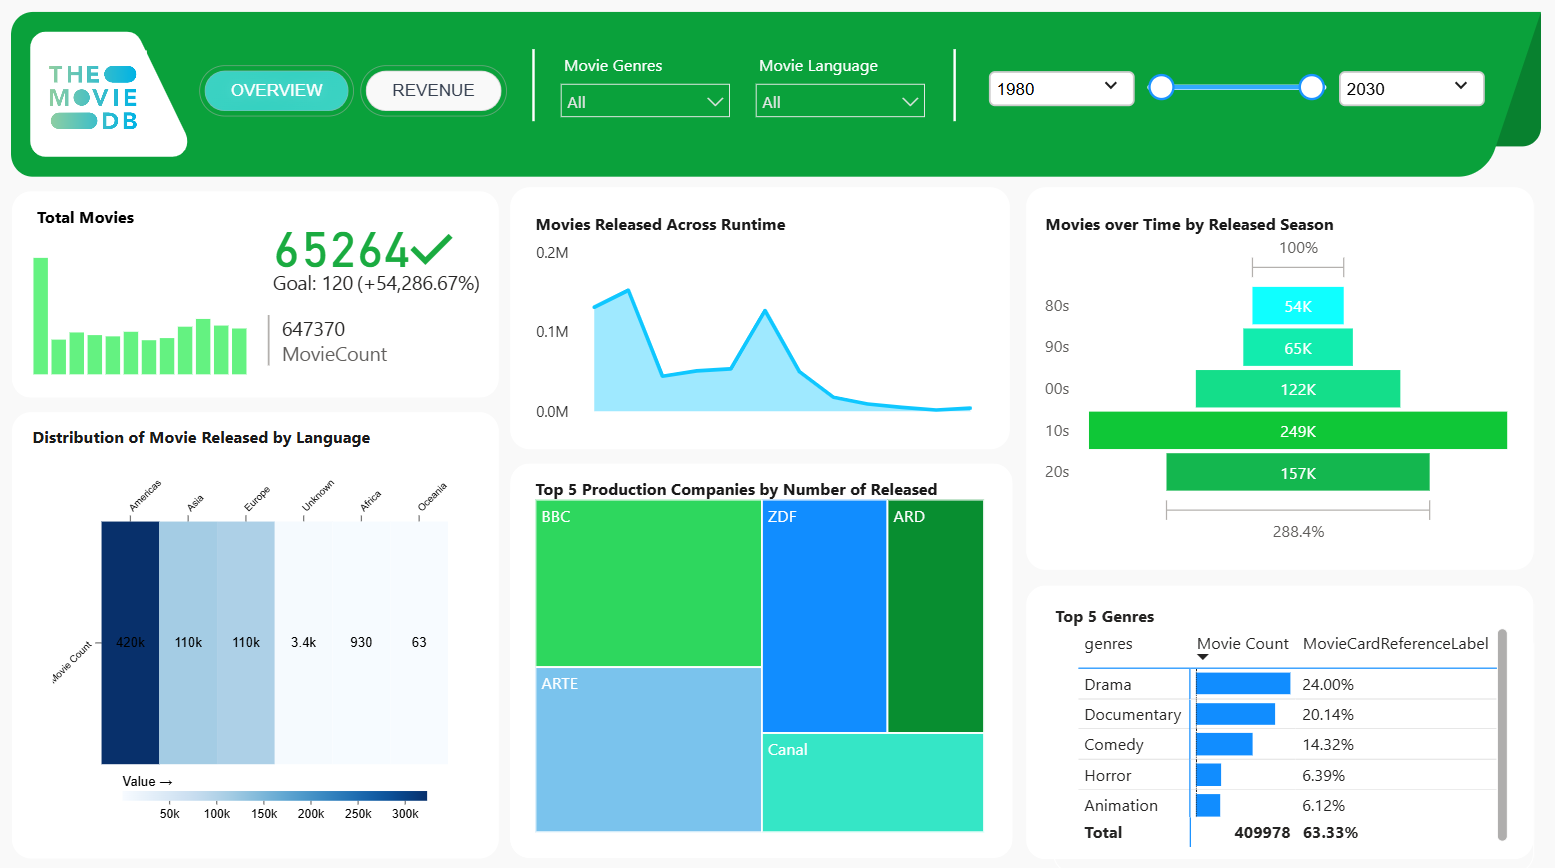
The Movie DB Overview dashboard
 Free Sales & Revenue
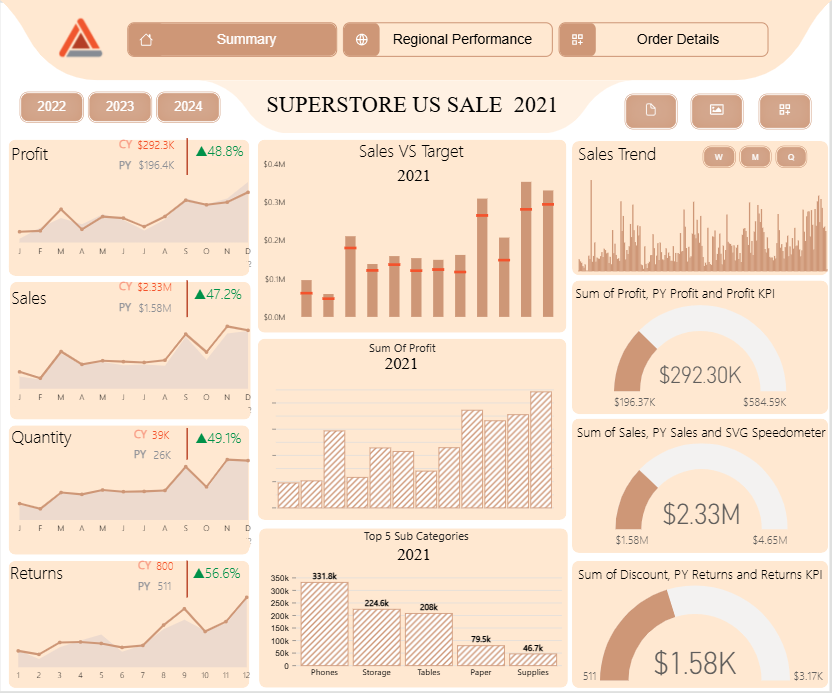
Superstore US Sale
 Free Sales & Revenue
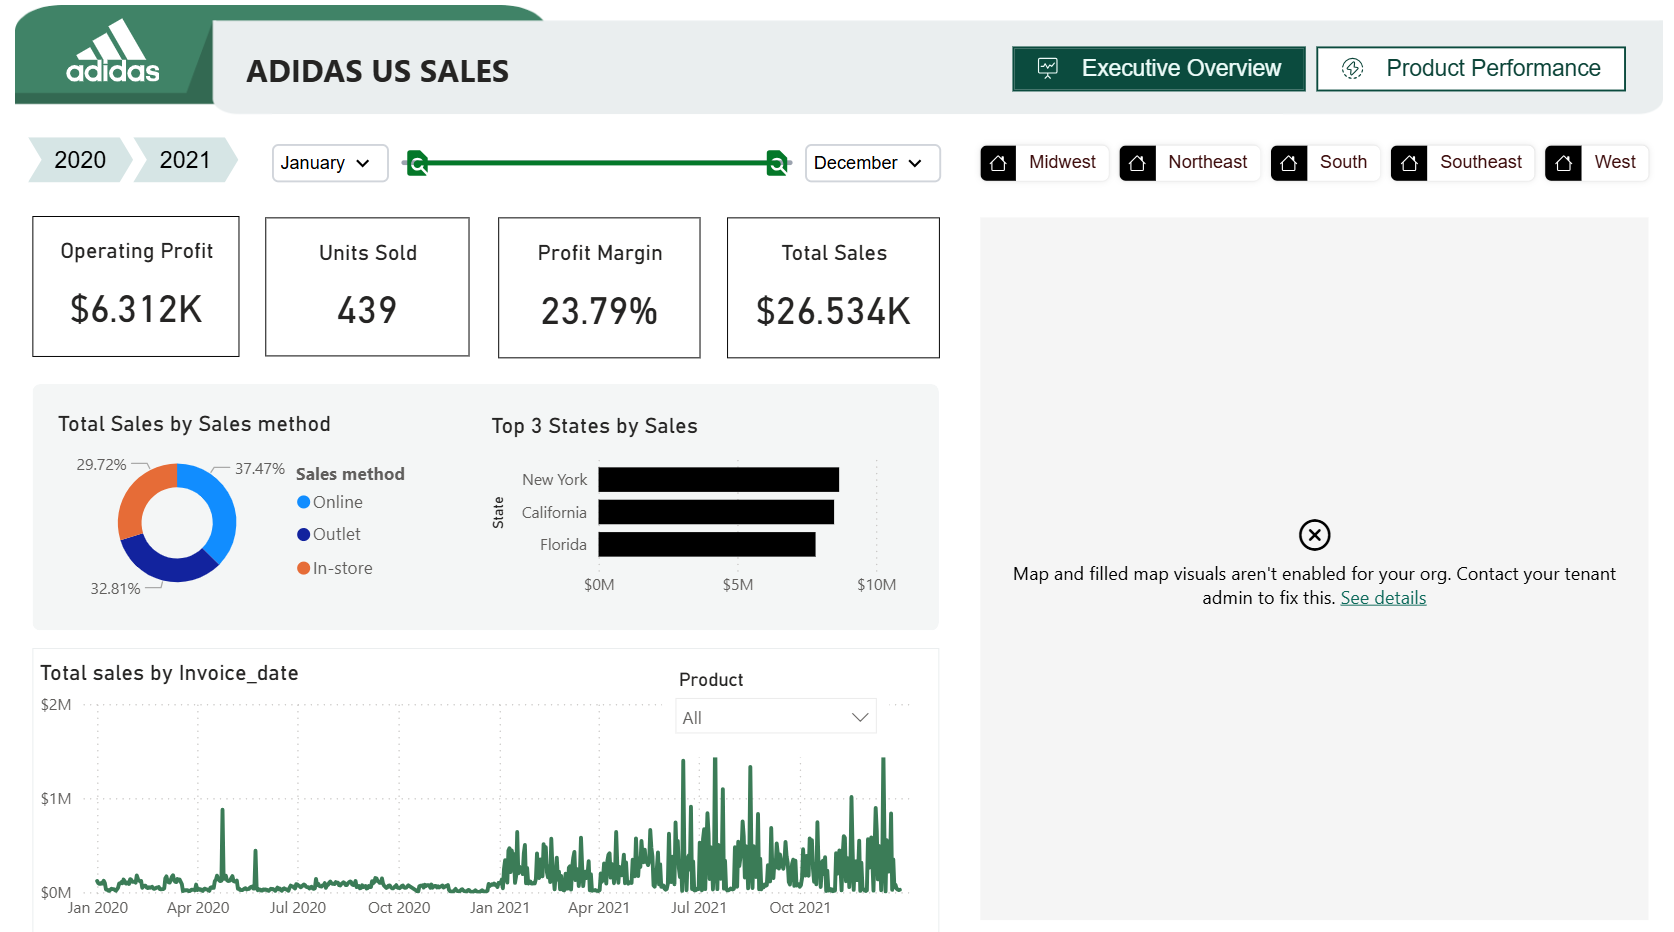
Adidas US Sales (2020–2021)
If you find this website helpful, share it with friends and colleagues to boost their Power BI skills and work efficiency!
Like this site? Share it