Power BI Christmas Sales & Trends Dashboard Template (Free PBIX Download)
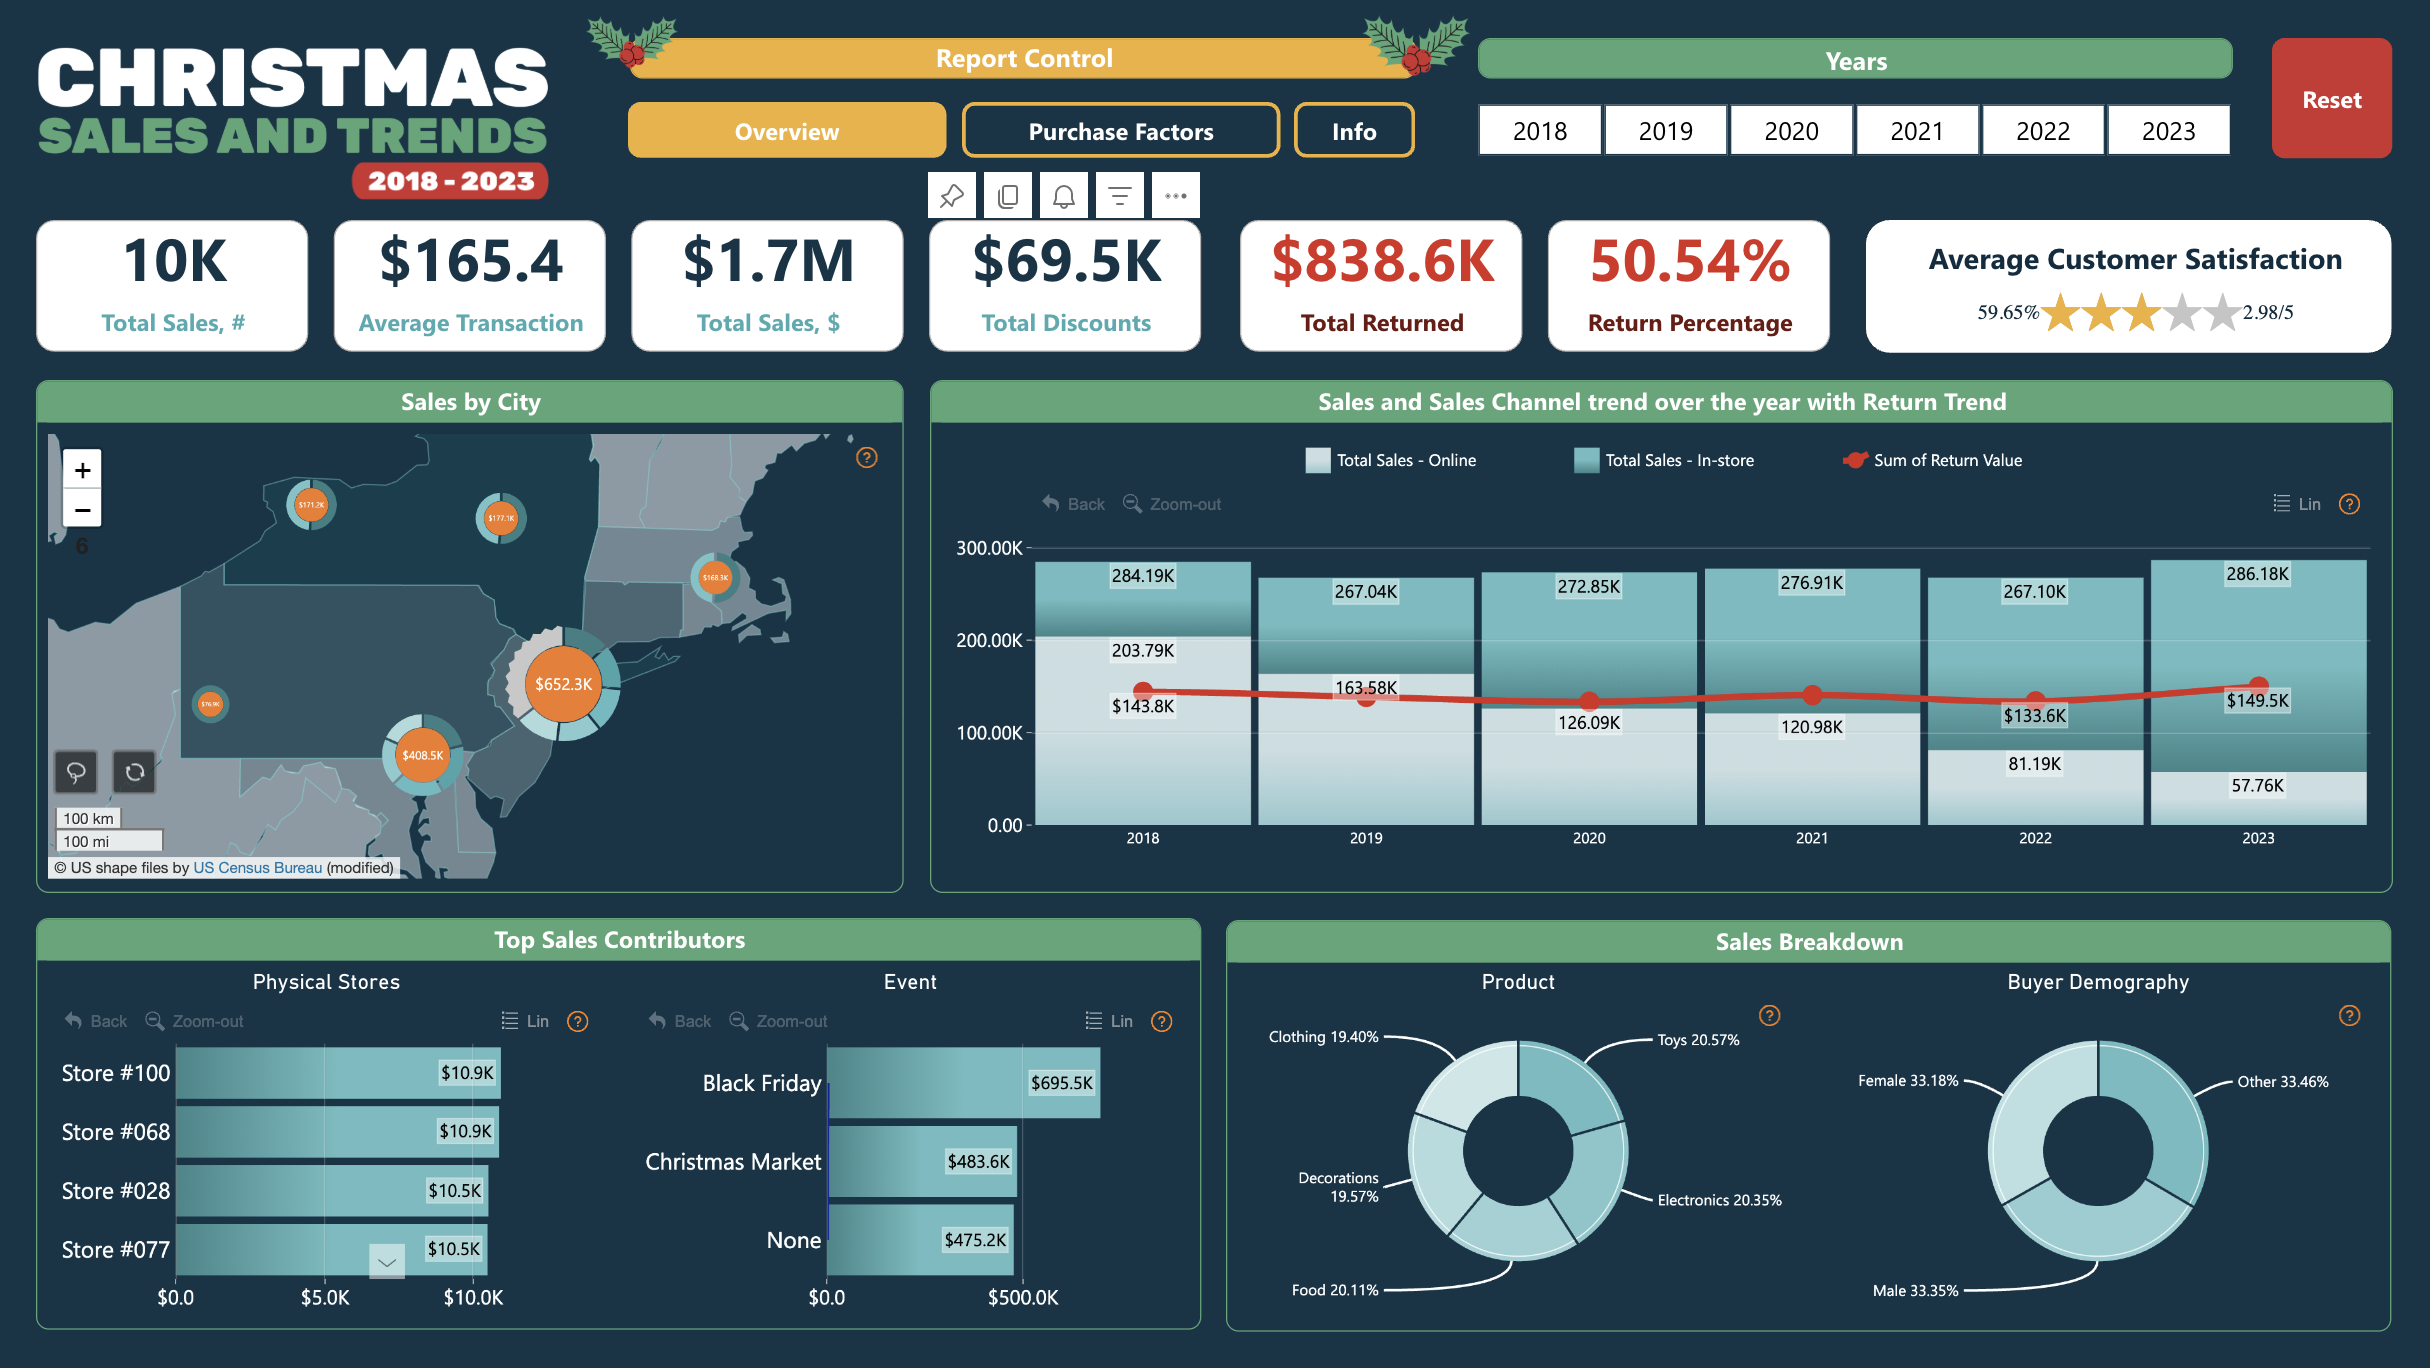
Introduction: This Power BI Christmas Sales dashboard tracks six years of holiday retail performance (2018–2023) across physical stores and online channels in the US Northeast market. Beyond standard sales KPIs, it surfaces two critical retail pain points often missing from generic dashboards: a 50.54% return rate that dwarfs total discounts, and a 2.98/5 customer satisfaction score that signals systemic quality or expectation gaps. Built for retail analysts and store operations teams who need seasonal performance visibility at both the executive and store level.
What's Inside This Template
Top KPI Banner
| MetricValueContext | ||
| Total Sales (volume) | 10K transactions | |
| Average Transaction | $165.4 | Mid-range retail basket size |
| Total Sales ($) | $1.7M | 6-year cumulative |
| Total Discounts | $69.5K | 4.1% of total revenue |
| Total Returned | $838.6K | 49.3% of total sales value |
| Return Percentage | 50.54% | Critical problem metric |
| Avg Customer Satisfaction | 2.98/5 (59.65%) | Below industry threshold |
The two red KPIs — $838.6K returned and 50.54% return rate — are the most important numbers on this dashboard and should drive the entire analytical conversation. Nearly half of all Christmas sales value is being returned. For context, the US retail industry average return rate is 16–18%; holiday-specific returns run 25–30%. A 50%+ rate is a severe operational and product problem, not normal seasonal behavior.
The $69.5K in discounts vs $838.6K in returns comparison is damning: the business spent 12x more value absorbing returns than it spent on discounts. Discounting is not the problem — product-market fit, gifting mismatches, or quality issues are.
Sales by City (Map Visual)
The geographic bubble map shows sales concentration across the US Northeast:
- Largest bubble: $652.3K — the dominant city, likely a major metro (position suggests NYC/Philadelphia corridor)
- Second cluster: $408.5K — secondary market
- Smaller bubbles: $177.8K, $171.0K, $113.2K — tertiary markets scattered across New England and Mid-Atlantic
The geographic concentration in a single market ($652.3K = 38% of total revenue) creates business risk — any local disruption (weather, competition, economic shock) disproportionately impacts overall performance. The drill-down capability allows store-level analysis within each city.
Sales and Sales Channel Trend Over the Years with Return Trend (2018–2023)
This is the most analytically dense visual in the dashboard. Three series tracked annually:
Online Sales (dark teal bars):
| YearOnline Sales | |
| 2018 | $284.19K |
| 2019 | $267.04K |
| 2020 | $272.85K |
| 2021 | $276.91K |
| 2022 | $267.10K |
| 2023 | $286.18K |
Online sales are remarkably stable — ranging from $267K to $286K with no clear growth trend over 6 years. This is stagnation, not maturity. A healthy online retail operation should show compound growth over this period, particularly given COVID-driven e-commerce acceleration in 2020–2021.
In-Store Sales (light teal bars):
| YearIn-Store Sales | |
| 2018 | $203.79K |
| 2019 | $163.58K |
| 2020 | $126.09K |
| 2021 | $120.98K |
| 2022 | $81.19K |
| 2023 | $57.76K |
In-store sales show a consistent, steep decline — down 72% from 2018 to 2023. This is not COVID-related alone; the decline started before 2020 and continued afterward. The business is losing physical retail relevance year over year with no signs of stabilization.
Return Value (red line):
| YearReturns | |
| 2018 | $143.8K |
| 2019 | $163.58K |
| 2020 | $126.09K |
| 2021 | $120.98K |
| 2022 | $133.6K |
| 2023 | $149.5K |
Returns track closely with total sales volume and show no improvement despite 6 years of data — the return problem is structural, not cyclical. The business has not made measurable progress reducing return rates over the entire analysis period.
The critical combined pattern: Total sales (online + in-store) is declining as in-store collapses, online stagnates, and returns consume an increasing share of net revenue. The business's effective realized revenue (gross sales minus returns) is shrinking faster than headline numbers suggest.
Top Sales Contributors
Physical Stores:
| StoreSales | |
| Store #100 | $10.9K |
| Store #068 | $10.9K |
| Store #028 | $10.5K |
| Store #077 | $10.5K |
Top stores are tightly clustered between $10.5K–$10.9K — no single store dramatically outperforms others. This suggests either a uniform store format with controlled inventory, or a ceiling effect where individual store sales are capped by footfall or inventory constraints. The tight clustering also means there's no star performer to learn from and scale.
Sales by Event:
| EventSales | |
| Black Friday | $695.5K |
| Christmas Market | $483.6K |
| None (no event) | $475.2K |
Black Friday generates $695.5K — 40.9% of all 6-year revenue in a single event type. This is extreme event dependency. Christmas Market ($483.6K) and non-event days ($475.2K) are nearly identical — meaning the Christmas Market events generate roughly the same incremental revenue as regular trading days. Black Friday is carrying the business; losing that event window would be catastrophic.
Sales Breakdown
By Product Category:
| CategoryShare | |
| Toys | 20.57% |
| Electronics | 20.35% |
| Food | 20.11% |
| Decorations | 19.57% |
| Clothing | 19.40% |
Product mix is almost perfectly uniform across all five categories — within a 1.2 percentage point range. This is either deliberate category management to maintain balance, or a sign that no category has achieved genuine differentiation or consumer pull. There is no hero category driving outsized performance. Combined with the 50% return rate, the uniform distribution makes it harder to isolate which category is driving returns.
By Buyer Demography:
| SegmentShare | |
| Male | 33.35% |
| Female | 33.18% |
| Other | 33.46% |
Gender split is statistically perfect thirds — Male, Female, and Other each at exactly one-third. This either reflects genuinely equal appeal across gender segments (unusual for Christmas retail) or a data generation/modeling artifact in the sample dataset. In real retail data, gender splits rarely distribute this evenly across a Christmas product mix that includes Toys, Clothing, and Electronics.
Key Insights
- A 50.54% return rate is the single most important business problem in this dataset. At $838.6K returned against $1.7M sold, the business's net realized revenue is closer to $861K — barely half of headline sales. No marketing or channel optimization will overcome a structural return problem of this magnitude. Root cause analysis by product category and channel is the immediate priority.
- In-store retail is in terminal decline — down 72% over 6 years with no stabilization signal. The business needs to decide whether to invest in physical store turnaround or accelerate the transition to online-only operations. Maintaining the current trajectory burns fixed costs against a shrinking revenue base.
- Online sales stagnation (flat $267K–$286K for 6 years) during the e-commerce growth era is a missed opportunity. The 2020–2021 period when global e-commerce surged 15–30% shows no corresponding lift in this dashboard — suggesting the online channel lacks the marketing investment, SEO presence, or UX quality to capture demand.
- Black Friday concentration creates existential event risk. 40.9% of all revenue from a single event type means one bad Black Friday — competitor pricing, supply chain disruption, weather, or economic shock — can collapse annual performance. Revenue diversification across events and months is structurally necessary.
- 2.98/5 customer satisfaction is a retention killer. Below 3.0 on a 5-point scale means the average customer experience is net negative. In Christmas retail where repeat gifting purchases are the primary retention mechanism, a sub-3.0 score means the business is not building the customer loyalty required to survive long-term without constant new customer acquisition.
- The uniform product category distribution (all within 1.2%) suggests no differentiation strategy. Successful specialty retailers build clear category dominance — a 20/20/20/20/20 split across Toys, Electronics, Food, Decorations, and Clothing indicates the business is a generalist competing against category specialists on every front simultaneously.
Who This Template Is For
- Retail Managers and Operations Directors tracking multi-store Christmas season performance across channels and events
- E-commerce and Omnichannel Analysts measuring the shift from in-store to online over multi-year periods
- BI Developers building seasonal retail dashboards that combine geographic, demographic, event-based, and channel dimensions in a single page
How to Use
- Download the PBIX file
- Open in Power BI Desktop
- Connect your retail transaction data — the model requires sales records with date, channel, store, product category, customer demographic, return flag, and event tag fields
- Use the Year buttons (2018–2023) and Report Control tabs (Overview, Purchase Factors, Info) to navigate between views
- All map bubbles, trend lines, and breakdown charts filter simultaneously
Soft CTA:
"Need a structured breakdown table showing sales, returns, and net revenue by store, category, and event — with variance columns and conditional formatting? Flexa Tables is a Microsoft-certified Power BI visual built for exactly this kind of multi-dimensional retail tabular reporting."
Other Templates
 Free Sales & Revenue
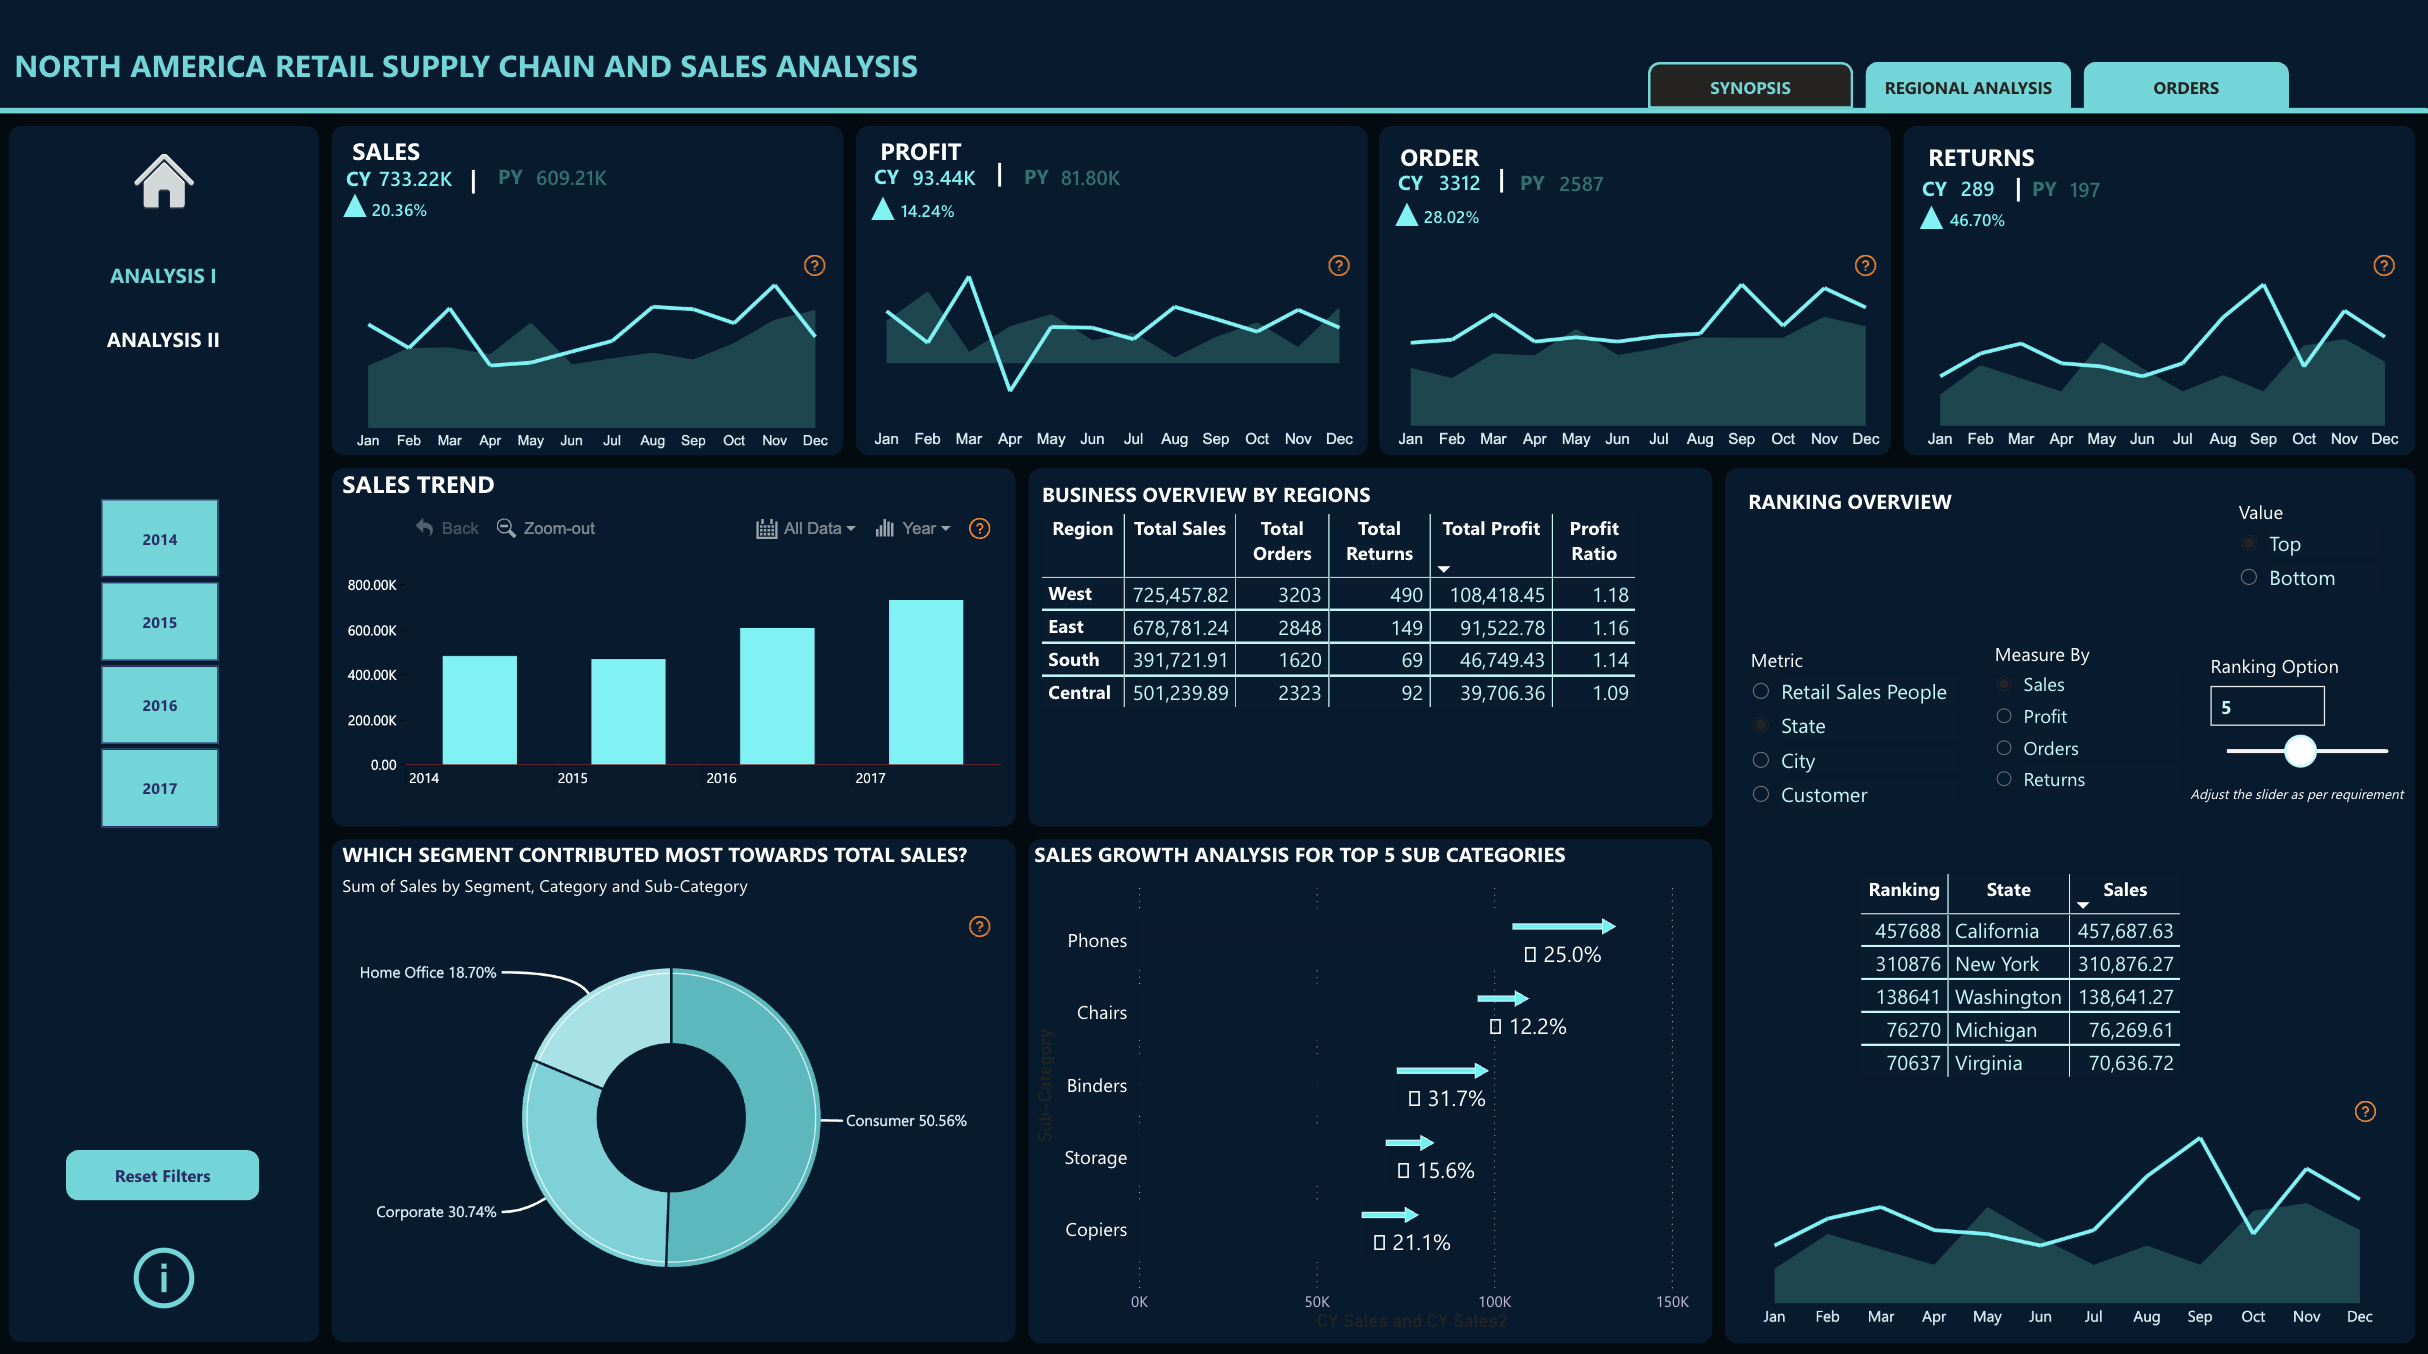
Power BI North America Retail Supply Chain and Sales Analysis Dashboard Template (Free PBIX Download)
 Free Sales & Revenue
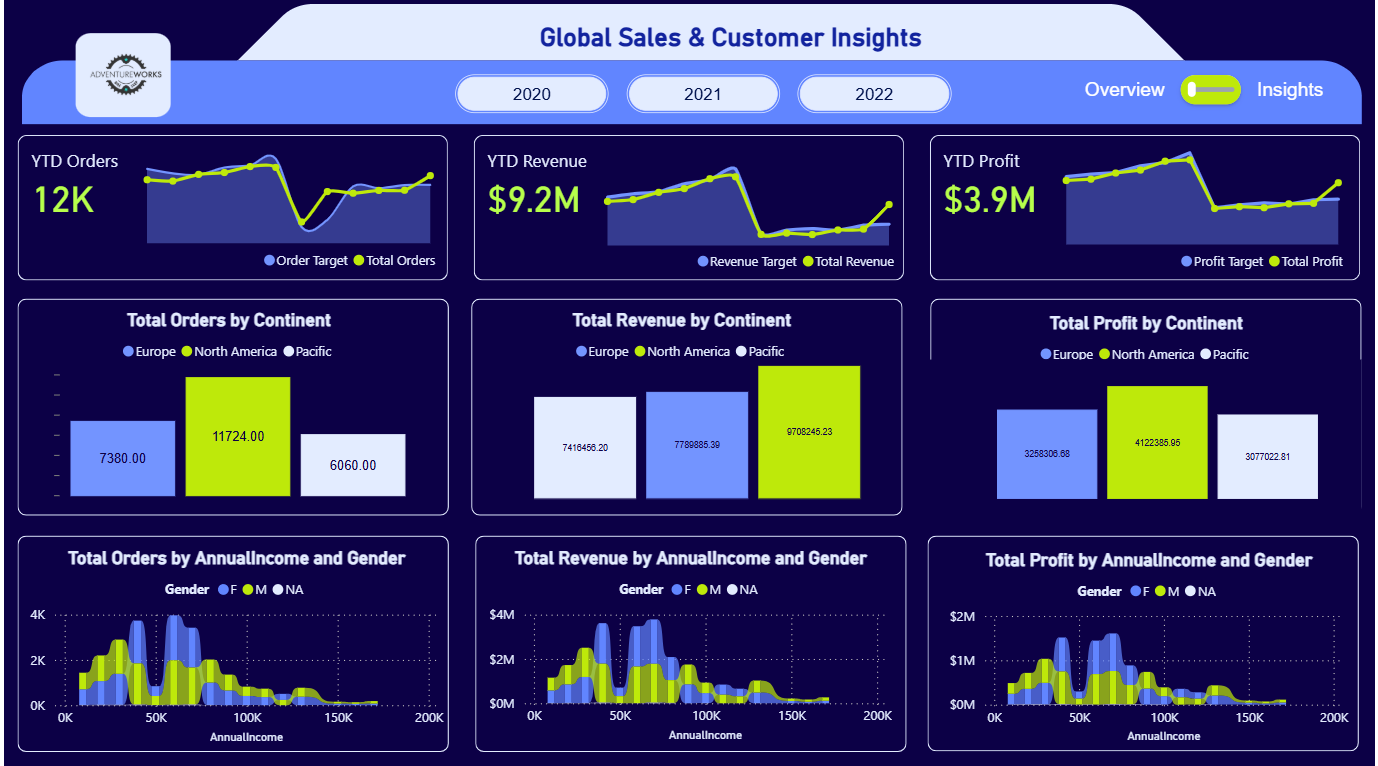
AdventureWorks Global Sales & Customer Insights Dashboard
 Free Sales & Revenue
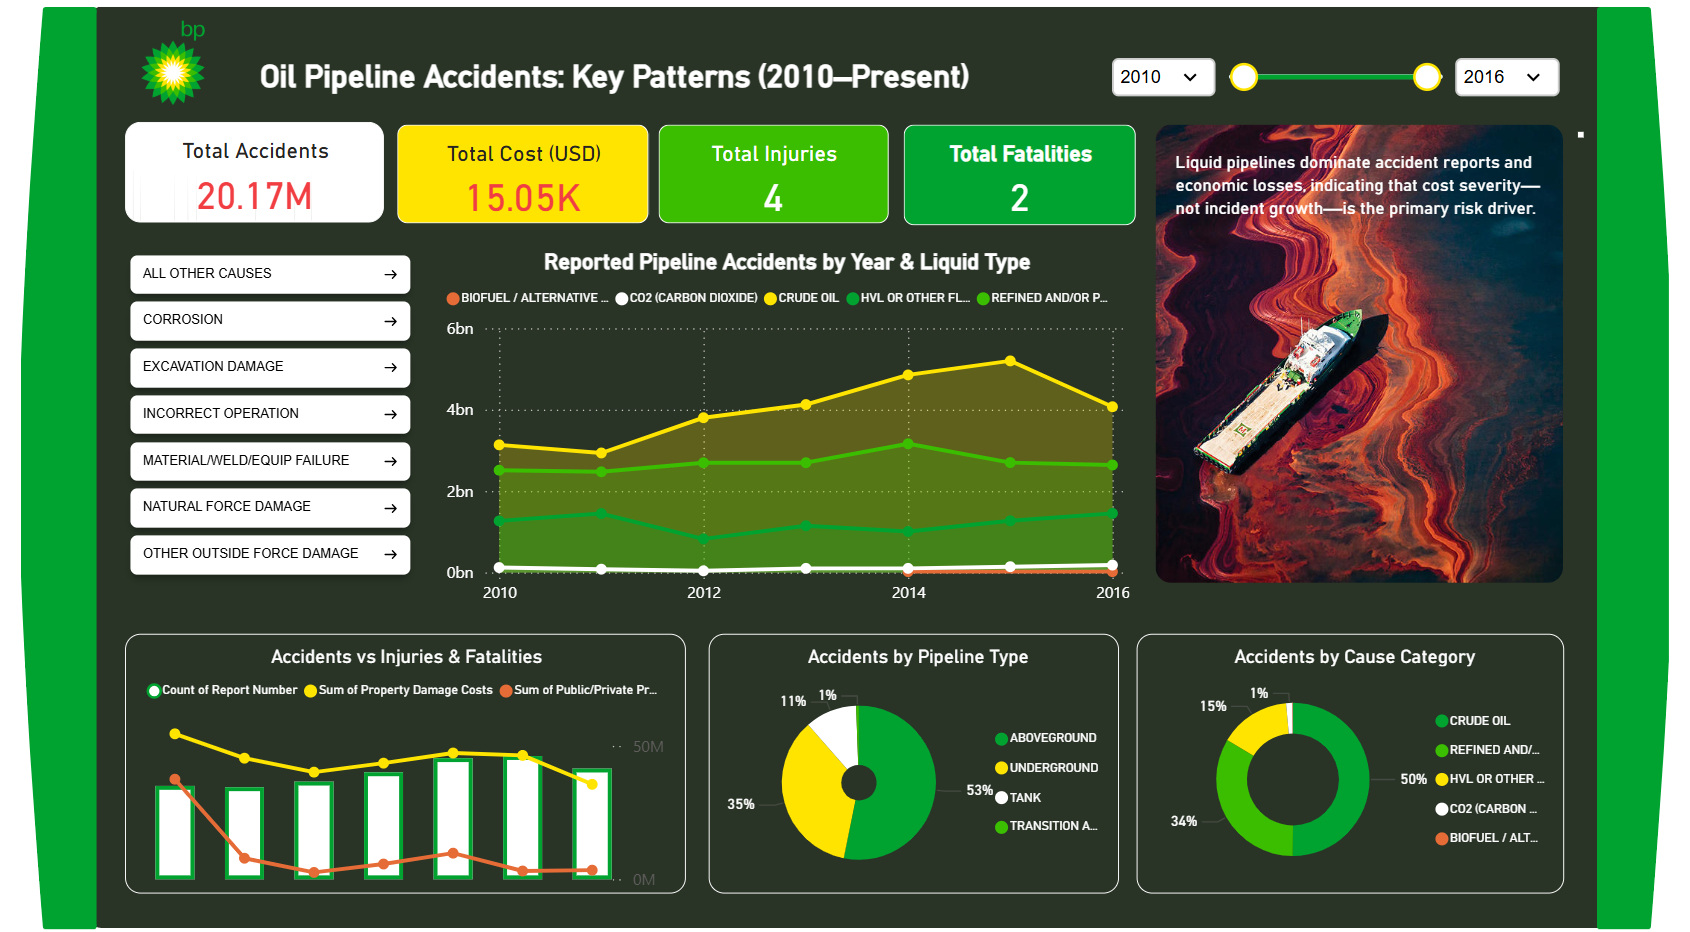
BP Oil Pipeline Accidents: Key Patterns (2010–Present) – Key Insights
If you find this website helpful, share it with friends and colleagues to boost their Power BI skills and work efficiency!
Like this site? Share it