Power BI Christmas Gift Sales Analysis Dashboard (Free PBIX Download)
Introduction
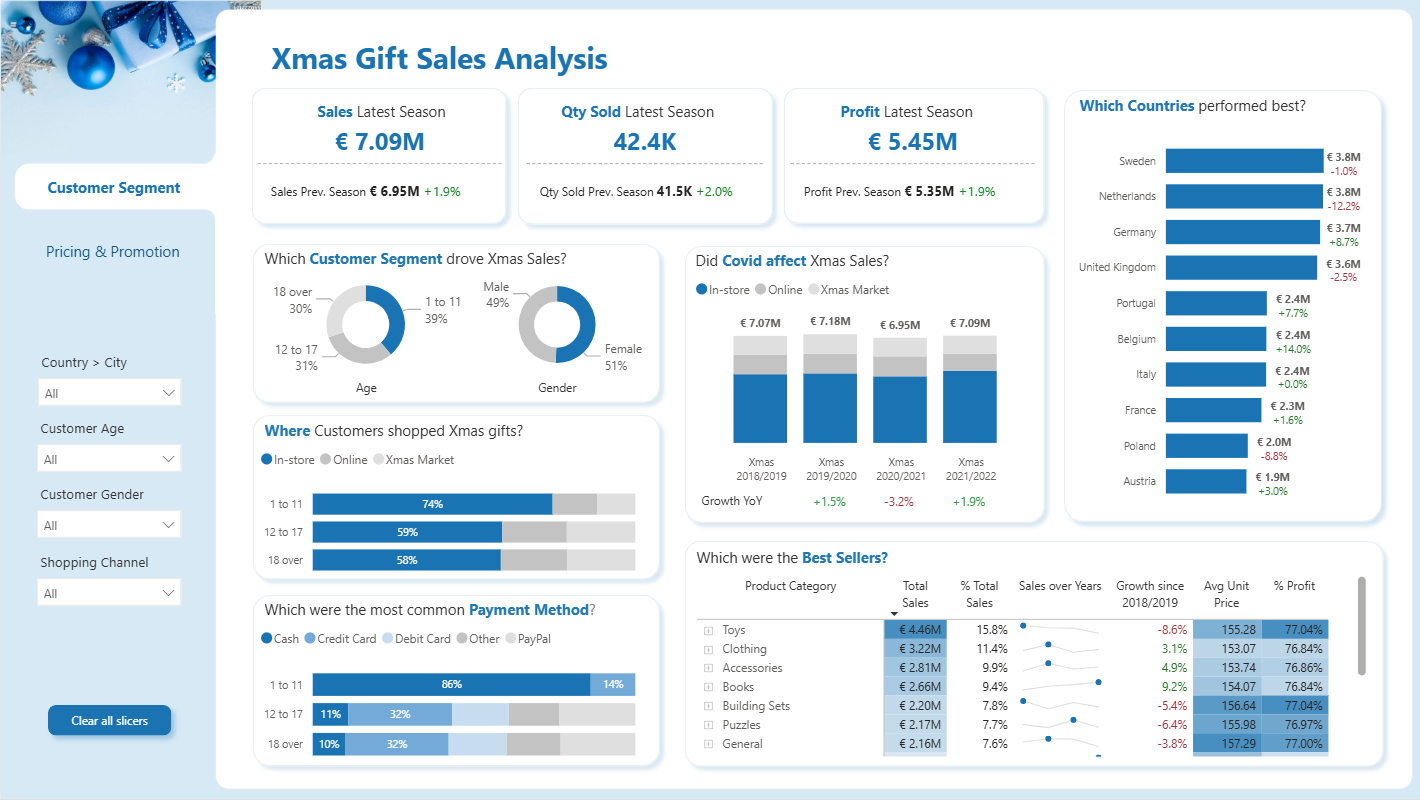
This free Power BI Christmas Gift Sales Analysis dashboard template gives retail and e-commerce teams a seasonal deep-dive into holiday sales performance — covering €7M+ in revenue across 10 European countries, 3 shopping channels, 7 product categories, and 4 years of Christmas seasons. It answers the questions every retail manager asks after the holiday rush: Who bought? Where? What sold? And did we grow?
Built with slicers for Country/City, Customer Age, Gender, and Shopping Channel — every visual updates simultaneously for instant segment-level answers.
What's Inside This Template
1. Top-Line KPI Cards — Latest Season Performance
| KPILatest SeasonPrevious SeasonYoY Growth | |||
| Total Sales | €7.09M | €6.95M | +1.9% |
| Qty Sold | 42.4K units | 41.5K units | +2.0% |
| Profit | €5.45M | €5.35M | +1.9% |
Growth is modest but consistent — sales, volume, and profit all grew in near-perfect lockstep at ~2%, suggesting stable pricing and no margin compression in the latest season. Profit margin is exceptionally high at ~77% (5.45M profit on 7.09M sales), indicating a premium product mix or strong brand pricing power.
2. Customer Segment Analysis — Who Drove Christmas Sales?
By Age Group:
| Age SegmentShare of Sales | |
| 1 to 11 | 39% |
| 12 to 17 | 31% |
| 18 over | 30% |
Children aged 1–11 are the dominant recipient segment at 39% — confirming this is primarily a toy/gift market targeting young children. The near-even split across all three age groups (39/31/30) means the product catalog is successfully serving all age demographics, not over-indexed on any single group.
By Gender:
- Female: 51% · Male: 49%
Gender split is virtually equal — no significant skew, which suggests broad product appeal across categories.
3. Where Did Customers Shop? (Channel by Age Segment)
In-store dominates across all age groups:
| Age GroupIn-storeOnlineXmas Market | |||
| 1 to 11 | 74% | — | 26% |
| 12 to 17 | 59% | — | 41% |
| 18 over | 58% | — | 42% |
The most striking finding: Online does not appear as a significant channel across any age group. In-store and Christmas Market are the two dominant channels. Younger children (1–11) are overwhelmingly bought for in-store (74%) — likely parents making deliberate in-person purchases for physical toys. Older segments (12–17 and 18+) show more willingness to shop at Christmas Markets (~40%).
Implication: This business is heavily physical-channel dependent — a risk factor for digital disruption, but also a signal that experiential in-store and market presence is a core competitive advantage.
4. Payment Method by Age Group
| Age GroupCashCredit CardOther Methods | |||
| 1 to 11 | 86% | 14% | ~0% |
| 12 to 17 | 11% | 32% | 57% |
| 18 over | 10% | 32% | 58% |
The payment method shift by age is dramatic:
- Parents buying for young children (1–11) pay 86% cash — likely impulse or market purchases
- Teen and adult buyers use diverse payment methods including debit cards, PayPal, and credit cards
- This has direct implications for checkout optimization: cash handling capacity at physical locations is critical for the 1–11 buyer segment
5. Did COVID Affect Christmas Sales? (4-Year Trend)
| SeasonTotal SalesYoY Growth | ||
| Xmas 2018/2019 | €7.07M | baseline |
| Xmas 2019/2020 | €7.18M | +1.5% |
| Xmas 2020/2021 | €6.95M | -3.2% ⚠️ |
| Xmas 2021/2022 | €7.09M | +1.9% ✅ |
COVID's impact is visible but contained: the 2020/2021 season (peak lockdown period across Europe) saw the only sales decline at -3.2%. Remarkably, the business recovered fully by 2021/2022 and surpassed pre-COVID levels — demonstrating strong demand resilience. The channel mix (In-store, Online, Xmas Market) shows visible shift in proportions during 2020/2021, which when clicked would reveal the online channel's contribution during lockdown periods.
6. Which Countries Performed Best?
| CountrySalesYoY Growth | ||
| Sweden | €3.8M | -1.0% ⚠️ |
| Netherlands | €3.8M | -12.2% ❌ |
| Germany | €3.7M | +8.7% ✅ |
| United Kingdom | €3.6M | -2.5% ⚠️ |
| Portugal | €2.4M | +7.7% ✅ |
| Belgium | €2.4M | +14.0% ✅ Best Growth |
| Italy | €2.4M | +0.0% — |
| France | €2.3M | +1.6% |
| Poland | €2.0M | -8.8% ❌ |
| Austria | €1.9M | +3.0% |
Three clear country stories emerge:
- Belgium is the standout winner — +14% growth, the highest in the portfolio. A market to double down on.
- Netherlands is the biggest concern — €3.8M in sales (second largest market) but -12.2% decline. Losing ground in a major market is a red flag requiring investigation.
- Germany quietly became the growth anchor — +8.7% with the third-highest absolute sales, Germany is emerging as the most reliable high-volume growth market.
7. Best-Selling Product Categories
| CategoryTotal Sales% of TotalGrowth Since 2018/19Avg Unit Price% Profit | |||||
| Toys | €4.46M | 15.8% | -8.6% ❌ | €155.28 | 77.04% |
| Clothing | €3.22M | 11.4% | +3.1% ✅ | €153.07 | 76.84% |
| Accessories | €2.81M | 9.9% | +4.9% ✅ | €153.74 | 76.86% |
| Books | €2.66M | 9.4% | +9.2% ✅ | €154.07 | 76.84% |
| Building Sets | €2.20M | 7.8% | -5.4% ❌ | €156.64 | 77.04% |
| Puzzles | €2.17M | 7.7% | -6.4% ❌ | €155.98 | 76.97% |
| General | €2.16M | 7.6% | -3.8% ❌ | €157.29 | 77.00% |
Critical observation: Profit margin is nearly identical across ALL categories (~77%) — this is not a differentiated margin business. Every category generates the same profitability ratio, meaning volume and growth rate are the only levers that matter for the bottom line.
Category growth winners vs. decliners:
- Books is the surprise growth leader at +9.2% — a non-traditional gift category quietly gaining share
- Toys — the #1 category by volume — is declining (-8.6%), which is a structural risk given it represents 15.8% of total sales
- Puzzles and Building Sets are both declining, suggesting physical puzzle/construction toys may be losing relevance in this market
Key Insights Summary
- 77% profit margin across every product category — uniform margins mean this business competes on volume and brand, not product mix optimization. Focus should be on growing top-line sales in high-growth markets.
- Toys is the largest category but declining — at -8.6% since 2018/2019, the #1 revenue driver is losing ground. Without a category revitalization strategy, total sales growth will remain constrained near 2%.
- Netherlands is bleeding at -12.2% — the second-largest market by sales is declining sharply. This single country drag is likely suppressing the overall portfolio growth rate.
- Belgium (+14%) and Germany (+8.7%) are the growth engines — resources, marketing spend, and inventory priority should tilt toward these markets.
- In-store is overwhelmingly dominant (74% for under-12 shoppers) — this business lives and dies by physical retail. Any disruption to in-store operations (weather, logistics, economic downturn) has outsized impact.
- COVID caused only a -3.2% dip and a full recovery in one year — demand resilience is strong. This is a confidence signal for investors and a proof point of brand loyalty.
- Books growing +9.2% suggests emerging consumer behavior shift — gifting experiences and educational content is gaining traction. An opportunity to expand the Books and educational product range.
Dashboard Navigation
This template includes 2 report pages:
| PageFocus | |
| Customer Segment | Demographics, channels, payment methods, COVID impact, country and product performance |
| Pricing & Promotion | Pricing analysis and promotional effectiveness (page 2) |
Available slicers: Country > City · Customer Age · Customer Gender · Shopping Channel
Who This Template Is For
| RoleUse Case | |
| Retail Sales Managers | Monitor seasonal performance across regions and channels instantly |
| Category Managers | Identify which product lines are growing or declining year-over-year |
| Marketing Teams | Understand customer demographics and channel preferences for campaign planning |
| BI Developers | Production-ready seasonal retail template — connect your data and deploy in hours |
How to Use This Template
- Download the PBIX file
- Open in Power BI Desktop
- Replace the sample dataset with your own sales data (Excel, SQL, or any supported connector)
- All visuals, slicers, and trend charts update automatically
- Publish to Power BI Service for stakeholder sharing ahead of the next holiday season
Upgrade Your Seasonal Reporting
Want to add dynamic year-over-year variance tables, conditional formatting by growth rate, and drill-through country pages to this dashboard? Explore Flexa Tables — a Microsoft-certified Power BI visual built for retail and financial reporting.
Tags
power bi christmas sales dashboard · retail sales dashboard power bi pbix · seasonal sales analysis power bi · power bi customer segment dashboard · holiday sales power bi template · power bi europe retail dashboard · product category profitability power bi · power bi covid impact analysis · free power bi retail template download · xmas gift sales power bi
Other Templates
 Free Sales & Revenue
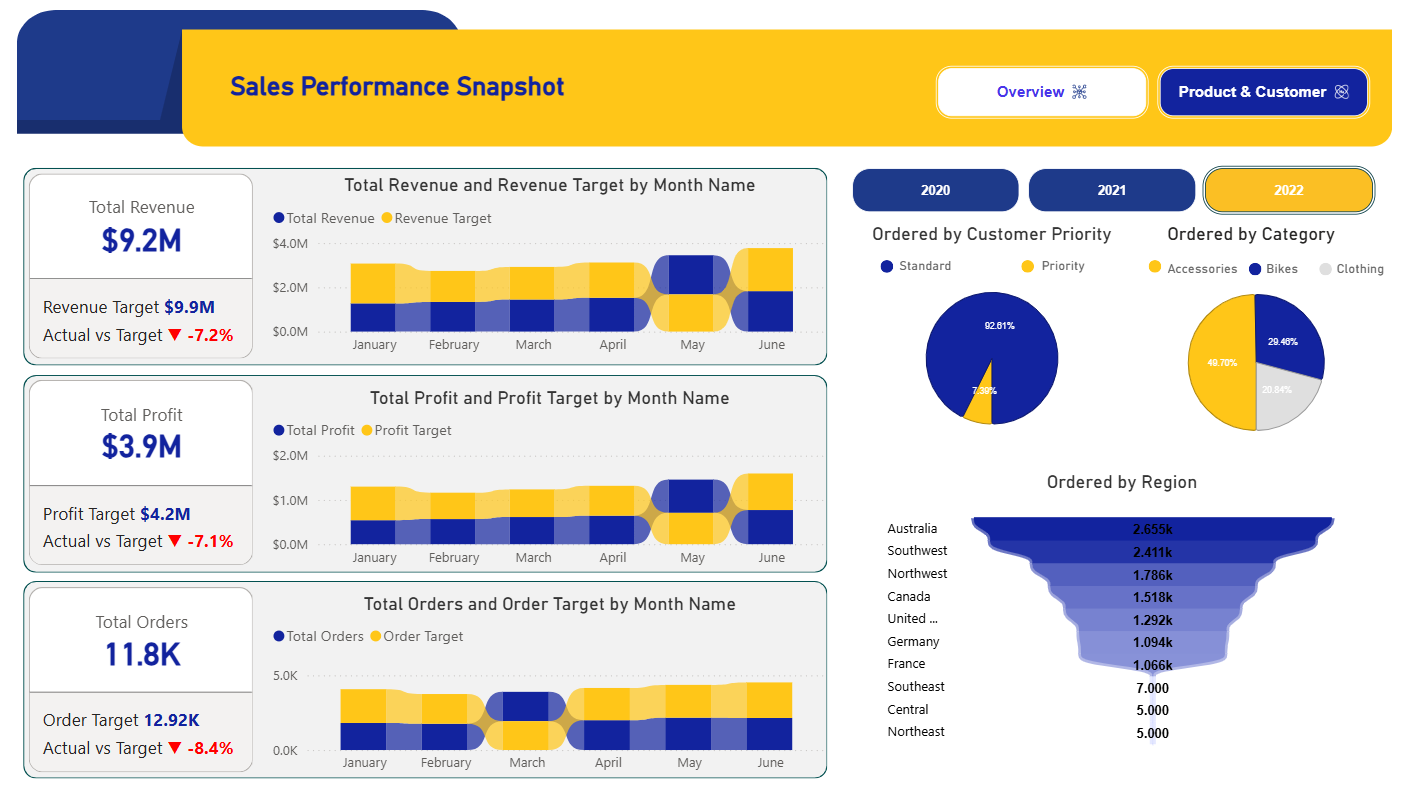
Sales Performance Snapshot dashboard
 Free Sales & Revenue
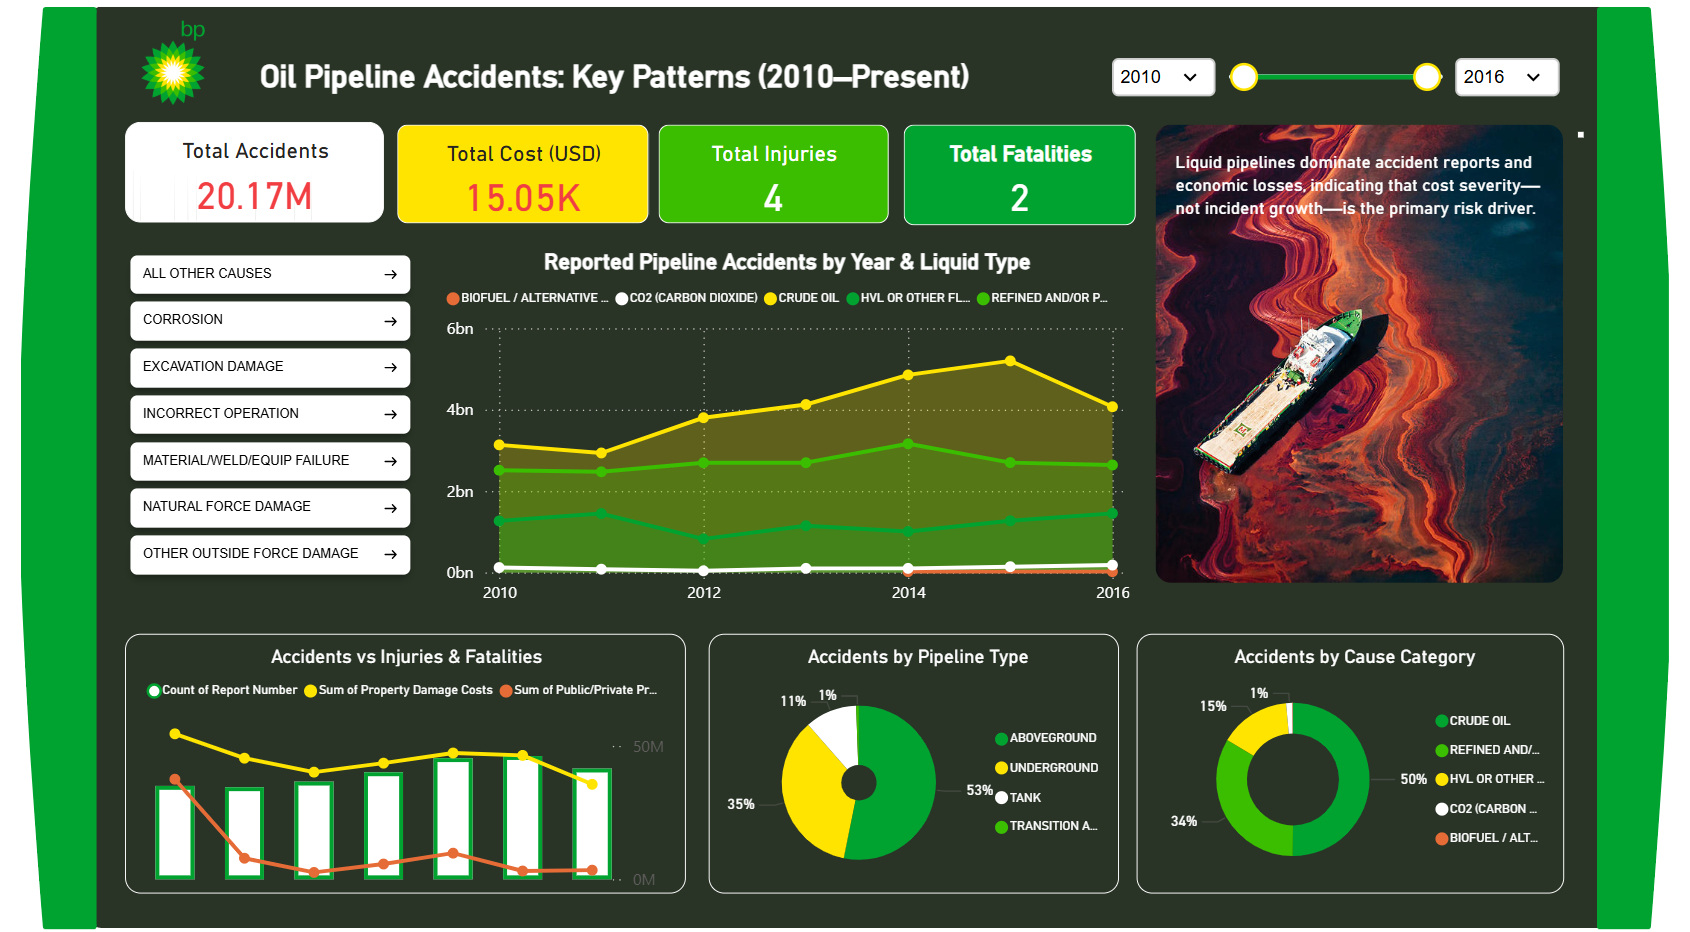
BP Oil Pipeline Accidents: Key Patterns (2010–Present) – Key Insights
 Free Sales & Revenue
Power BI Coffee Shop Sales Dashboard Template (Free PBIX Download)
If you find this website helpful, share it with friends and colleagues to boost their Power BI skills and work efficiency!
Like this site? Share it