Power BI Chocolate Sales Profitability Dashboard Template (Free PBIX Download)
Introduction: This is the same Awesome Chocolates brand from a prior dashboard in this gallery, but this template takes a fundamentally different analytical angle — instead of tracking revenue and units sold, it drills into shipment-level profitability: which products, box sizes, teams, and geographies generate profitable shipments versus loss-making ones. With a cocoa price trend overlay and a dual-column profitable/unprofitable shipment breakdown table, it is the reference template for FMCG operations and supply chain analysts who need to identify where the business is pricing incorrectly or shipping inefficiently.
What's Inside This Template
Top KPI Strip (7 metrics, tab-selectable)
| MetricValue | |
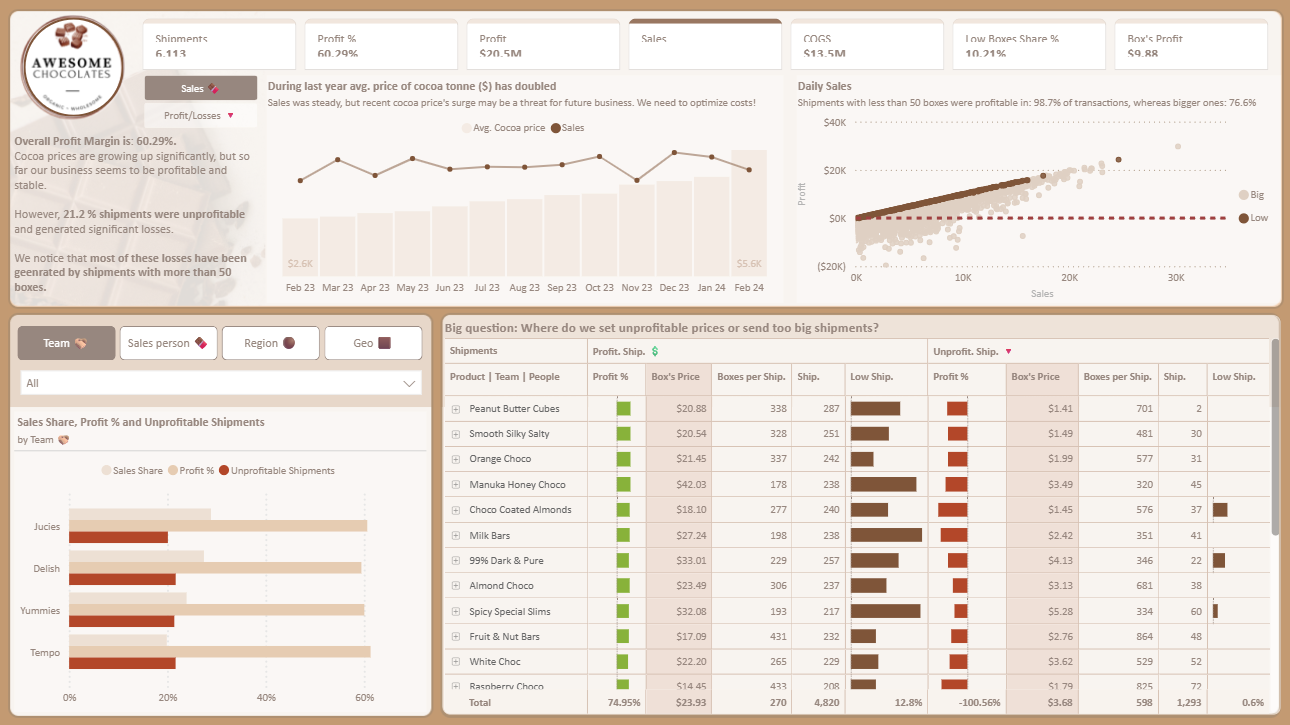
| Shipments | 6,113 |
| Profit % | 60.29% |
| Profit | $20.5M |
| Sales | (active tab) |
| COGS | $13.5M |
| Low Boxes Share % | 10.21% |
| Box's Profit | $9.88 |
Low Boxes Share % at 10.21% — only 10.21% of shipments are "Low Box" (under 50 boxes). Despite being a minority by count, the scatter plot reveals they are the most reliably profitable segment. Box's Profit at $9.88 is the average profit per box across all shipments.
Narrative Text Panel (left): The dashboard includes an embedded analytical narrative — a feature rarely seen in standard Power BI templates:
"Overall Profit Margin is 60.29%. Cocoa prices are growing up significantly, but so far our business seems to be profitable and stable. However, 21.2% shipments were unprofitable and generated significant losses. We notice that most of these losses have been generated by shipments with more than 50 boxes."
This pre-written insight text updates dynamically with filters — making it a management commentary layer built directly into the report, not a static annotation.
Cocoa Price vs Sales Trend (Feb 2023 – Feb 2024)
The dual-axis line chart tracks Average Cocoa Price (line) against Sales (bars) monthly:
| MonthSales (approx) | |
| Feb 23 | $2.6K (low point) |
| Mar–Oct 23 | Gradual increase |
| Nov–Dec 23 | Acceleration |
| Jan–Feb 24 | $5.6K (high point) |
The cocoa price line shows a steady upward climb throughout the period — the narrative confirms "during last year avg price of cocoa tonne ($) has doubled." Sales bars grow alongside cocoa prices, suggesting the business has been able to pass cost increases through to pricing — so far. The critical forward-looking question embedded in the dashboard subtitle is explicit: "Sales was steady, but recent cocoa price's surge may be a threat for future business. We need to optimize costs!"
This is a leading indicator dashboard — it is telling management that current profitability is intact but the cocoa cost trajectory, if unchecked, will compress margins in future periods. The template is designed to trigger cost optimization conversations before they become crisis conversations.
Daily Sales Scatter Plot — Profitable vs Unprofitable Shipments
The scatter plot is the most analytically powerful visual in the dashboard. It maps individual shipments by Sales (x-axis) vs Profit (y-axis), coded by box size:
- Low (gray dots, <50 boxes): Tightly clustered above the break-even line, trending upward — 98.7% of Low shipments are profitable
- Big (brown dots, >50 boxes): Scattered widely both above and below the break-even line — 76.6% of Big shipments are profitable (implying 23.4% are loss-making)
The dashed red line = break-even (Profit = $0). Everything below it is a loss-generating shipment.
The 21.6pp profitability gap between Low (98.7%) and Big (76.6%) shipments is the central operational finding of the entire dashboard. Large shipments carry 4.7x higher loss probability than small shipments. This is the "big question" the bottom table directly addresses.
Sales Share, Profit % and Unprofitable Shipments by Team
| TeamSales ShareProfit %Unprofitable Shipments | |||
| Jucies | ~55% | ~25% | ~22% |
| Delish | ~30% | ~20% | ~18% |
| Yummies | ~25% | ~15% | ~12% |
| Tempo | ~60% | ~20% | ~20% |
Tempo has the highest sales share (~60%) but their unprofitable shipment rate tracks closely to Jucies — meaning Tempo's volume dominance comes with proportional loss exposure. Yummies has the lowest unprofitable shipment rate (~12%) despite modest sales share — suggesting better pricing discipline or shipment size management within that team. The three-metric overlay (Sales Share, Profit%, Unprofitable Shipments) allows managers to identify which teams are growing revenue at the cost of margin discipline vs growing profitably.
Filter tabs: Team | Sales Person | Region | Geo — full drill-down hierarchy from team to individual rep to geography.
Big Question Table: Profitable vs Unprofitable Shipments by Product
This is the most operationally dense visual in the dashboard — a dual-section table showing profitable shipment metrics alongside unprofitable shipment metrics for the same product, enabling direct comparison of pricing and volume behavior between the two shipment types.
Profitable Shipments (left):
| ProductProfit %Box's PriceBoxes/Ship.ShipmentsLow Ship. | |||||
| Peanut Butter Cubes | ✓ green | $20.88 | 338 | 287 | ▬ |
| Smooth Silky Salty | ✓ green | $20.54 | 328 | 251 | ▬ |
| Orange Choco | ✓ green | $21.45 | 337 | 242 | ▬ |
| Manuka Honey Choco | ✓ green | $42.03 | 178 | 238 | ▬ |
| Choco Coated Almonds | ✓ green | $18.10 | 277 | 240 | ▬ |
| Milk Bars | ✓ green | $27.24 | 198 | 238 | ▬ |
| 99% Dark & Pure | ✓ green | $33.01 | 229 | 257 | ▬ |
| Almond Choco | ✓ green | $23.49 | 306 | 237 | ▬ |
| Spicy Special Slims | ✓ green | $32.08 | 193 | 217 | ▬ |
| Fruit & Nut Bars | ✓ green | $17.09 | 431 | 232 | ▬ |
| White Choc | ✓ green | $22.20 | 265 | 229 | ▬ |
| Raspberry Choco | ✓ green | $14.45 | 433 | 208 | ▬ |
| Total | 74.95% | $23.93 | 270 | 4,820 | 12.8% |
Unprofitable Shipments (right):
| ProductProfit %Box's PriceBoxes/Ship.ShipmentsLow Ship. | |||||
| Peanut Butter Cubes | ✗ red | $1.41 | 701 | 2 | — |
| Smooth Silky Salty | ✗ red | $1.49 | 481 | 30 | — |
| Orange Choco | ✗ red | $1.99 | 577 | 31 | — |
| Manuka Honey Choco | ✗ red | $3.49 | 320 | 45 | ▬ |
| Choco Coated Almonds | ✗ red | $1.45 | 576 | 37 | ▬ |
| Milk Bars | ✗ red | $2.42 | 351 | 41 | — |
| 99% Dark & Pure | ✗ red | $4.13 | 346 | 22 | ▬ |
| Almond Choco | ✗ red | $3.13 | 681 | 38 | — |
| Spicy Special Slims | ✗ red | $5.28 | 334 | 60 | ▬ |
| Fruit & Nut Bars | ✗ red | $2.76 | 864 | 48 | — |
| White Choc | ✗ red | $3.62 | 529 | 52 | — |
| Raspberry Choco | ✗ red | $1.79 | 825 | 72 | — |
| Total | -100.56% | $3.68 | 598 | 1,293 | 0.6% |
Key Insights
- The Box's Price gap between profitable and unprofitable shipments is the central pricing failure: $23.93 vs $3.68 — a 6.5x difference for the same products. Every product in the table appears on both sides — profitable and unprofitable. The difference is not the product; it is the price per box charged. Unprofitable shipments are being sold at $3.68/box average versus $23.93/box for profitable shipments of identical products. This is a pricing execution problem, not a product problem — sales agents are discounting certain large shipments to levels that guarantee losses. Raspberry Choco profitable: $14.45/box. Raspberry Choco unprofitable: $1.79/box — 8.1x underpriced.
- Unprofitable shipments average 598 boxes vs 270 boxes for profitable ones — a 2.2x size difference that perfectly explains the scatter plot finding. Large shipments (>50 boxes) generate losses not because of COGS — the product hasn't changed — but because agents are applying deep volume discounts to win large orders, dropping price per box below the cost threshold. The business needs a minimum price floor by product that prevents any shipment from being priced below break-even regardless of volume, enforced at the order entry stage.
- 21.2% of 6,113 shipments = 1,293 loss-making shipments generating a -100.56% combined profit margin on $3.68/box. The 1,293 unprofitable shipments are not just zero-contribution — they are actively destroying value. At $9.88 average box profit across the full portfolio, every unprofitable shipment that could be repriced or refused would add directly to bottom-line profit. If only half of the 1,293 unprofitable shipments were repriced to the profitable average ($23.93/box at 598 avg boxes), the revenue recovery would be approximately: 646 × 598 × ($23.93 − $3.68) = ~$7.9M in additional profit.
- Cocoa price doubling in 12 months while sales held steady means the business absorbed cost inflation through margin compression, not price increases. Profit % at 60.29% today was almost certainly higher 12 months ago when cocoa cost was half the current level. The trend line showing cocoa prices still rising through Feb 2024 means this compression is not over. The "optimize costs" call to action in the dashboard narrative is urgent — without either price increases or shipment size management, the 60.29% margin will erode further in the next 12 months.
- Fruit & Nut Bars and Raspberry Choco have the highest unprofitable shipment counts (48 and 72 respectively) AND the highest boxes-per-unprofitable-shipment (864 and 825). These two products are the primary loss generators by volume exposure: the most shipments, the largest shipment sizes, and the deepest per-box pricing failures. They should be the first two products to receive minimum price floor enforcement. Combined, they account for 120 of 1,293 unprofitable shipments (9.3%) but likely represent a disproportionate share of total loss value given their 800+ box average size.
- Yummies team's lower unprofitable shipment rate (~12% vs ~22% for Jucies) with comparable sales share suggests a team-level pricing discipline difference. Either Yummies managers enforce better price floors, their sales reps have less discount authority, or their customer mix skews toward smaller orders that naturally avoid the big-shipment loss zone. Regardless of cause, Yummies' shipment management approach should be studied and replicated as the internal best practice model for other teams.
Who This Template Is For
- Sales Operations Managers and Commercial Finance Analysts at FMCG, food manufacturing, or wholesale distribution companies who need to identify where pricing execution is generating losses at the shipment level — not just at the aggregate revenue level — enabling targeted intervention on specific products, agents, and order types
- Supply Chain and Logistics Directors tracking the relationship between shipment size, box count, and profitability to establish minimum order thresholds, price floors by product tier, and volume discount guardrails that prevent loss-making large shipments
- BI Developers building cost and margin management dashboards for branded goods manufacturers who need a production-ready template combining commodity cost trend tracking, scatter-plot shipment profitability visualization, team-level unprofitable shipment analysis, and dual-column profitable/unprofitable product comparison tables
How to Use
- Download the PBIX file
- Open in Power BI Desktop
- Connect your shipment transactions data source — the model requires a shipments table with date, product, team, sales person, region, geography, boxes shipped, box price, revenue, COGS, profit, and shipment size category (Low <50 / Big >50) fields; cocoa price data requires a separate commodity price table linked by date
- Use the Team, Sales Person, Region, and Geo filter tabs to cross-segment the scatter plot, team bar chart, and product comparison table; the narrative text panel updates automatically to reflect the filtered portfolio's profitability metrics
"The profitable vs unprofitable shipment comparison table in this dashboard uses a native Power BI matrix. To display all 12 products with expandable team and sales rep hierarchies, variance columns showing profitable vs unprofitable box price gaps per product, and conditional formatting auto-flagging any product where unprofitable shipment count exceeds a threshold — Flexa Tables is a Microsoft-certified Power BI visual purpose-built for structured product profitability reporting with full drill-down and formatting control."
Other Templates
 Free Sales & Revenue
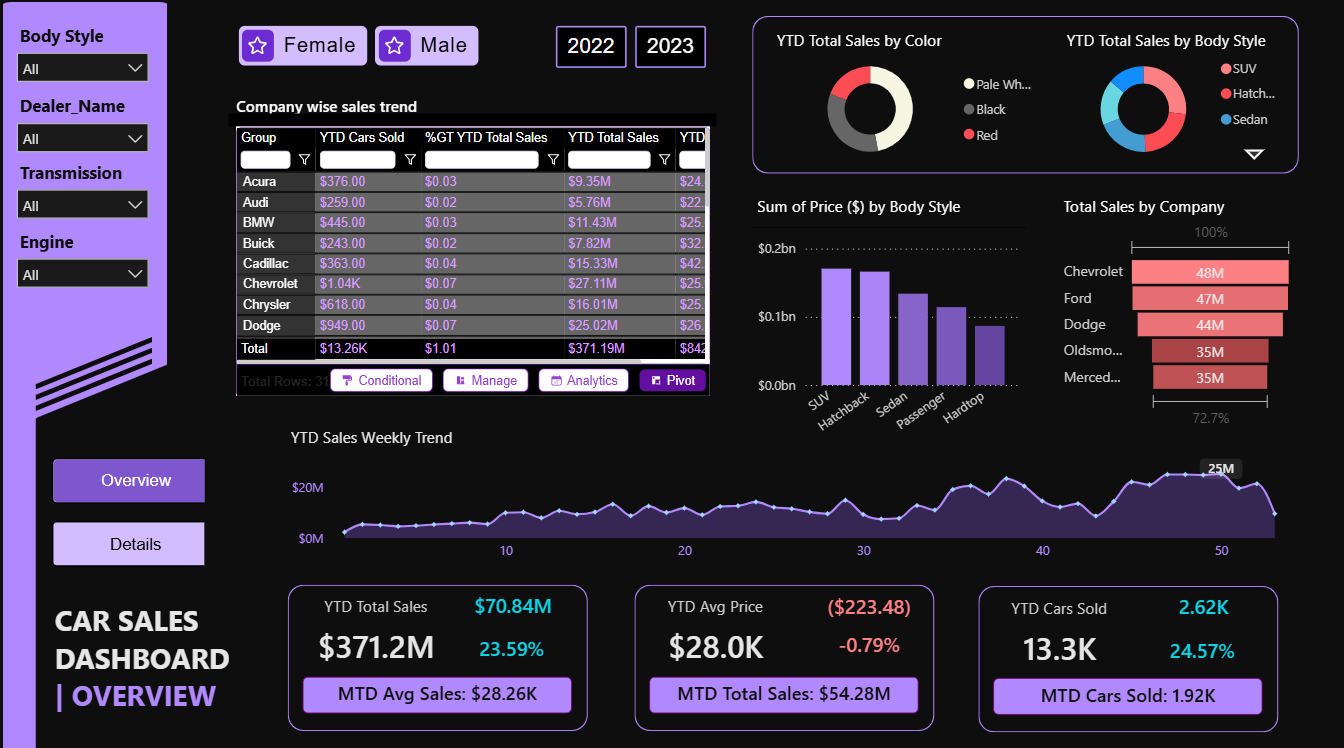
Car Sales Dashboard – Key Insights (YTD 2023)
 Free Sales & Revenue
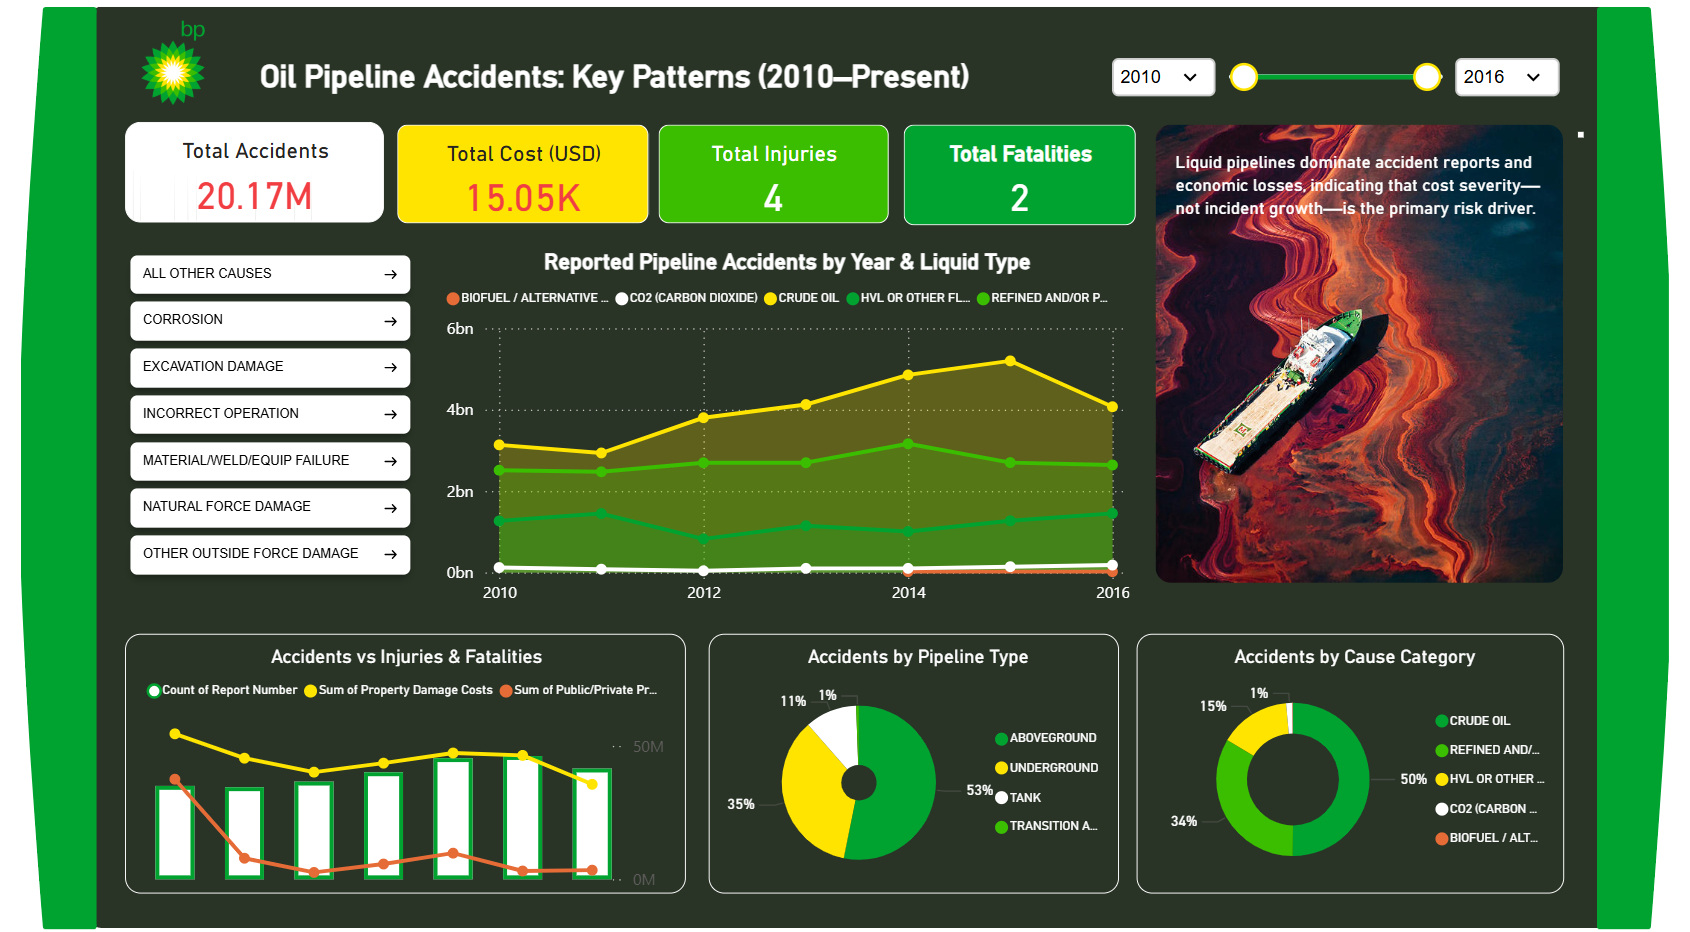
BP Oil Pipeline Accidents: Key Patterns (2010–Present) – Key Insights
 Free Sales & Revenue
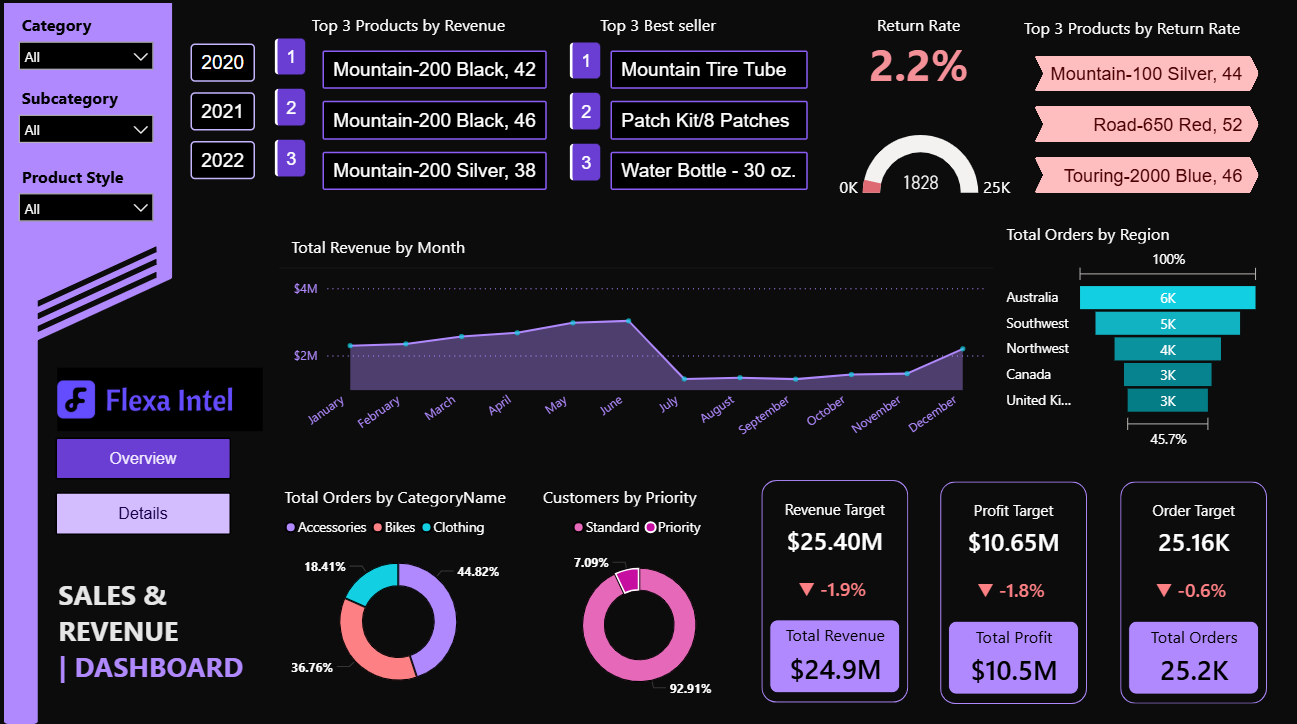
Sales & Revenue Dashboard – Key Insights (Full Year 2022)
If you find this website helpful, share it with friends and colleagues to boost their Power BI skills and work efficiency!
Like this site? Share it