Power BI Apple App Store Analytics Dashboard Template (Free PBIX Download)
Introduction: This Power BI dashboard analyzes 16,847 iOS apps from the Apple App Store dataset, covering the full lifecycle of the mobile app economy from its launch in 2008 through 2019. It tracks app volume growth, pricing strategy distribution, developer productivity, genre dominance, review behavior, and language reach — making it a strong reference template for product analysts, app marketers, and BI developers working with marketplace or catalog datasets.
What's Inside This Template
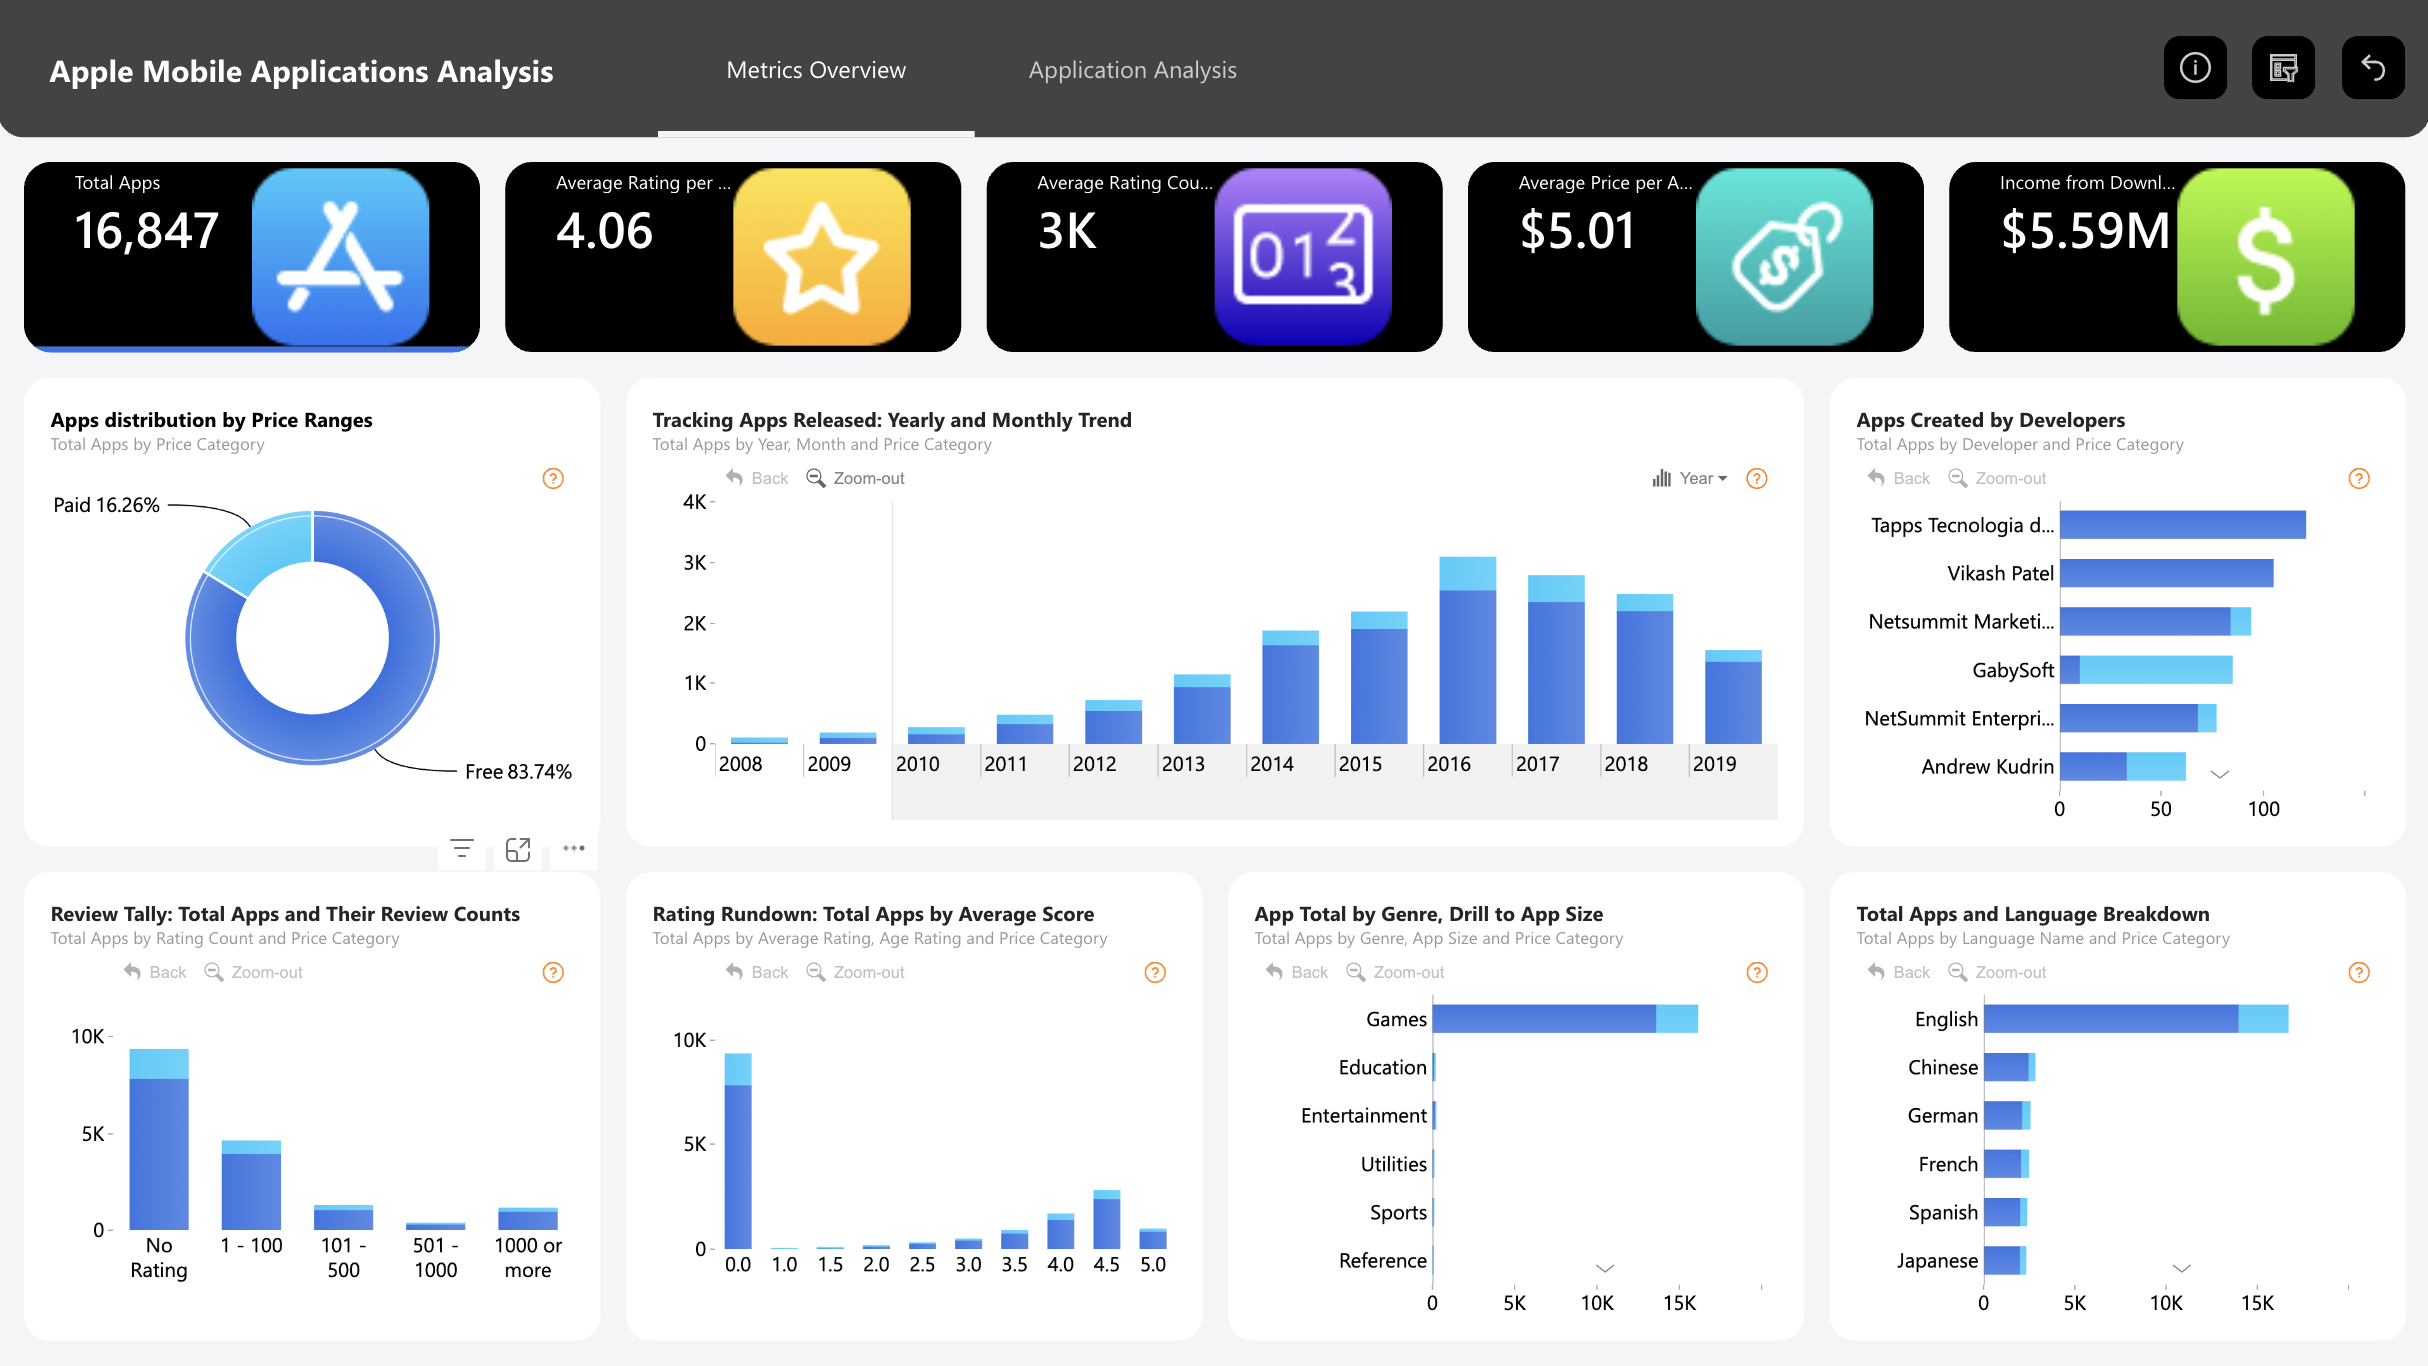
Top KPI Banner
| MetricValue | |
| Total Apps | 16,847 |
| Average Rating | 4.06 |
| Average Rating Count | 3K |
| Average Price | $5.01 |
| Income from Downloads | $5.59M |
Three things stand out immediately: a 4.06 average rating is high — App Store ratings are notoriously polarized (users rate when angry or delighted), so a 4+ average across 16K apps suggests the dataset skews toward established, quality apps rather than the full long tail. The $5.01 average price is misleading because 83.74% of apps are free — the average is being pulled up by a small number of high-priced paid apps. And $5.59M total income across 16,847 apps works out to roughly $332 per app lifetime — confirming that most revenue concentrates in a small percentage of apps.
Apps Distribution by Price Range
- Free: 83.74%
- Paid: 16.26%
The freemium dominance reflects the post-2012 App Store shift where in-app purchases replaced upfront pricing as the primary monetization model. The 16.26% paid share likely includes productivity tools, professional utilities, and niche apps where users accept upfront cost for specific functionality. The Revenue tab presumably breaks down whether paid apps actually outperform free apps in total income — a question this chart alone cannot answer.
Tracking Apps Released: Yearly and Monthly Trend (2008–2019)
The release volume chart tells the story of the App Store's growth arc in three phases:
- 2008–2012: Near-zero to minimal releases — the App Store was new, developer tooling was immature, and the developer community was small. Bars are essentially flat below 500/year
- 2013–2016: Exponential growth — release volume jumps from ~1K to ~3.8K per year, peaking around 2016–2017 at approximately 3,800–3,900 apps. This is the gold rush era of mobile app development
- 2017–2019: Sharp decline — volume drops from ~2,900 in 2018 to ~1,200 in 2019. This reflects market saturation, Apple's stricter app review policies post-2017, and consolidation around fewer, higher-quality submissions
The 2019 drop to ~1,200 is the steepest single-year decline in the dataset — likely also a data collection cutoff artifact rather than a true market collapse.
The drill-down from Year to Month allows analysts to identify seasonal submission patterns within each year.
Apps Created by Developers
Top 6 developers by app count:
| DeveloperApps | |
| Tapps Tecnologia d... | ~105 |
| Vikash Patel | ~90 |
| Netsummit Marketi... | ~75 |
| GabySoft | ~70 |
| NetSummit Enterpri... | ~65 |
| Andrew Kudrin | ~55 |
All six are indie developers or small studios, not major publishers. Apple, Google, Microsoft, Facebook — none appear in the top 6. This is consistent with the App Store's long-tail structure: the top publishers by revenue (EA, Supercell, Tencent) release fewer but higher-revenue titles, while prolific indie developers generate volume through template-based or localized apps. Tapps Tecnologia is a Brazilian mobile studio known for high-volume casual game production — their presence at #1 is consistent with their known publishing strategy.
Review Tally: Total Apps and Their Review Counts
| Review Count BucketApp Count | |
| No Rating | ~8.5K (majority) |
| 1–100 | ~4.5K |
| 101–500 | ~1.8K |
| 501–1,000 | ~400 |
| 1,000 or more | ~1.2K |
Over 50% of apps in the dataset have zero reviews — a stark illustration of the App Store's winner-takes-most dynamic. The ~1.2K apps with 1,000+ reviews represent roughly 7% of the catalog but almost certainly account for the majority of downloads and revenue. The bimodal distribution (large no-rating group + smaller high-rating group) confirms the "invisible majority" problem in app marketplaces: most apps never achieve meaningful discovery.
Rating Rundown: Total Apps by Average Score
The distribution is heavily left-skewed toward 4.0–5.0 ratings:
- The largest bar sits at 0.0 (no rating) — consistent with the 8.5K no-review apps above
- Apps that do receive ratings cluster strongly at 4.5 and 5.0, with secondary clusters at 3.5–4.0
- Very few apps sit at 1.0–2.5 — negative-rated apps either get removed by Apple or are quickly abandoned by developers
This pattern means average rating is a weak differentiator above 4.0 — nearly all active, rated apps sit in the 4–5 range. Review count is a stronger signal of actual user engagement than rating score alone.
App Total by Genre, Drill to App Size
Top genres by app count:
| GenreCount | |
| Games | ~15K (dominant) |
| Education | ~8K |
| Entertainment | ~7K |
| Utilities | ~6K |
| Sports | ~5K |
| Reference | ~4K |
Games is the runaway leader — approximately 2x the next category (Education). This aligns with global App Store revenue data where Games consistently represents 70%+ of total App Store consumer spend. Education's strong showing at #2 reflects the post-iPad surge in educational apps from 2012–2016. The drill-down to App Size allows analysts to examine whether larger apps (higher MB) correlate with higher ratings or revenue — a common proxy for production quality.
Total Apps and Language Breakdown
| LanguageCount | |
| English | ~15K (dominant) |
| Chinese | ~2K |
| German | ~1.5K |
| French | ~1.2K |
| Spanish | ~1.1K |
| Japanese | ~1K |
English overwhelmingly dominates at ~89% of all apps — a platform bias reflecting both the dataset's English-language sourcing and the historical concentration of iOS development in English-speaking markets. Chinese at #2 reflects the scale of China's iOS developer community despite App Store access restrictions. European languages (German, French, Spanish) cluster tightly, suggesting similar-sized developer ecosystems across major EU markets.
Key Insights
- The App Store economy is winner-takes-most at every level. 50%+ of apps have zero reviews, ~7% of apps have 1,000+ reviews, and total income of $5.59M across 16,847 apps averages $332/app lifetime. The few apps that achieve discovery generate orders of magnitude more value than the invisible majority.
- The 2016–2017 peak followed by sharp decline signals market maturation, not collapse. Developer volume peaked when the app gold rush was at its height, then fell as Apple tightened review standards, users became more selective, and the ROI of publishing low-quality apps dropped to near-zero. Quality replaced quantity as the winning strategy.
- 83.74% free pricing with $5.01 average price is a statistical distortion. A small number of professional/niche paid apps (medical, engineering, legal tools) priced at $20–$100+ pull the average up dramatically. Median price would be $0. Analysts should always use median, not mean, for App Store pricing analysis.
- Games dominate volume AND revenue — the genre breakdown shows Games at roughly 2x the next category by count, and industry data confirms Games generate ~70% of App Store revenue. Any app market analysis that doesn't segment Games separately will produce misleading averages across all other metrics.
- Top developers by volume are all indie/small studios — the absence of major publishers from the top developer list is a long-tail confirmation. Enterprise publishers compete on revenue per title, not title count. This dataset's developer ranking measures productivity, not market power.
- 4.06 average rating across the dataset is inflated by survivorship bias — apps with poor ratings get abandoned or removed; the 8.5K apps with no ratings are neither positive nor negative signals. The rated population skews positive simply because apps that attract reviews tend to be the ones worth downloading.
Who This Template Is For
- Product Analysts and App Marketers at mobile studios analyzing competitive positioning within the iOS ecosystem
- BI Developers and Data Analysts looking for a rich, real-world marketplace dataset to practice multi-dimensional Power BI modeling
- Business Strategists and Investors evaluating the mobile app market landscape for category entry or acquisition analysis
How to Use
- Download the PBIX file
- Open in Power BI Desktop
- Data is embedded from the public Apple App Store dataset — no connection setup required
- Use Genre, Price Category, and Age Rating filters to cross-segment all visuals
- Drill down from Year to Month in the release trend chart, and from Genre to App Size in the genre chart
Soft CTA:
"Need to display your app catalog or marketplace data in a structured table with sortable columns, conditional formatting, and expandable categories? Flexa Tables is a Microsoft-certified Power BI visual built for exactly this kind of multi-level tabular reporting."
Other Templates
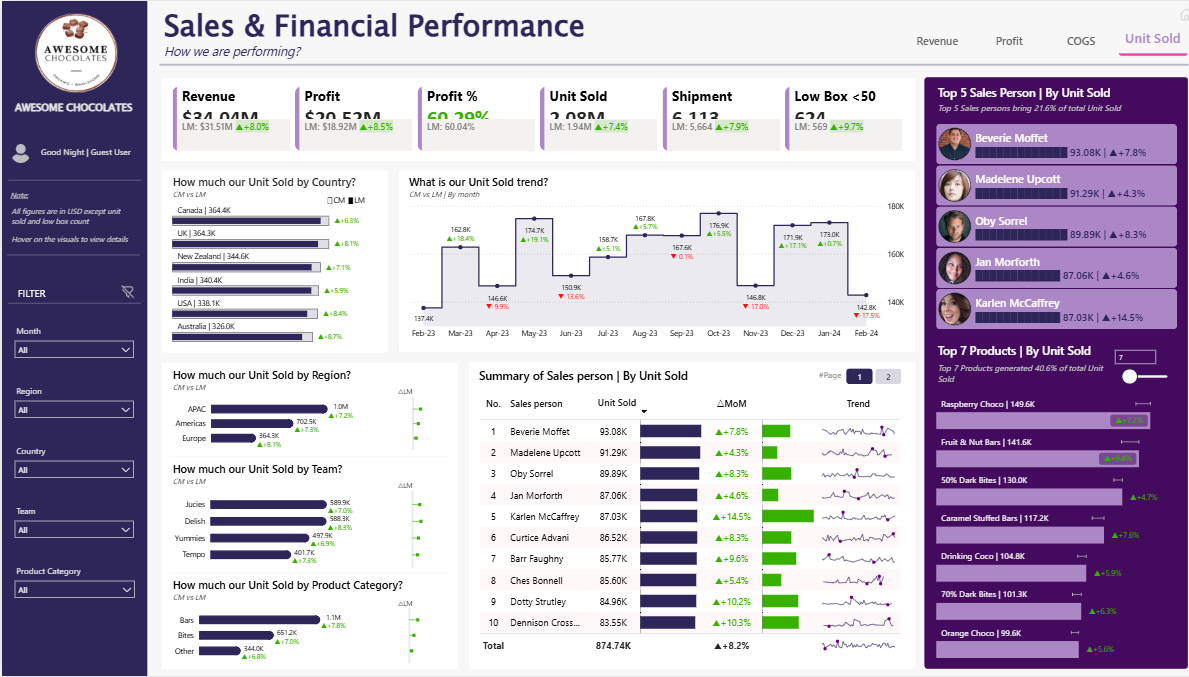 Free Sales & Revenue
Power BI Sales & Financial Performance Dashboard Template — FMCG Retail Analytics (Free PBIX Download)
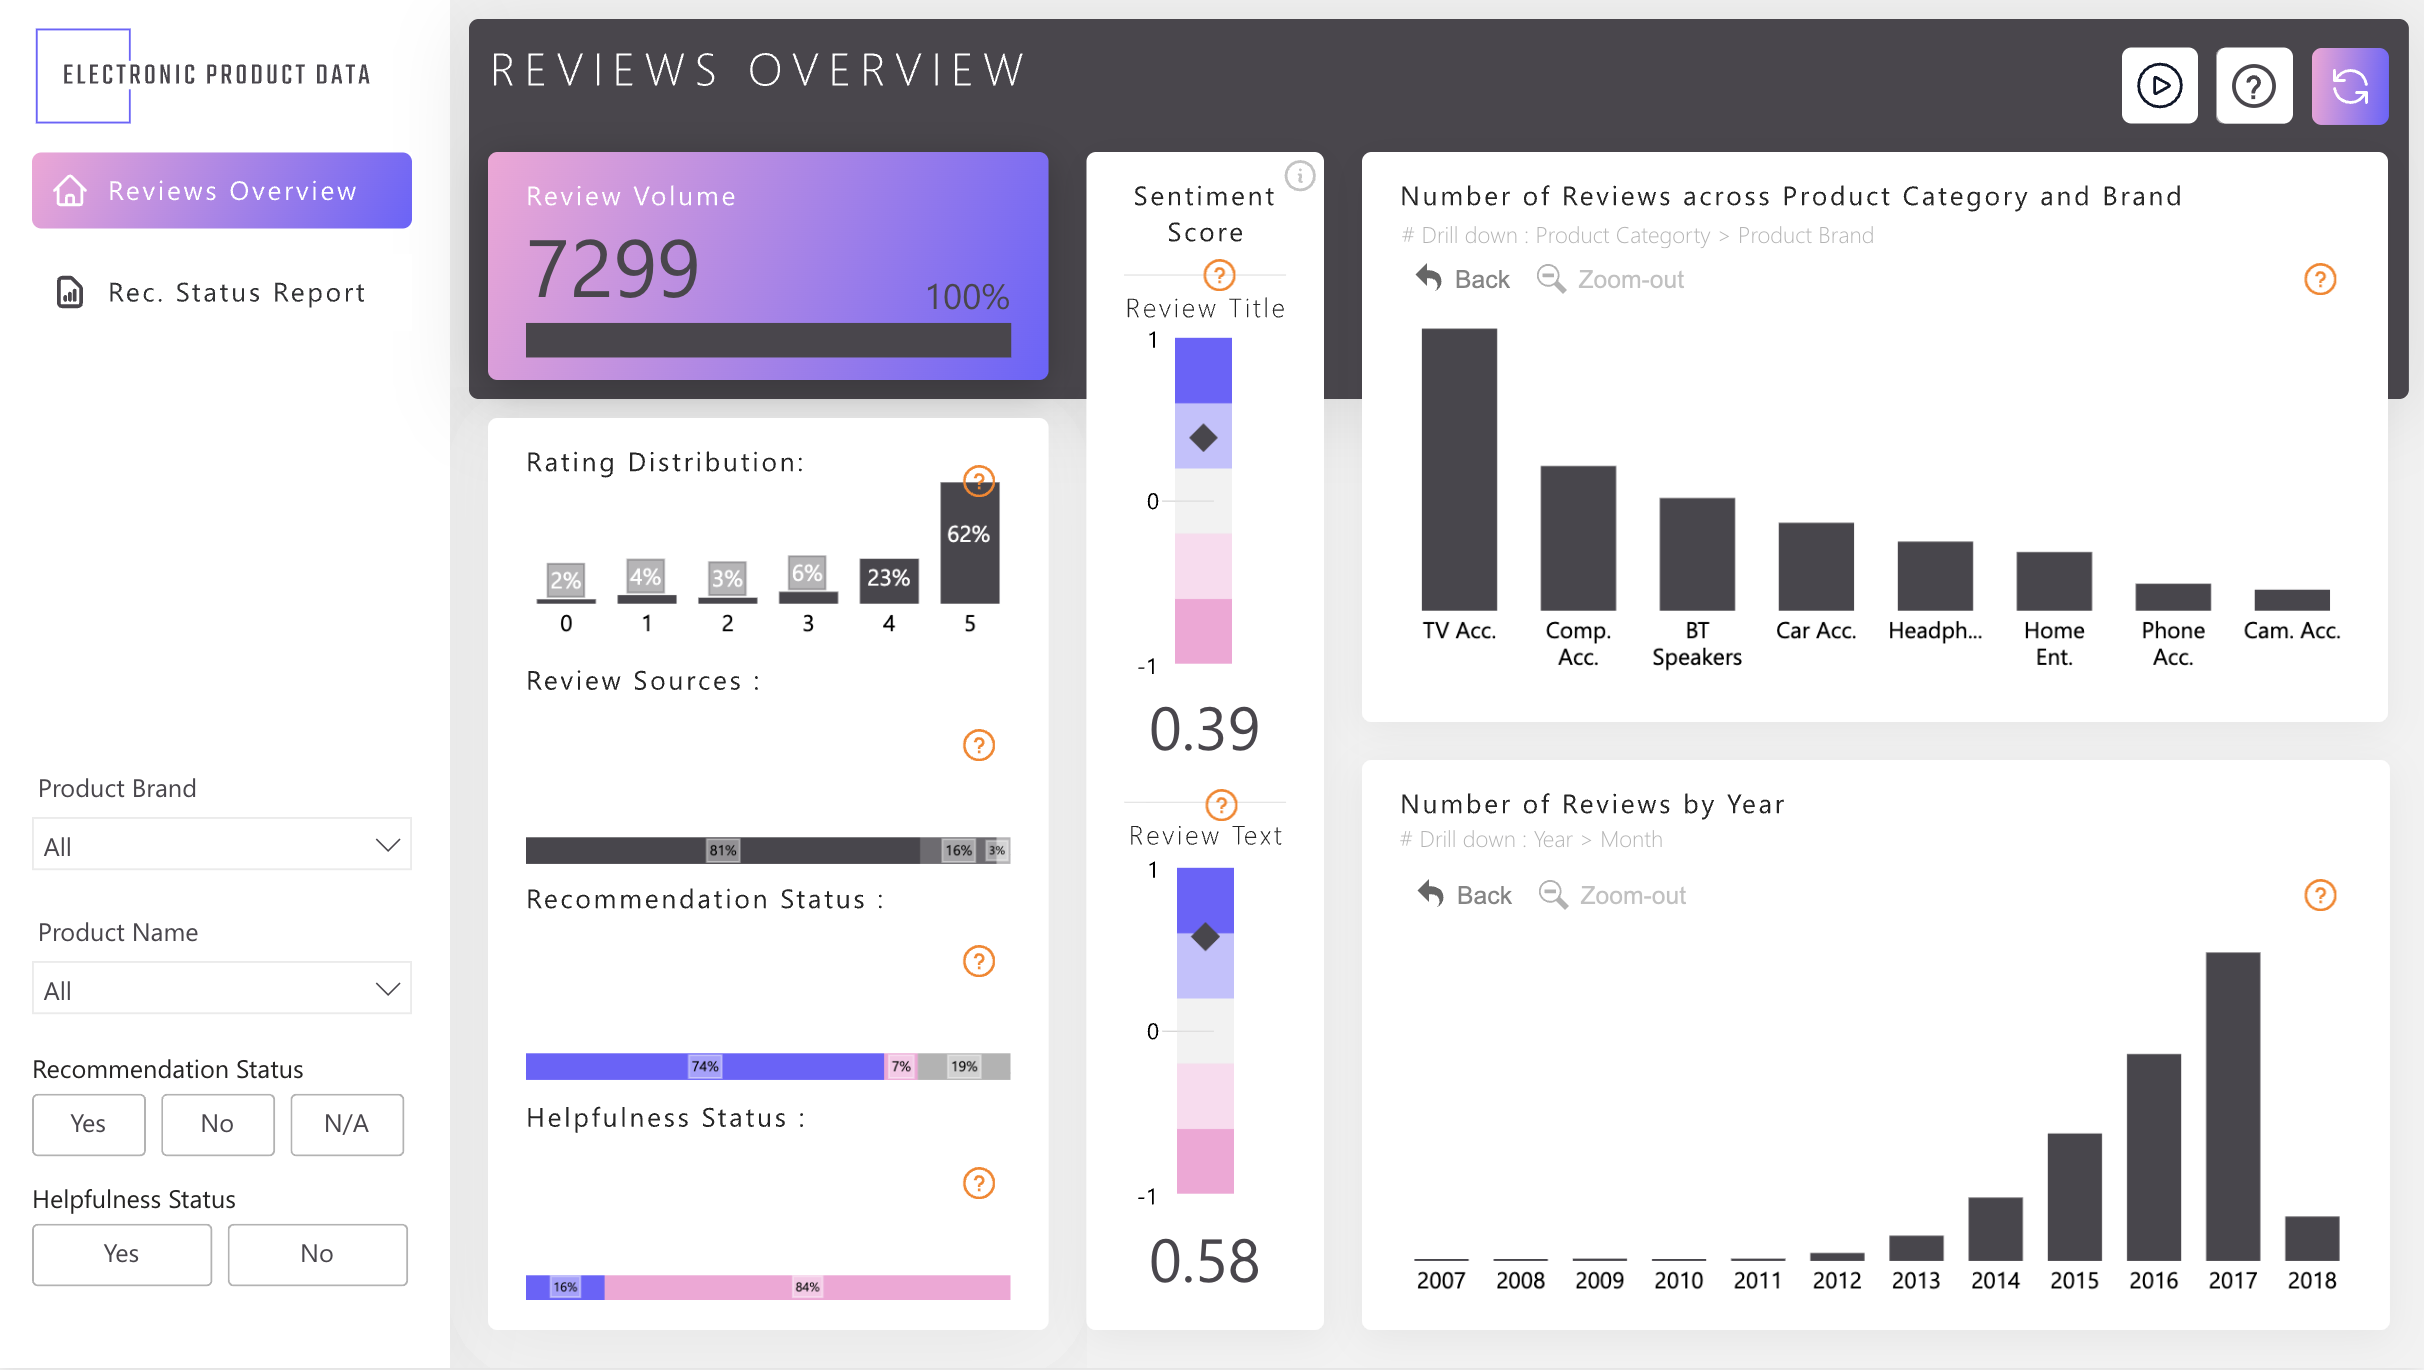 Free Retail & E-commerce
Power BI Electronic Product Reviews Dashboard Template (Free PBIX Download)
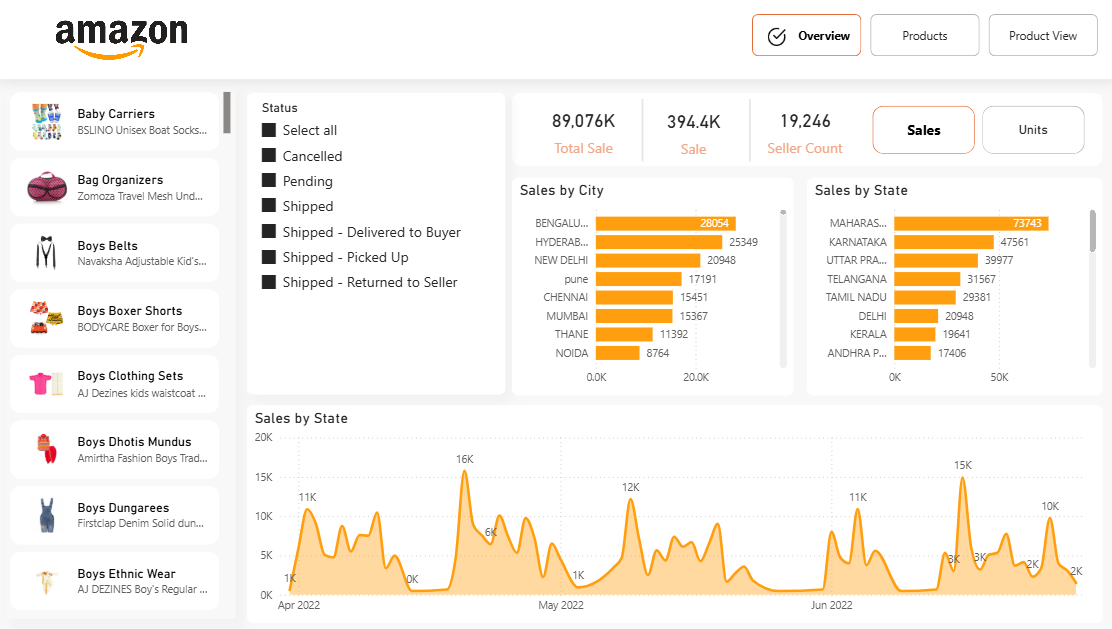 Free Sales & Revenue
Power BI Amazon India E-Commerce Sales Dashboard Template (Free PBIX Download)
If you find this website helpful, share it with friends and colleagues to boost their Power BI skills and work efficiency!
Like this site? Share it