Power BI Amazon Sales Dashboard — India E-Commerce Analytics (Free PBIX Download)

Introduction
This free Power BI Amazon Sales Dashboard template gives e-commerce sellers and marketplace analysts a complete view of Amazon India sales performance — covering 89,076K in total sales across 19,246 sellers, with granular breakdowns by city, state, daily trend, order status, and product category. Built for the April–June 2022 sales period, it demonstrates how to turn raw Amazon order exports into a boardroom-ready analytics report with just a few clicks.
Whether you're an Amazon seller tracking regional demand, an e-commerce analyst reporting to management, or a BI developer building a marketplace analytics solution — this template gives you a production-ready starting point.
What's Inside This Template
1. Top-Line KPI Strip
| KPIValueContext | ||
| Total Sale | 89,076K | Cumulative sales value across all orders |
| Sale | 394.4K | Current filtered view / segment |
| Seller Count | 19,246 | Number of unique sellers in the dataset |
The toggle between Sales and Units view allows the same dashboard to serve both revenue-focused and volume-focused reporting needs — a small design decision with significant analytical flexibility.
2. Order Status Filter Panel
The status slicer supports 6 order states:
| StatusBusiness Meaning | |
| Cancelled | Lost revenue — refund/logistics issue |
| Pending | Revenue at risk — not yet fulfilled |
| Shipped | In transit — not yet confirmed delivered |
| Shipped – Delivered to Buyer | Completed revenue |
| Shipped – Picked Up | Fulfilled via pickup |
| Shipped – Returned to Seller | Revenue reversal — return rate signal |
Filtering by "Shipped – Returned to Seller" alone transforms this into a returns analysis dashboard — revealing which cities, states, or products have the highest return rates. This is one of the most valuable but underused filters for Amazon sellers managing logistics costs.
3. Sales by City (Horizontal Bar Chart)
| RankCitySales Units | ||
| 🥇 | Bengaluru | 28,054 — #1 by a wide margin |
| 🥈 | Hyderabad | 25,349 |
| 🥉 | New Delhi | 20,948 |
| 4 | Pune | 17,191 |
| 5 | Chennai | 15,451 |
| 6 | Mumbai | 15,367 |
| 7 | Thane | 11,392 |
| 8 | Noida | 8,764 |
Key observations:
- Bengaluru leads by 10.6% over Hyderabad — India's tech capital is the dominant Amazon demand hub, likely driven by high-income tech workforce and strong logistics infrastructure
- Hyderabad vs. Bengaluru gap closing — both South Indian cities rank #1 and #2, reinforcing that South India is the e-commerce powerhouse in this dataset
- Mumbai (6th) vs. Pune (4th) — Pune outselling Mumbai is counterintuitive given Mumbai's larger population and GDP. Suggests either better seller penetration in Pune or different product-market fit
- Thane appearing separately from Mumbai — at 11,392 units, Thane is being counted as a distinct city, meaning the Mumbai metro area's combined volume (~26,759) would actually rival Hyderabad
- Delhi (20,948) + Noida (8,764) = 29,712 — the Delhi NCR metro combined is the actual #1 cluster if aggregated, ahead of Bengaluru
4. Sales by State (Horizontal Bar Chart)
| RankStateSales | ||
| 🥇 | Maharashtra | 73,743 — dominant #1 |
| 🥈 | Karnataka | 47,561 |
| 🥉 | Uttar Pradesh | 39,977 |
| 4 | Telangana | 31,567 |
| 5 | Tamil Nadu | 29,381 |
| 6 | Delhi | 20,948 |
| 7 | Kerala | 19,641 |
| 8 | Andhra Pradesh | 17,406 |
State-level insights:
- Maharashtra alone accounts for ~26% of all state-level sales shown — the single largest market by a 55% margin over Karnataka (#2). Mumbai + Pune + Thane combined under Maharashtra explains this dominance
- South India (Karnataka + Telangana + Tamil Nadu + Andhra Pradesh + Kerala) = 125,556 — collectively, South Indian states outperform North India significantly in this dataset
- Uttar Pradesh at #3 (39,977) is notable — India's most populous state ranking 3rd suggests strong but relatively underpenetrated e-commerce potential
- Kerala at 19,641 — punching above its population weight, consistent with Kerala's historically high literacy and digital adoption rates
5. Sales by State — Daily Trend Line (Apr–Jun 2022)
The area chart reveals daily sales velocity with pronounced spike patterns across the 3-month period:
| PeriodPeak SalesPattern | ||
| April 2022 | ~11K units/day | Steady mid-month spike |
| Early May 2022 | ~16K ← Season peak | Largest single spike in dataset |
| Mid May 2022 | ~6K → drops to 1K | Sharp post-peak correction |
| Late May 2022 | ~12K | Secondary recovery spike |
| June 2022 | ~15K (late month) | Strong Q2 close surge |
What the spike pattern tells us:
- The early May spike to 16K is the highest point in the entire dataset — likely corresponding to Amazon's Great Summer Sale promotional event, which typically runs in late April/early May in India
- The collapse to near 0K between spikes confirms this is event-driven demand, not organic baseline growth — sales are highly concentrated around promotional windows
- The June recovery to 15K suggests another promotional event (possibly Prime Day preparation or end-of-quarter deals)
- Baseline daily sales between spikes hover near 1–3K — the organic, non-promotional run rate is dramatically lower than peak volumes
Implication for sellers: ~70–80% of volume in this dataset is likely driven by promotional events. Any inventory, staffing, or logistics planning must be synchronized with Amazon's promotional calendar.
6. Product Category Left Panel
The scrollable product panel shows category-level browsing with thumbnail images:
| CategorySample Product | |
| Baby Carriers | BSLINO Unisex Boat Socks |
| Bag Organizers | Zomoza Travel Mesh Underpacking |
| Boys Belts | Navaksha Adjustable Kid's |
| Boys Boxer Shorts | BODYCARE Boxer for Boys |
| Boys Clothing Sets | AJ Dezines kids waistcoat |
| Boys Dhotis Mundus | Amirtha Fashion Boys Trade |
| Boys Dungarees | Firstclap Denim Solid Dun |
| Boys Ethnic Wear | AJ DEZINES Boy's Regular |
The heavy concentration in children's and boys' apparel suggests this dataset is sourced from a specific seller or category segment — not a full Amazon India marketplace export. The product mix tells its own story: this is a kids' fashion and accessories seller operating across multiple subcategories.
Key Insights Summary
- Bengaluru + Hyderabad are the top 2 cities but the Delhi NCR cluster (Delhi + Noida = 29,712) actually rivals Bengaluru when aggregated — a segmentation that the city-level chart alone obscures.
- Maharashtra dominates state-level sales at 73,743 — 55% ahead of Karnataka (#2). Any seller prioritizing one state for warehousing, delivery SLA improvement, or marketing should start here.
- Sales are event-driven, not organic — the spike-trough pattern in the daily trend line shows ~5–10x volume swings between promotional events and baseline days. Sellers using this template can immediately identify if they're over-relying on promotional volume.
- South India outperforms North India in this dataset despite North India's larger population — a finding with direct implications for inventory placement, fulfillment center prioritization, and regional marketing budgets.
- The "Shipped – Returned to Seller" filter is a hidden power feature — isolating returns by city and state reveals geographic return rate patterns that directly impact net revenue and logistics costs.
- Kerala's strong performance relative to population size makes it an underrated priority market for apparel and consumer goods sellers expanding their regional footprint.
- The May 16K peak is ~5x the baseline — meaning a seller who was out of stock during the early May promotional window missed approximately 4x their normal daily revenue in a single event.
Dashboard Navigation
This template includes 3 report pages:
| PageFocus | |
| Overview | City/state rankings, KPIs, order status, daily sales trend |
| Products | Product-level sales breakdown and performance ranking |
| Product View | Individual product deep-dive with images and metrics |
Who This Template Is For
| RoleUse Case | |
| Amazon Sellers (India) | Track sales by city/state, monitor order status mix, identify peak demand windows |
| E-commerce Analysts | Replace Excel pivot reports with interactive regional and product analysis |
| Category Managers | Understand which geographies drive volume for specific product categories |
| BI Developers | Production-ready Amazon marketplace analytics template — connect your own data export |
How to Use This Template
- Download the PBIX file
- Open in Power BI Desktop
- Replace the sample Amazon order export with your own data (CSV export from Amazon Seller Central)
- City, state, product, and status filters update all visuals simultaneously
- Switch between Sales and Units view for revenue vs. volume reporting
Upgrade Your Marketplace Analytics
Want to add dynamic product-level variance tables, return rate by category, and seller performance benchmarking? Explore Flexa Tables — a Microsoft-certified Power BI visual that makes complex marketplace data readable at a glance.
Other Templates
 Free Sales & Revenue
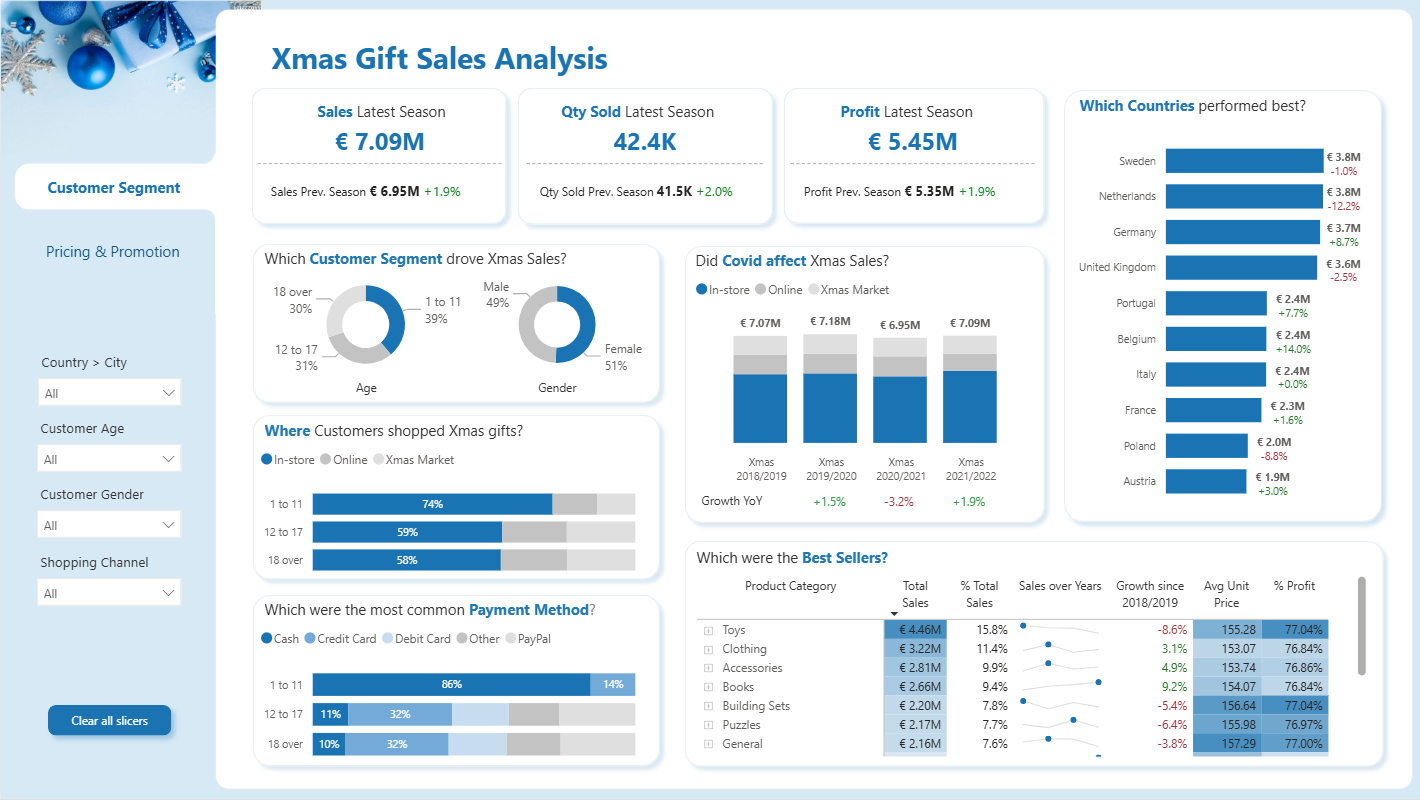
Power BI Christmas Gift Sales Analysis Dashboard (Free PBIX Download)
 Free Sales & Revenue
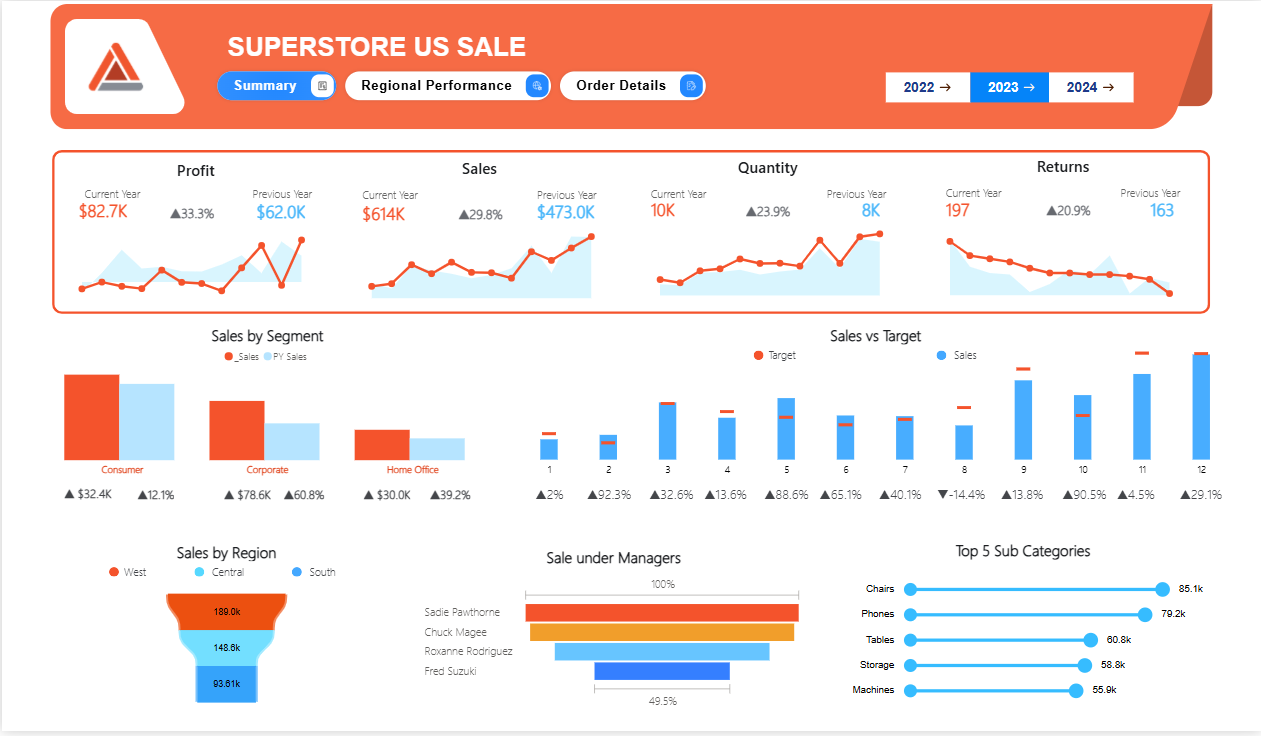
Superstore US Sale Report
 Free Sales & Revenue
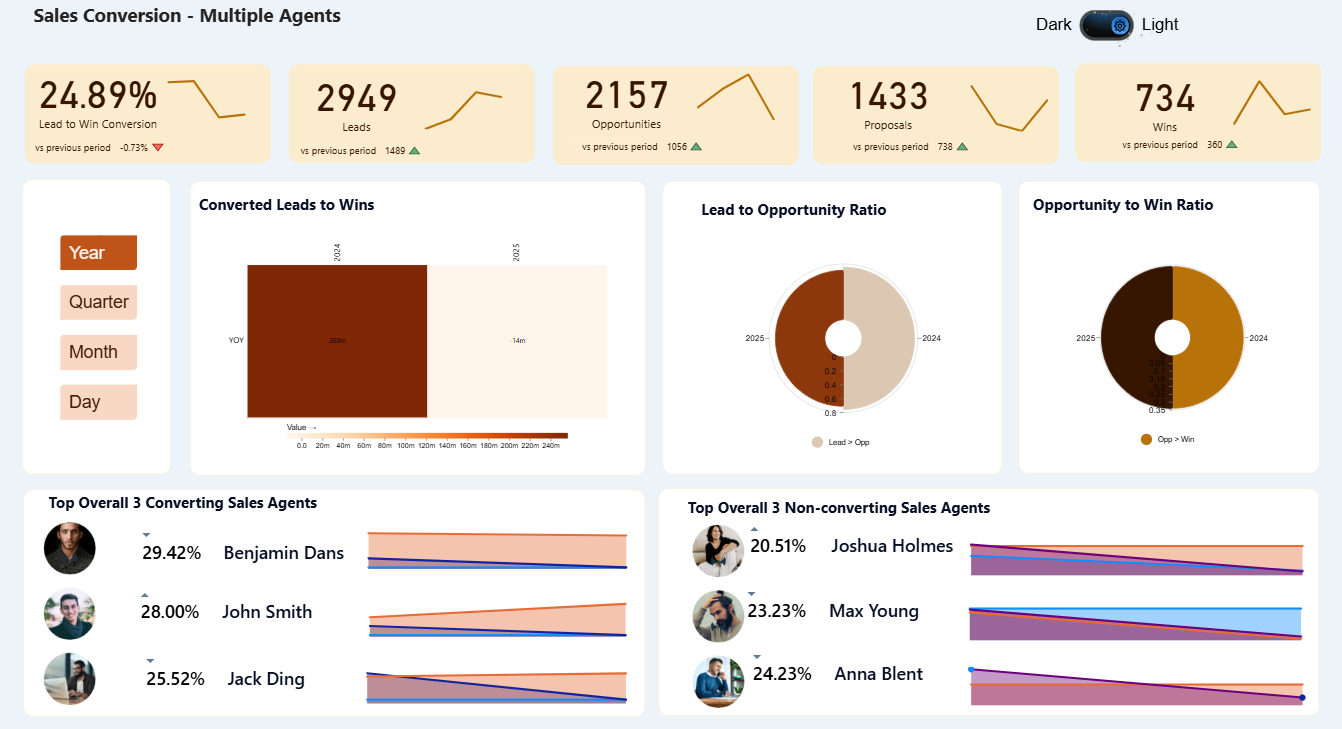
Sales Conversion – Multiple Agents Dashboard
If you find this website helpful, share it with friends and colleagues to boost their Power BI skills and work efficiency!
Like this site? Share it