Power BI Amazon India E-Commerce Sales Dashboard Template (Free PBIX Download)
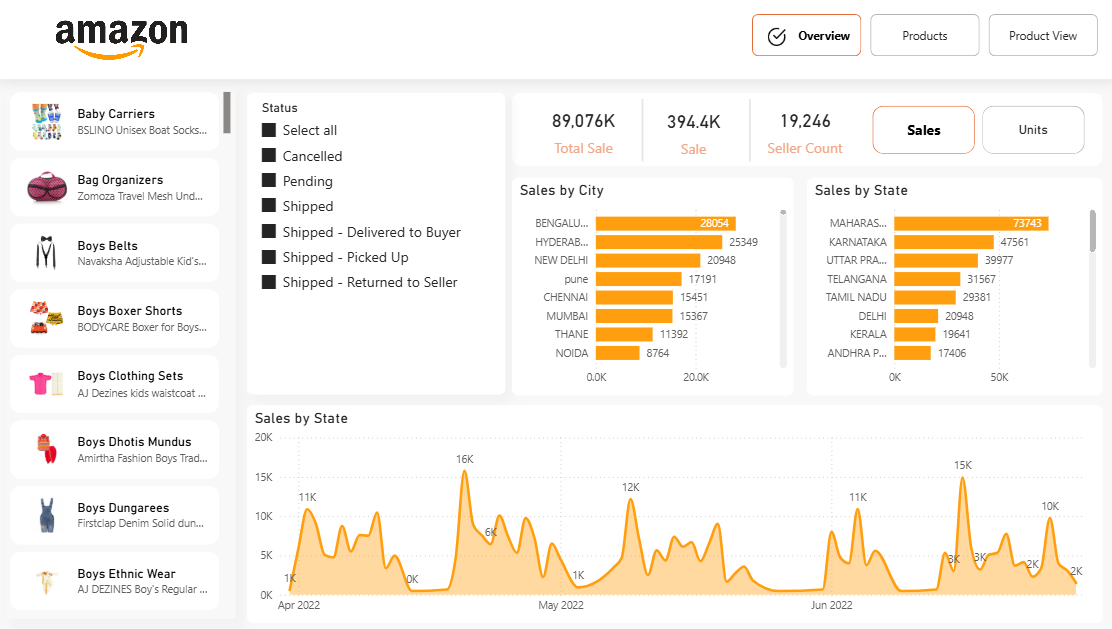
Introduction: This Power BI dashboard analyzes Amazon India marketplace sales data across April–June 2022, covering 89,076K in total sales from 19,246 active sellers. Built for e-commerce analysts and marketplace operations teams, it combines geographic sales distribution (city and state level), order status pipeline tracking, daily sales trend analysis, and a product category browser — giving a complete operational picture of a high-velocity Indian e-commerce market during Q2 2022.
What's Inside This Template
Top KPI Banner
| MetricValue | |
| Total Sale | 89,076K |
| Sale (filtered/current) | 394.4K |
| Seller Count | 19,246 |
| Toggle | Sales / Units view |
The Sales/Units toggle is a notable UX feature — it allows switching the entire dashboard between revenue view and volume view without changing any other filter, enabling instant margin proxy analysis (high revenue but low units = high-ASP products; high units but low revenue = commodity SKUs).
Product Category Browser (Left Panel) A scrollable product list with thumbnail images and seller names covering children's and women's apparel categories visible in the screenshot: Baby Carriers, Bag Organizers, Boys Belts, Boys Boxer Shorts, Boys Clothing Sets, Boys Dhotis Mundus, Boys Dungarees, Boys Ethnic Wear. This panel functions as a product-level filter, allowing drill-down from market-level to individual product performance.
Order Status Filter Six order status buckets:
- Cancelled
- Pending
- Shipped
- Shipped — Delivered to Buyer
- Shipped — Picked Up
- Shipped — Returned to Seller
The presence of "Shipped — Returned to Seller" as a trackable status is operationally significant — it enables return rate analysis by geography or product, which is critical for Indian e-commerce where COD (Cash on Delivery) drives structurally higher return rates than card-payment markets.
Sales by City (Horizontal Bar Chart)
| CitySales | |
| Bengaluru | 28,054 |
| Hyderabad | 25,349 |
| New Delhi | 20,948 |
| Pune | 17,191 |
| Chennai | 15,451 |
| Mumbai | 15,367 |
| Thane | 11,392 |
| Noida | 8,764 |
Bengaluru leads at 28,054 — 7.1% ahead of Hyderabad (25,349) and 34% ahead of Delhi (20,948). The top 3 cities (Bengaluru, Hyderabad, New Delhi) account for approximately 47% of visible city-level sales. Notably, Mumbai ranks 6th at 15,367 — far below its population rank as India's largest city — while Bengaluru and Hyderabad dominate, consistent with their higher concentration of tech-sector professionals who are the core Amazon India buyer demographic for premium children's and lifestyle products.
Sales by State (Horizontal Bar Chart)
| StateSales | |
| Maharashtra | 73,743 |
| Karnataka | 47,561 |
| Uttar Pradesh | 39,977 |
| Telangana | 31,567 |
| Tamil Nadu | 29,381 |
| Delhi | 20,948 |
| Kerala | 19,641 |
| Andhra Pradesh | 17,406 |
Maharashtra leads at 73,743 — 55% higher than Karnataka (47,561) despite Mumbai ranking only 6th at city level. This gap is explained by Maharashtra's geographic breadth — Mumbai, Pune, Thane, and Noida-adjacent areas all roll up into Maharashtra, aggregating multiple city clusters into one dominant state figure. Uttar Pradesh at 39,977 (3rd) despite no single UP city appearing prominently in the city chart confirms that tier-2/3 city distribution (Lucknow, Kanpur, Agra, Varanasi) collectively drives significant state-level volume in ways invisible at the major-city level.
Sales by State — Daily Trend Line (April–June 2022)
The area chart reveals a highly volatile, spike-driven sales pattern across three months:
- April 2022: Opens at ~1K, spikes sharply to ~11K, drops back to ~0K, then recovers to ~6K — a classic promotional event pattern (likely Amazon's spring sale events)
- May 2022: Highest peak of the entire period at ~16K — the dominant sales event of Q2, followed by a sharp drop to ~1K then recovery to ~12K
- June 2022: More fragmented pattern with multiple smaller peaks at ~11K, ~15K, ~3K, ~3K, ~10K — suggesting either more frequent but smaller promotions or demand normalization post-peak season
The valley periods dropping to near 0K between peaks are the most operationally important signal — they indicate this is not a business with consistent daily demand but one almost entirely dependent on promotional event windows. Non-event day revenue is negligible relative to spike days.
Three-Tab Structure (Overview / Products / Product View) The dashboard has dedicated tabs for product-level and SKU-level drill-down beyond the overview. The Products tab likely shows category and ASIN-level performance; Product View likely shows individual listing detail with images and metrics.
Key Insights
- The business runs on promotional spikes, not baseline demand. The daily sales trend shows valleys near 0K between peaks of 11–16K — meaning 80%+ of revenue concentrates in a handful of promotional days per month. For inventory and logistics planning, this means stock-out risk during peak days and cash flow pressure during valley periods. Any operational analysis that uses monthly averages will systematically misrepresent the actual demand pattern.
- Bengaluru and Hyderabad outperform Mumbai despite Mumbai's population advantage — Bengaluru (28,054) is 83% higher than Mumbai (15,367) at city level. This reflects the tech-sector demographic concentration in both cities driving higher-income discretionary spending on children's apparel and lifestyle products. For category expansion decisions, Tier-1 tech cities should be prioritized over pure population-ranked metros.
- Maharashtra's state-level dominance (73,743) vs Mumbai's city-level underperformance (15,367) reveals strong tier-2 city contribution within the state. Pune (17,191) + Thane (11,392) + Mumbai (15,367) = 43,950 — still 29,793 below Maharashtra's state total, meaning non-listed Maharashtra cities (Nashik, Aurangabad, Nagpur, Navi Mumbai) collectively contribute more than Thane. Tier-2 Maharashtra is a genuine market, not just an overflow from Mumbai.
- Uttar Pradesh at 39,977 state-level with no prominent city in the top 8 is the most counterintuitive finding in the geographic data. UP's volume is distributed across Lucknow, Kanpur, Agra, Varanasi, and dozens of smaller cities — none individually large enough to chart, but collectively making UP the 3rd largest state market. This is a structural argument for marketplace models over physical retail: digital reach aggregates demand across cities too small for physical store economics.
- The "Shipped — Returned to Seller" status bucket enables return rate analysis that most Amazon dashboards omit. In Indian e-commerce, COD orders run 50–65% of total orders for apparel categories, and COD return rates can reach 25–40%. The ability to filter by this status and cross-reference with city or product gives operations teams a direct tool to identify high-return geographies or SKUs — which is where margin recovery is actually possible in a marketplace model.
- 19,246 sellers with 89,076K total sales averages ~4,630K per seller — but this average is meaningless given marketplace power-law distribution. The top 1–5% of sellers almost certainly account for 50–70% of GMV. The Seller Count KPI is a market breadth indicator, not a health indicator; seller count growth without corresponding GMV growth indicates market fragmentation, not expansion.
Who This Template Is For
- E-commerce Analysts and Marketplace Operations Managers at Indian retail brands selling on Amazon who need city and state-level sales visibility with order status pipeline tracking to manage fulfillment and return rates by geography
- Category Managers and Regional Sales Heads monitoring which states and cities are driving GMV concentration, identifying underperforming regions relative to population potential, and planning promotional event investment
- BI Developers building retail dashboards for marketplace sellers who need a production-ready template combining geographic bar charts, daily trend analysis, product browser, and order status filtering in a single-page overview
How to Use
- Download the PBIX file
- Open in Power BI Desktop
- Connect your Amazon seller data source — the model requires an orders table with order date, city, state, order status, sale value, units, seller ID, and product category fields (exportable from Amazon Seller Central reports)
- All city/state bar charts, the daily trend line, KPI cards, and product browser update automatically; use the Status filter to isolate delivered vs returned vs cancelled orders
"Need a structured breakdown table showing sales, units, and return rates by state, city, and product category — with variance columns and conditional formatting by performance tier? Flexa Tables is a Microsoft-certified Power BI visual built for exactly this kind of multi-dimensional e-commerce tabular reporting."
Other Templates
 Free Sales & Revenue
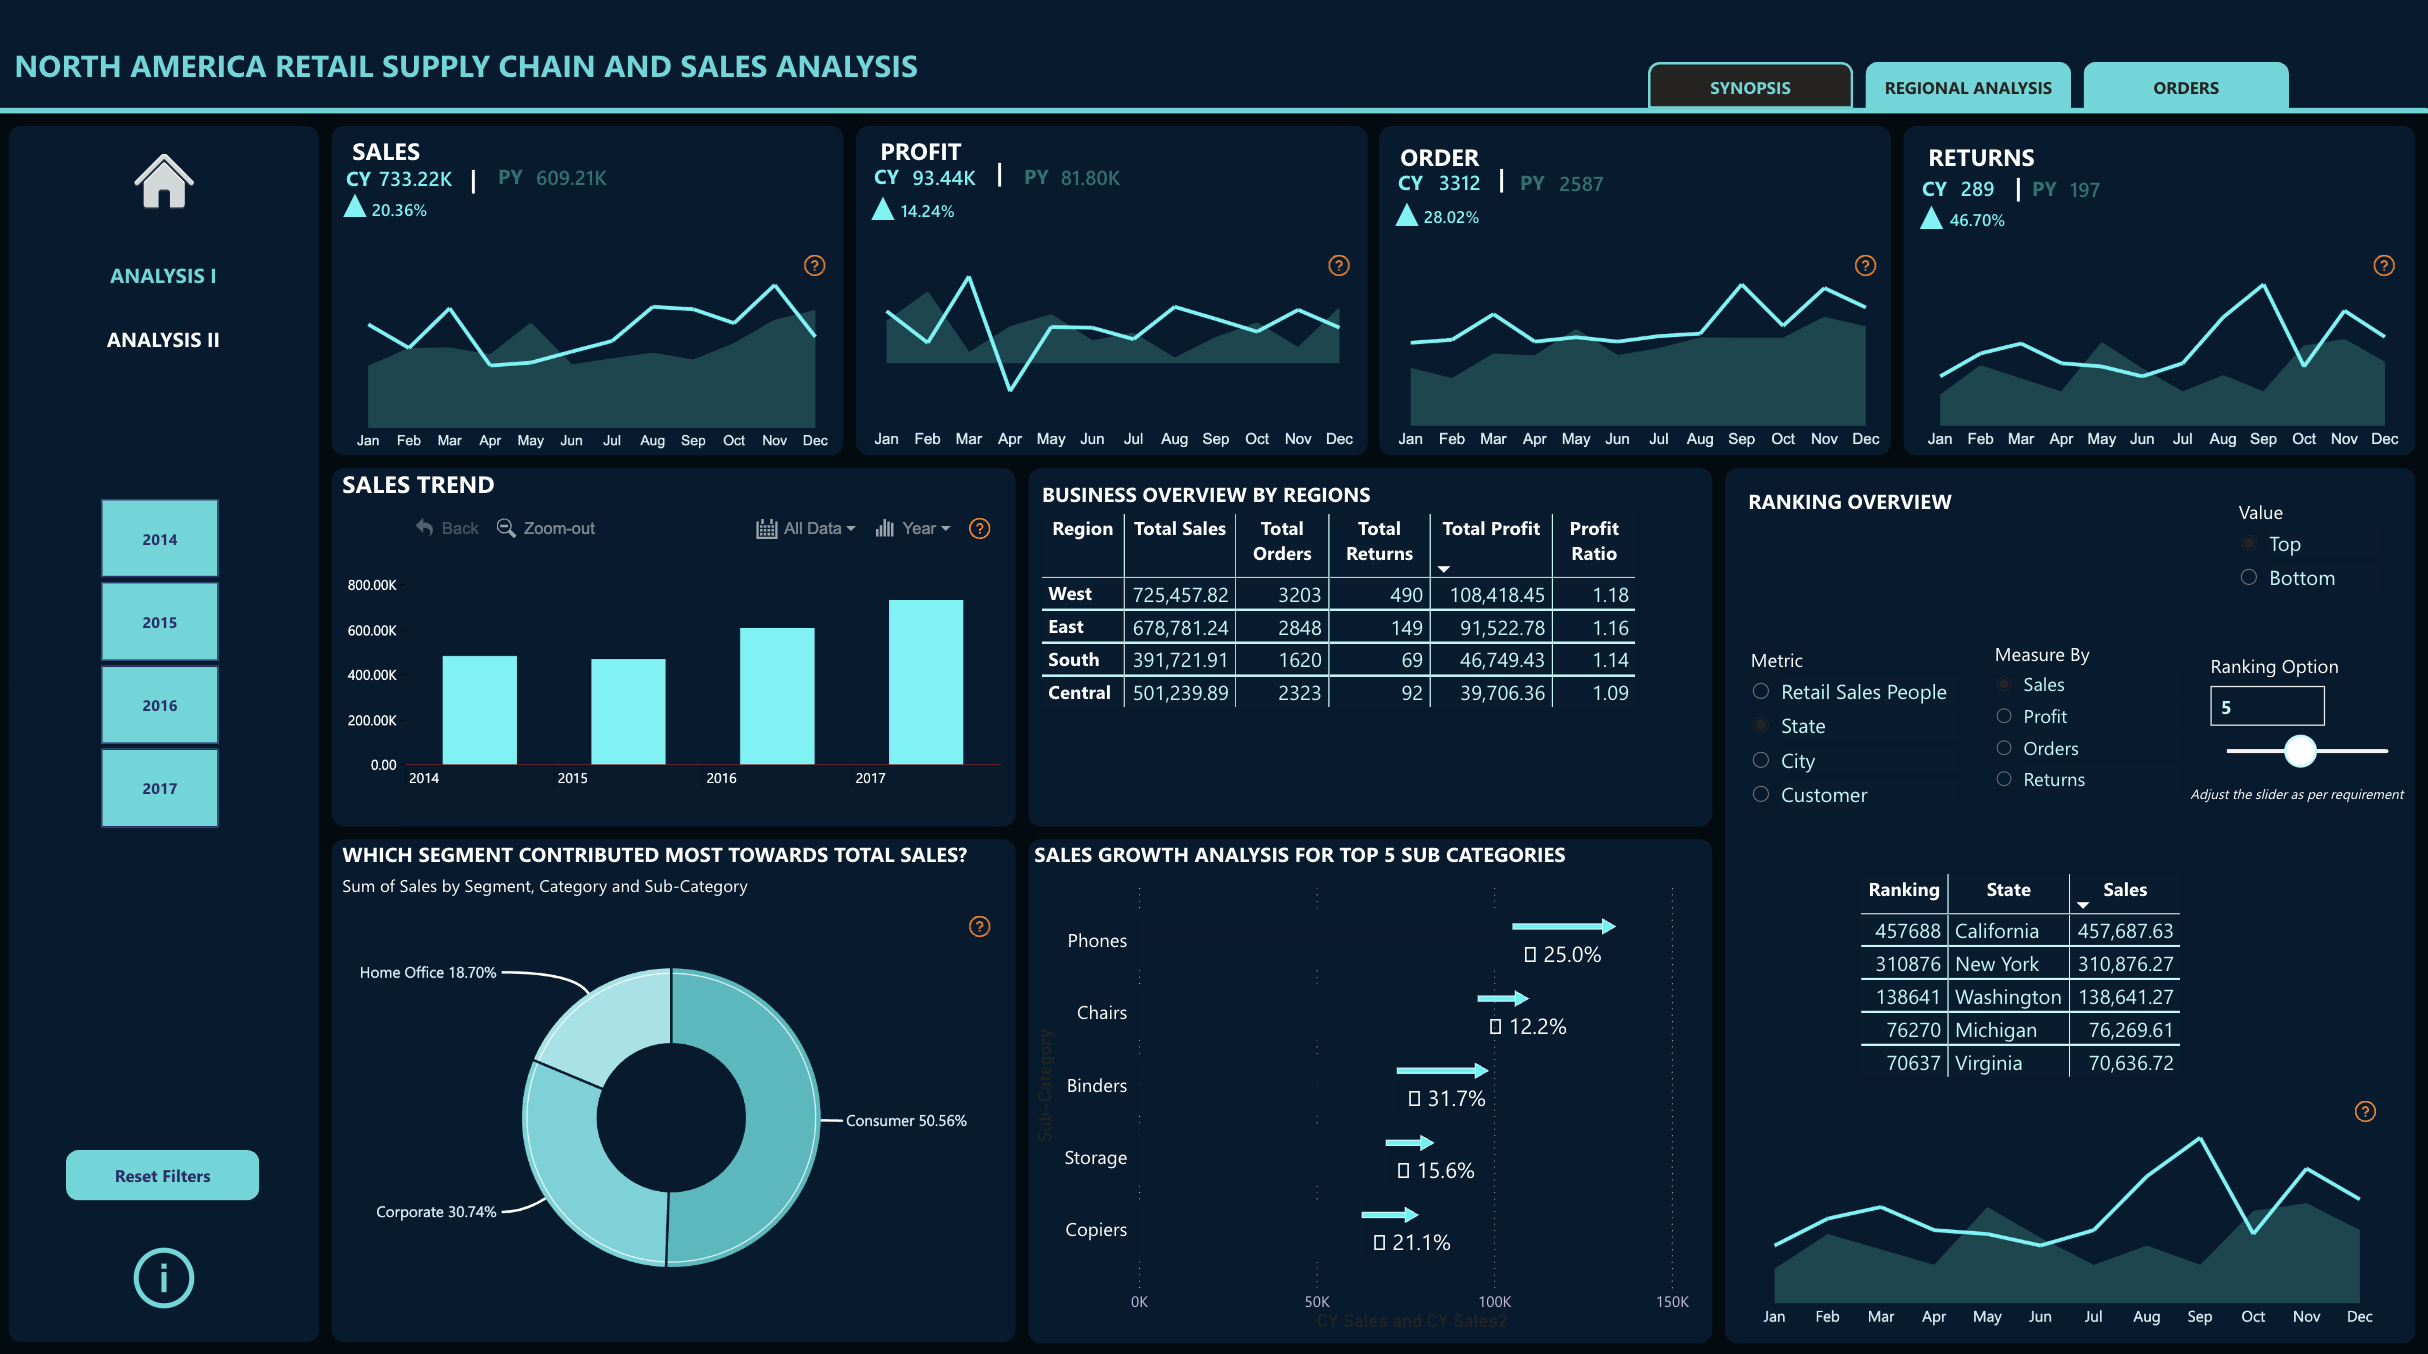
Power BI North America Retail Supply Chain and Sales Analysis Dashboard Template (Free PBIX Download)
 Free Sales & Revenue
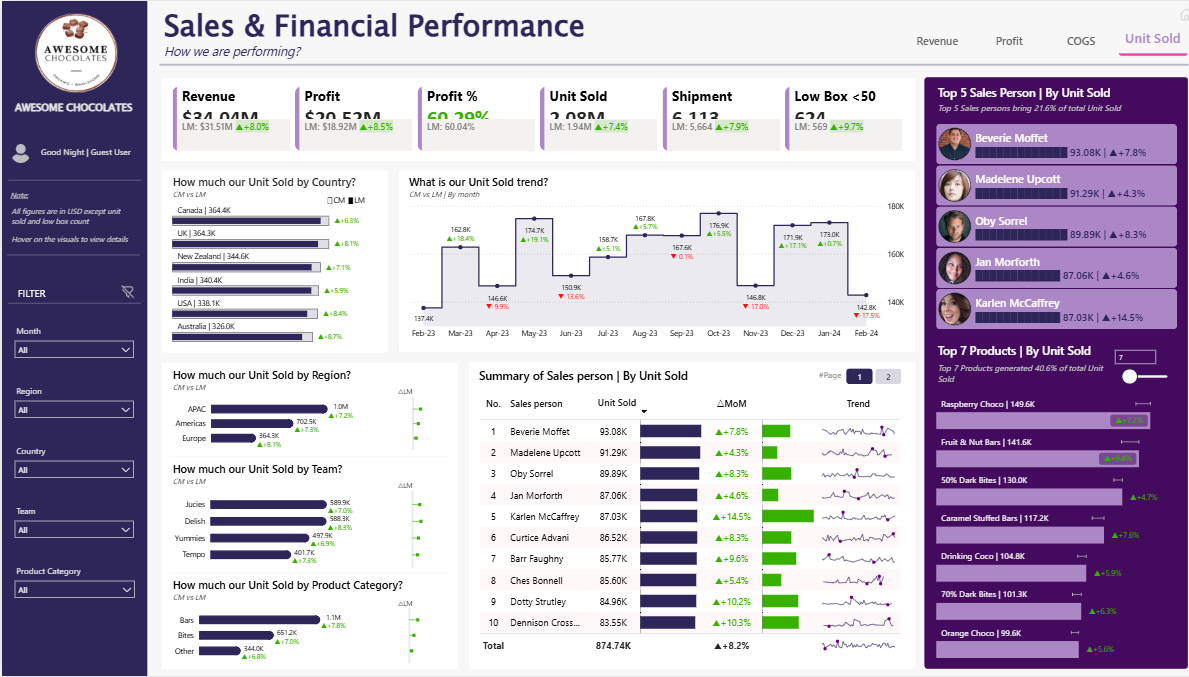
Power BI Sales & Financial Performance Dashboard Template — FMCG Retail Analytics (Free PBIX Download)
 Free Sales & Revenue
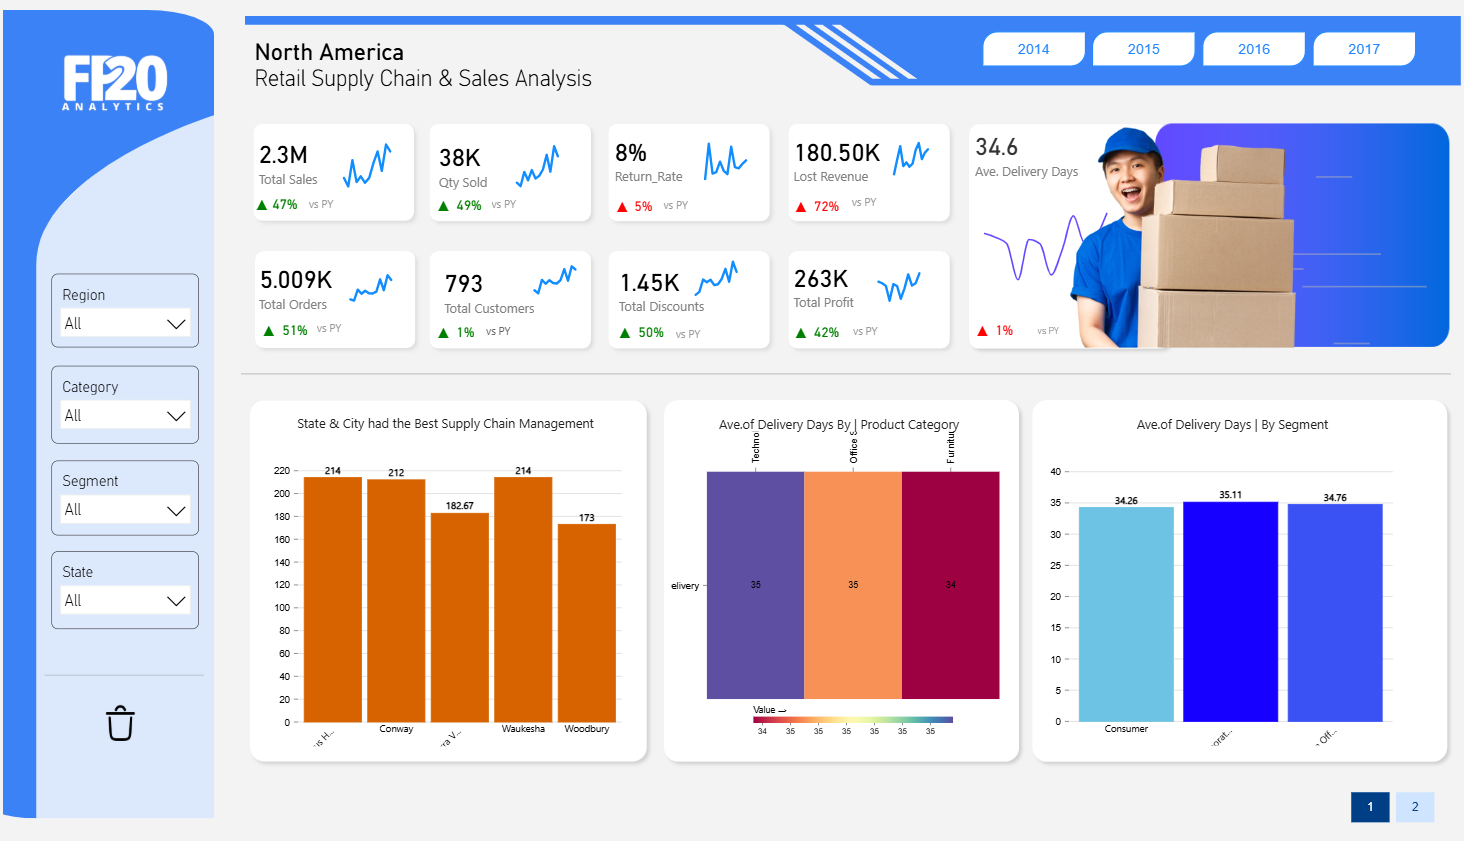
Retail Supply Chain & Sales Analysis dashboard
If you find this website helpful, share it with friends and colleagues to boost their Power BI skills and work efficiency!
Like this site? Share it