Healthcare Patient Analytics Dashboard
1369 Downloads
Description
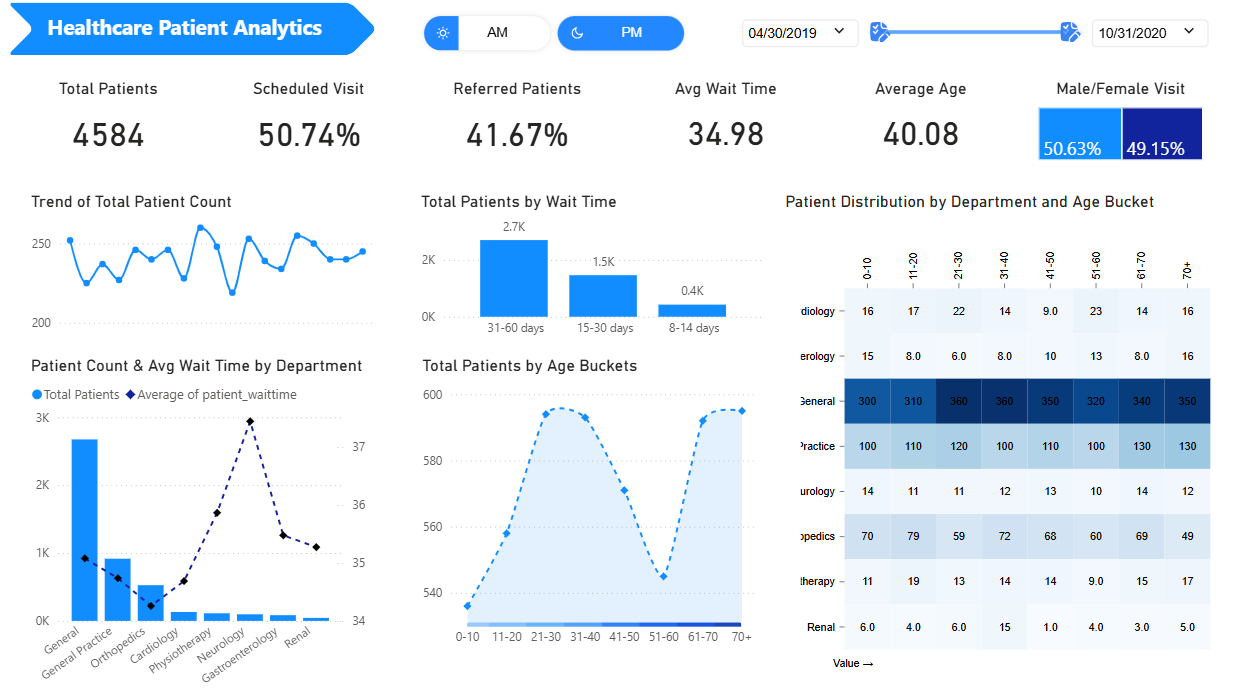
The Healthcare Patient Analytics dashboard provides the following insights for the period from 04/30/2019 to 10/31/2020:
- Total Patients: 4,584.
- Scheduled Visit: 50.74% of patients.
- Referred Patients: 41.67% of patients.
- Avg Wait Time: 34.98 days.
- Average Age: 40.08 years.
- Male/Female Visit: 50.63% male, 49.15% female.
- Trend of Total Patient Count: Shows fluctuations with a slight overall increase over time.
- Total Patients by Wait Time: 2.7K patients waited 31-60 days, 1.5K waited 15-30 days, and 0.4K waited 8-14 days.
- Patient Count & Avg Wait Time by Department: General has the highest patient count (around 2.5K) with an average wait time of 35 days, while Renal has the lowest (around 0.5K) with 35 days.
- Total Patients by Age Buckets: Peaks at 590 patients in the 31-40 and 61-70 age groups, with a gradual decline in other ranges.
- Patient Distribution by Department and Age Bucket:
- General: Highest in 31-40 (360) and 21-30 (360) age groups.
- Neurology: Peaks at 0-10 (14) and 61-70 (14) age groups.
- Therapy: Consistent distribution across 0-10 (11) to 51-60 (17).
- Renal: Lowest overall, with a peak at 31-40 (15).
The dashboard is designed using Flexa Design, Flexa Tables, and Flexa Charts from Flexa Intel.
Other Templates
 Free Customer Service
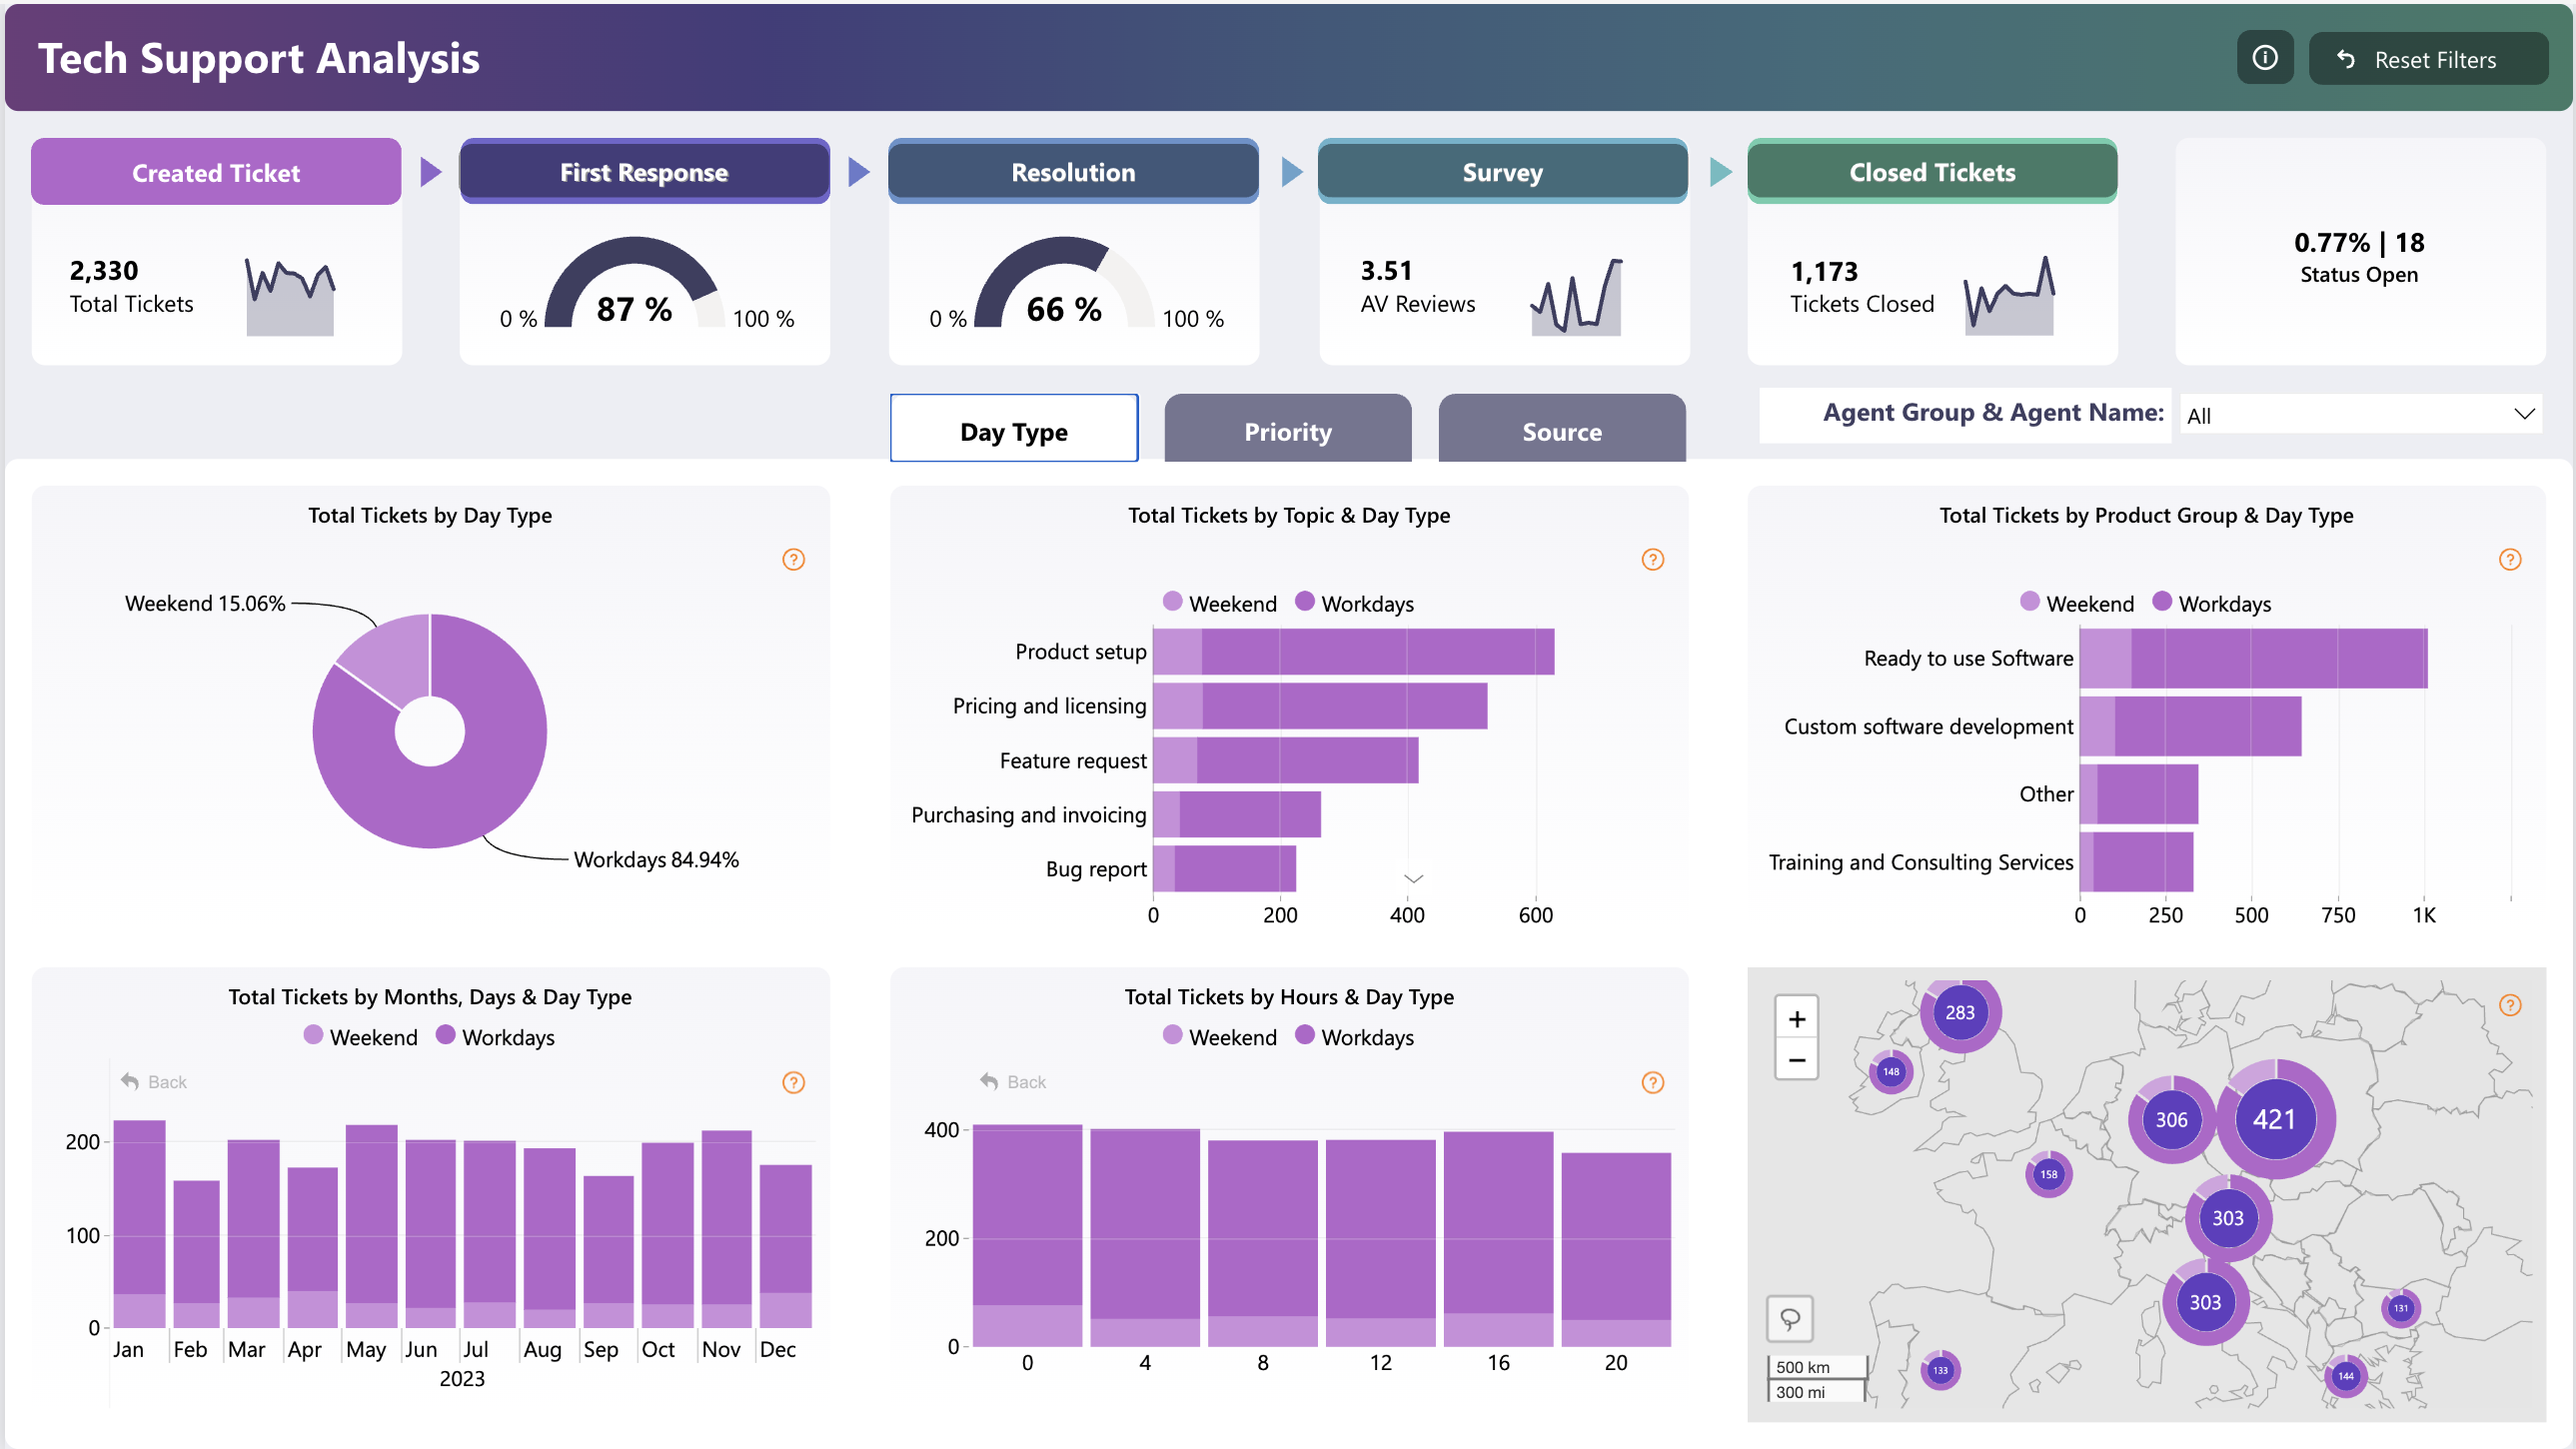
Power BI Tech Support Analysis Dashboard Template (Free PBIX Download)
68
 Free Sales & Revenue
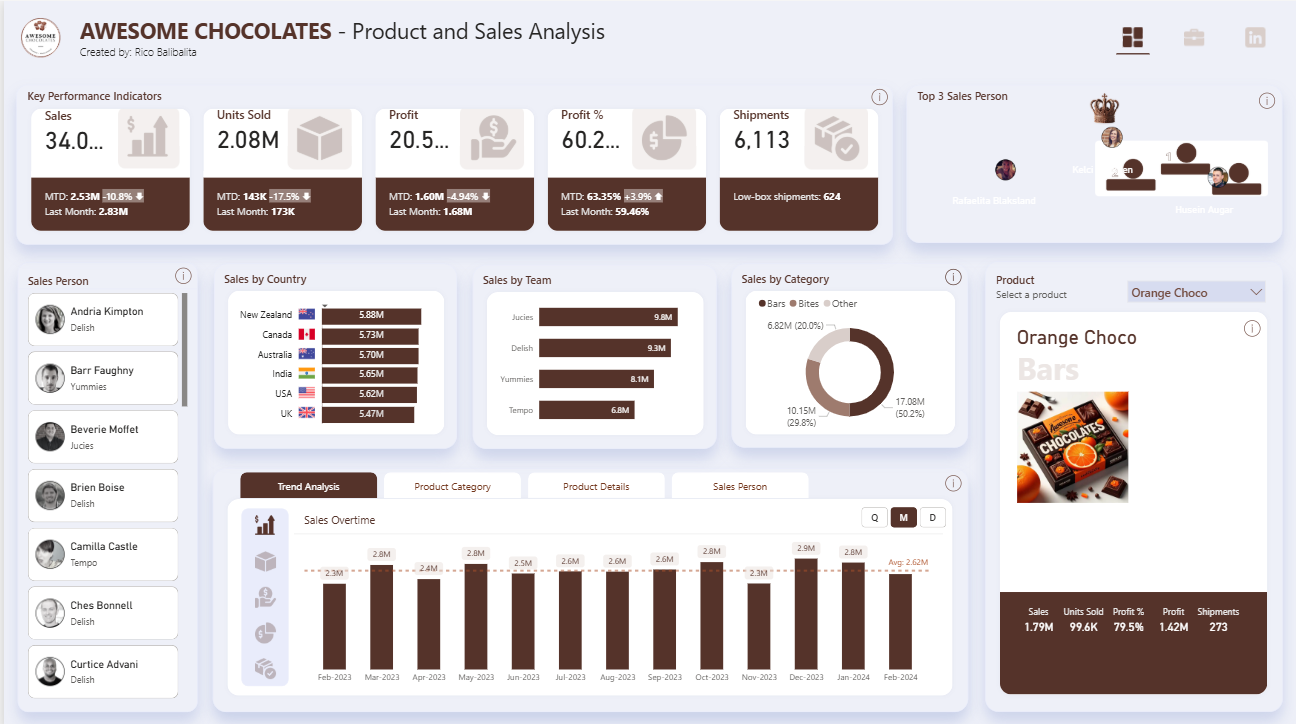
Power BI Product Sales Analysis Dashboard Template — FMCG Product Drill-Down (Free PBIX Download)
92
 Free Sales & Revenue
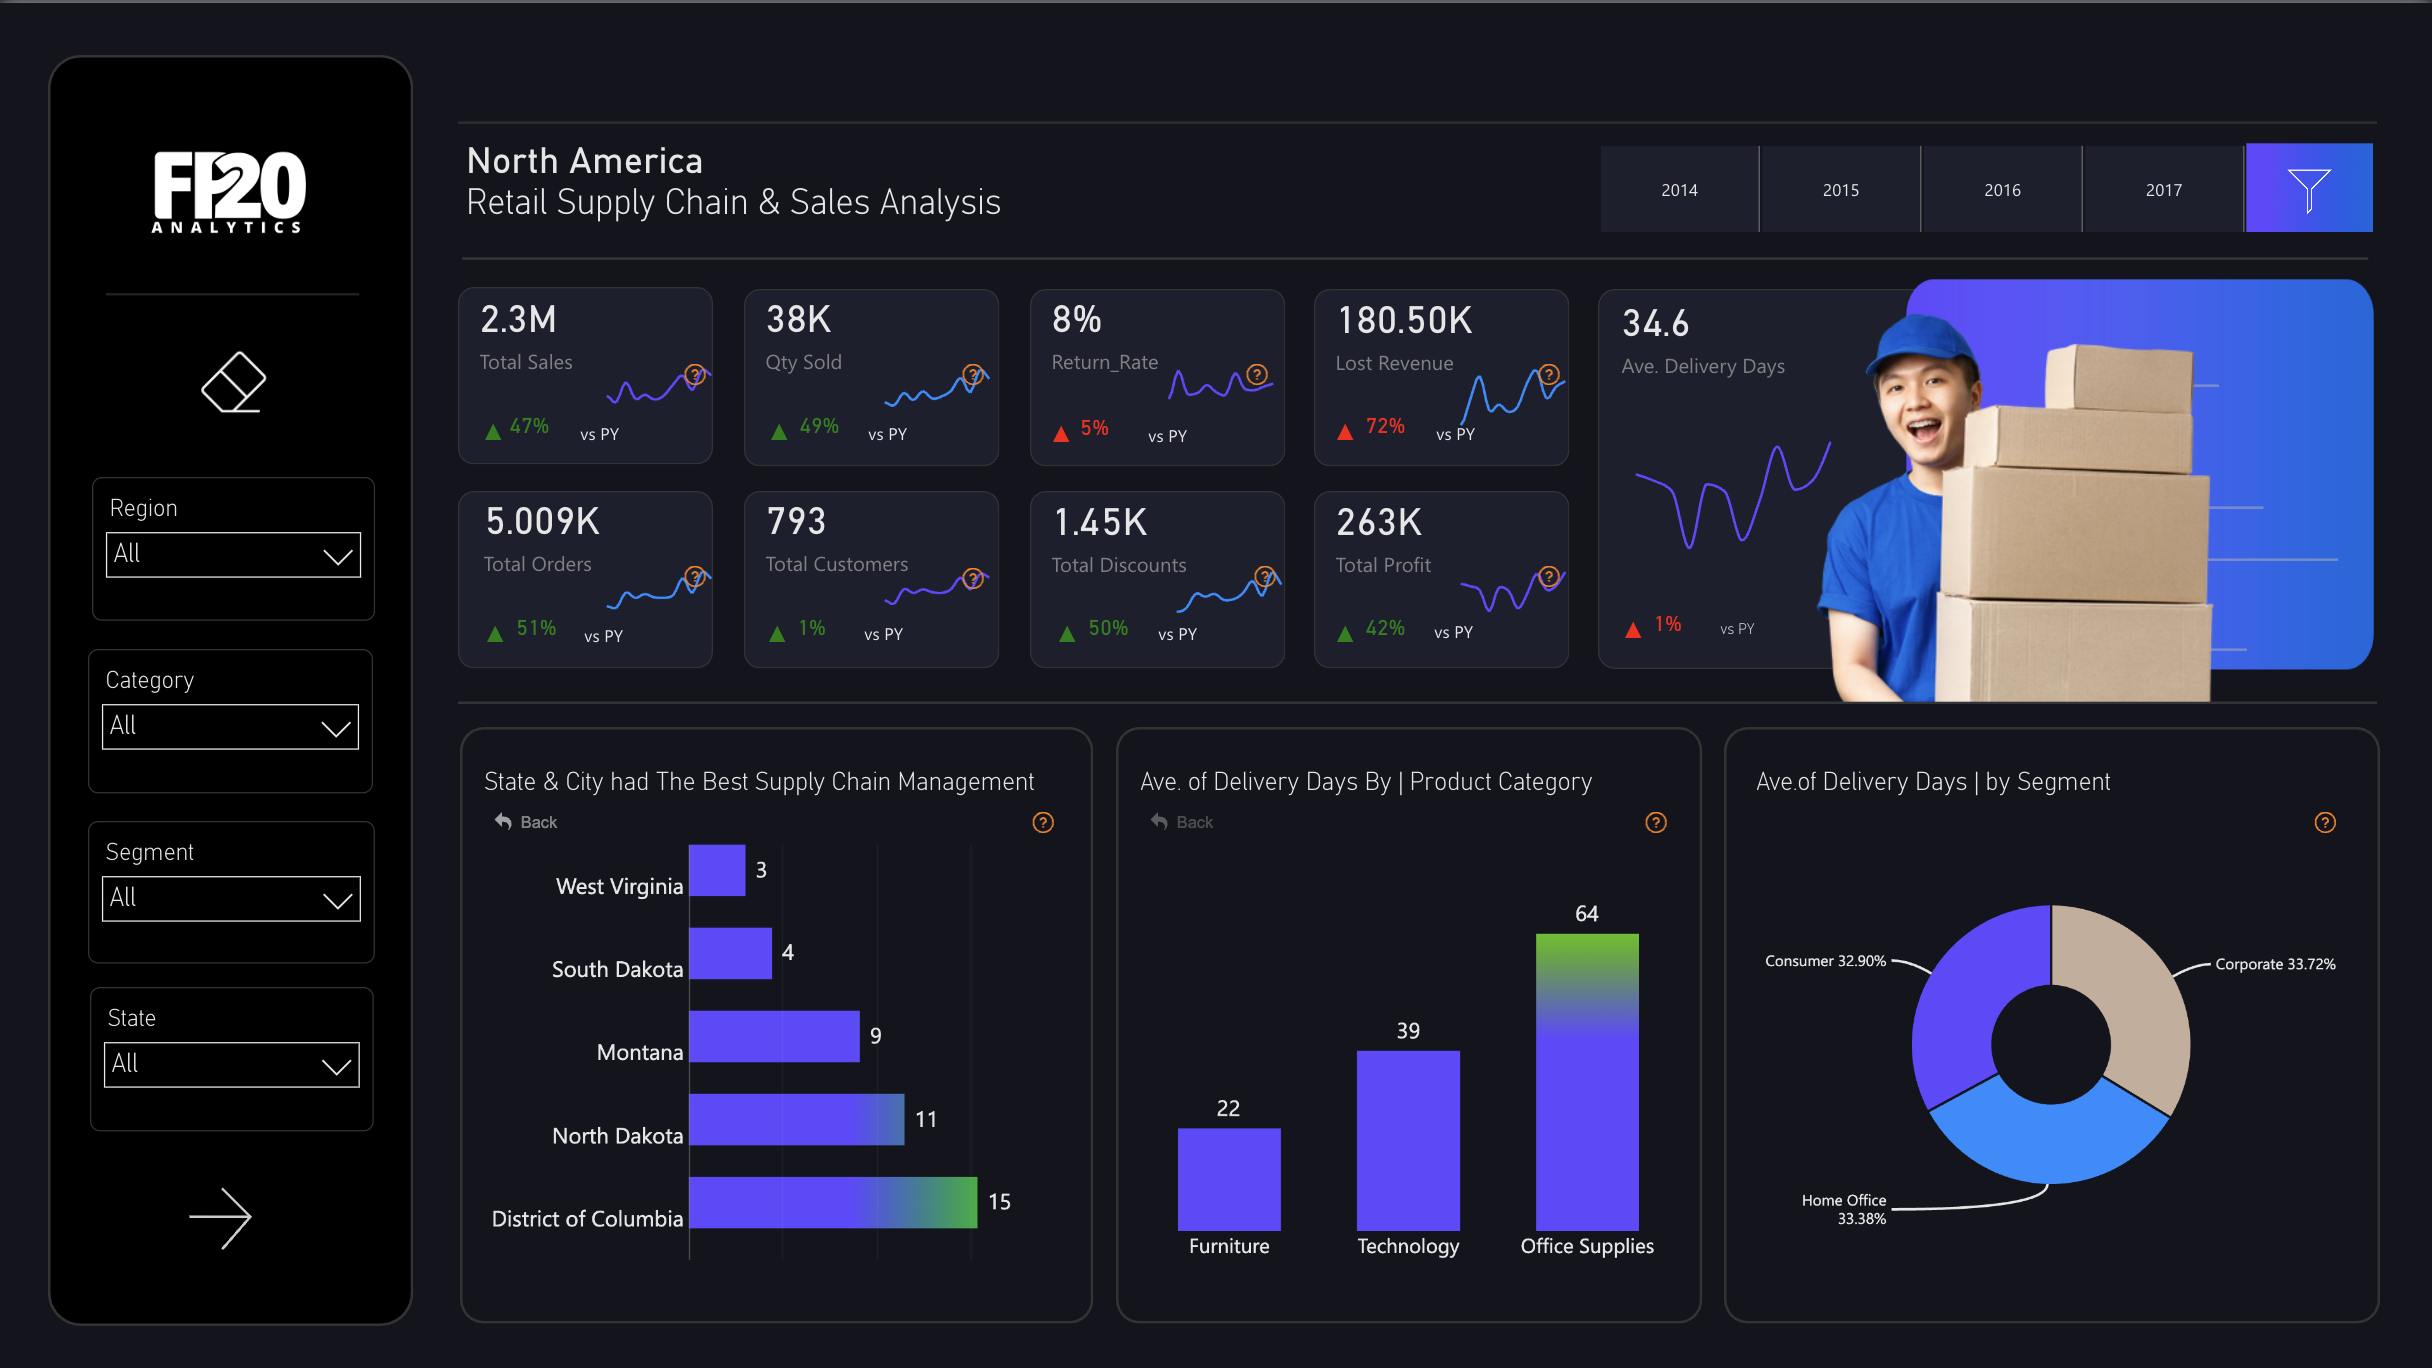
Power BI North America Retail Supply Chain & Sales Analysis Dashboard Template (Free PBIX Download)
81
If you find this website helpful, share it with friends and colleagues to boost their Power BI skills and work efficiency!
Like this site? Share it