Email Communication Report
1548 Downloads
Description
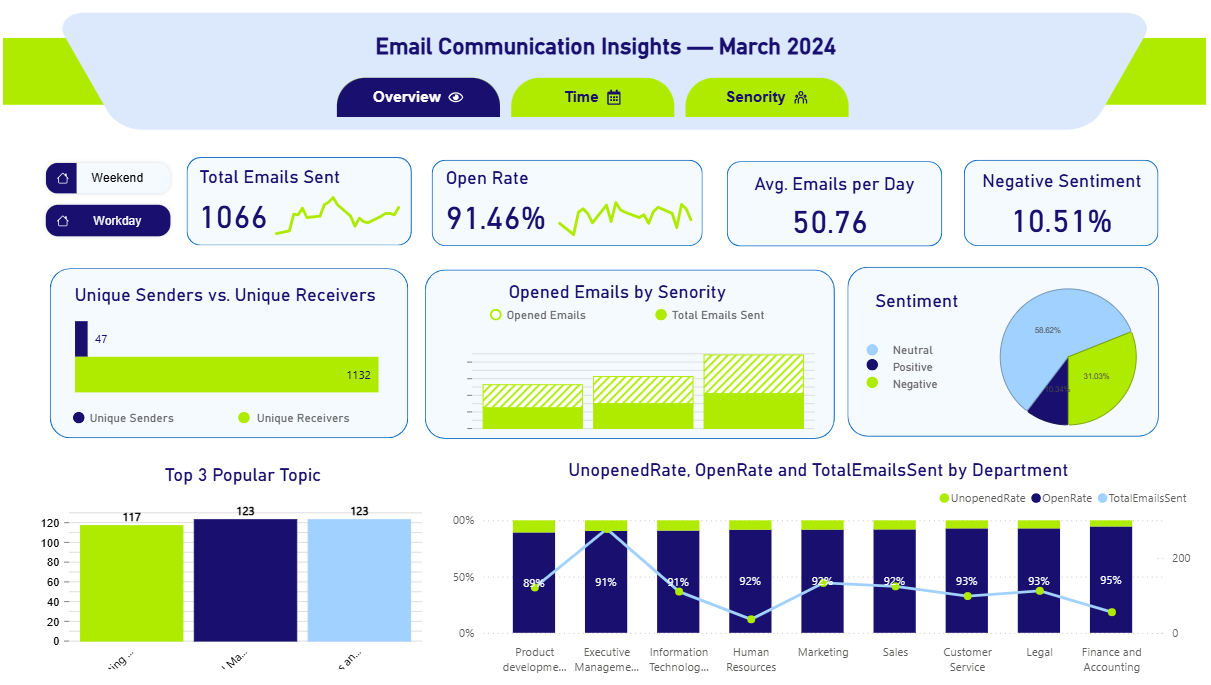
The email communication insights for March 2024 reveal the following key points:
- Total Emails Sent: 1,066 emails were sent, with a noticeable upward trend.
- Open Rate: Achieved a high average of 91.46%, indicating strong engagement.
- Average Emails per Day: 50.76 emails, suggesting a moderate daily volume.
- Negative Sentiment: 10.51% of emails contained negative sentiment, with 58.62% neutral, 31.03% positive, and 10.34% negative.
- Unique Senders vs. Receivers: 47 unique senders reached 1,132 unique receivers, showing a broad distribution.
- Opened Emails by Seniority: Higher seniority levels opened more emails, with a significant portion of total emails sent being opened.
- Top 3 Popular Topics: Topics (partially obscured) ranked with 117, 123, and 123 mentions, indicating balanced interest.
- Unopened Rate, Open Rate, and Total Emails Sent by Department: Most departments maintained a high open rate (89%-95%), with unopened rates near 6%. Finance and Accounting led with 95% open rate, while Product development had the lowest at 89%.
The dashboard is designed using Flexa Design, Flexa Tables, and Flexa Charts from Flexa Intel.
Other Templates
 Free Marketing
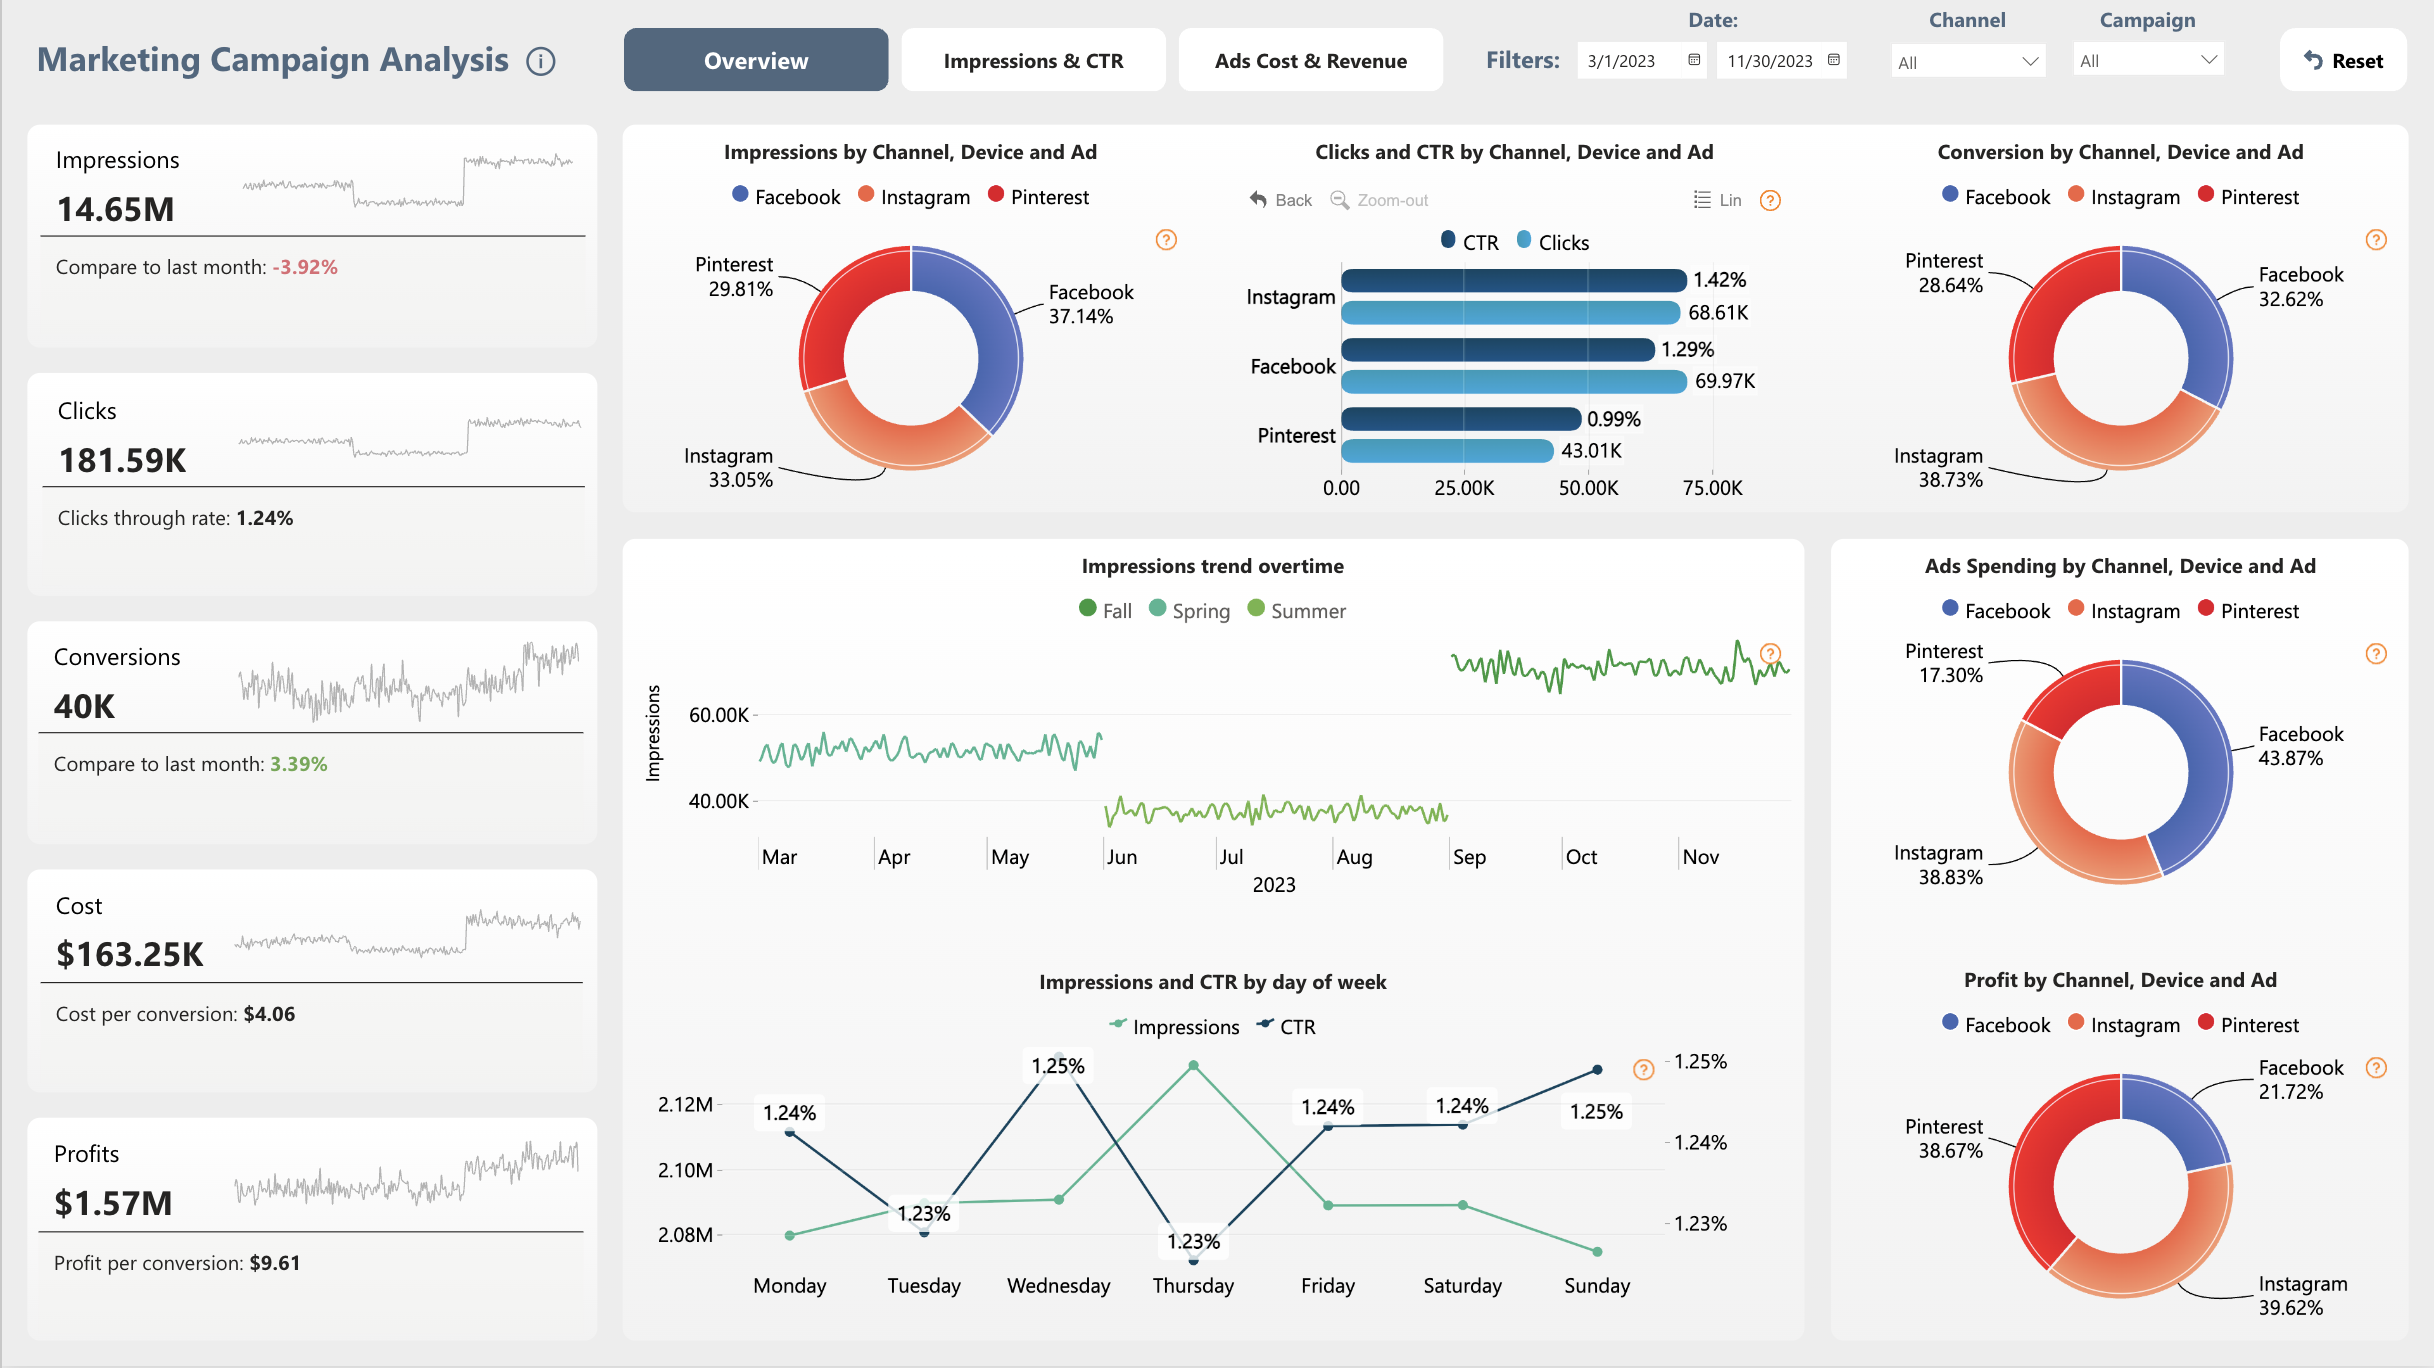
Power BI Marketing Campaign Analysis Dashboard Template (Free PBIX Download)
85
 Free Marketing
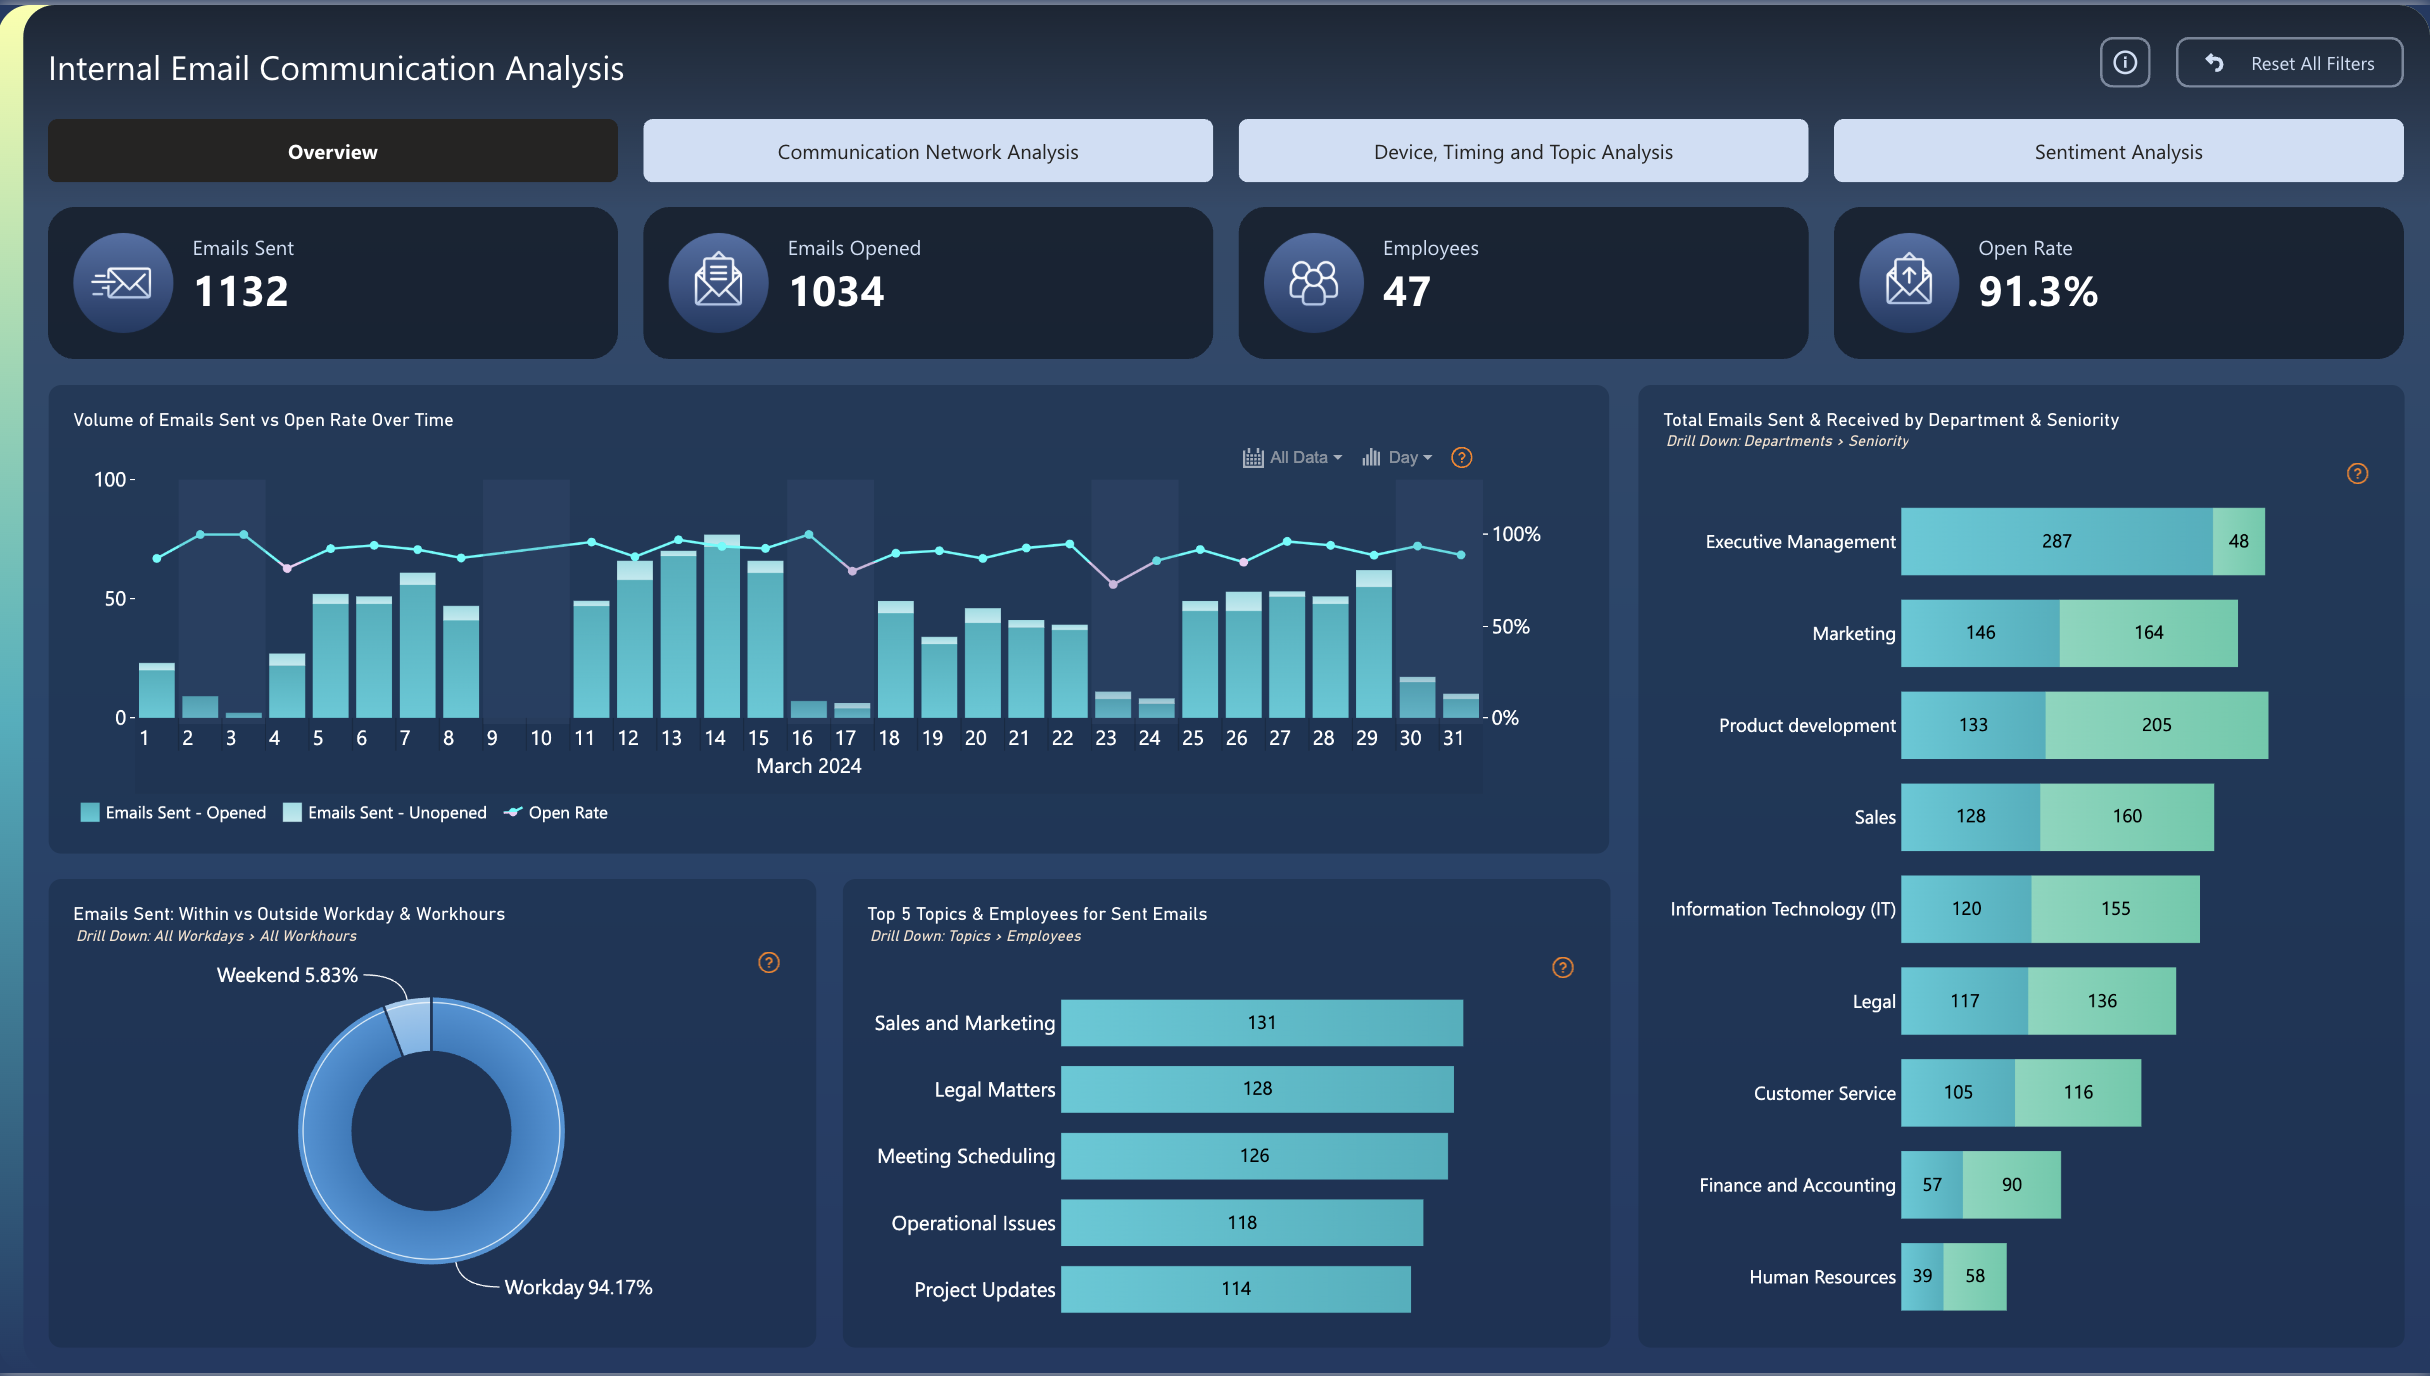
Power BI Internal Email Communication Dashboard Template (Free PBIX Download)
76
 Free Sales & Revenue
Sales Conversion – Multiple Agents Dashboard
1.1k
If you find this website helpful, share it with friends and colleagues to boost their Power BI skills and work efficiency!
Like this site? Share it