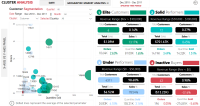
CRM Pipeline Analysis Dashboard
1499 Downloads

Description
The CRM Pipeline Analysis Overview dashboard provides the following insights:
- Closed Deals Value: $931K.
- Closed Deals: 348.
- Leads: 3,000.
- Conversion %: 11.6%.
- Avg Closed Deal: $2,676.
- Churned: 177.
- Average Close Days: 63.
- Closed Deal Value and Avg Closed Deal Value by Month and week:
- February: $244.8K, March: $271.9K, April: $168.8K, May: $141.8K, showing variability with a peak in March.
- Customer Status Pipeline:
- 3.42K leads, with 2.38K opportunities, 1.11K qualified, and 600 new, indicating a significant drop-off rate.
- Close Deals by Organization Size > Product:
- Small: 58 deals, Medium: 56, Large: 4, Enterprise: 6, with SAAS leading at 58 close deals value.
- Average of Close Duration and Deals by Agents:
- Agents show varying performance, with the top agent closing 71 deals and an average duration of 52 days.
- Closed Deals by Industry:
- Transportation: 68 deals, Banking: 47, Government: 32, Energy: 10, Retail: 18, others ranging from 8 to 14.
- Closed Deals by Countries:
- Fluctuations across countries, with peaks and troughs in deal counts over time.
The dashboard is designed using Flexa Design, Flexa Tables, and Flexa Charts from Flexa Intel.
Other Templates
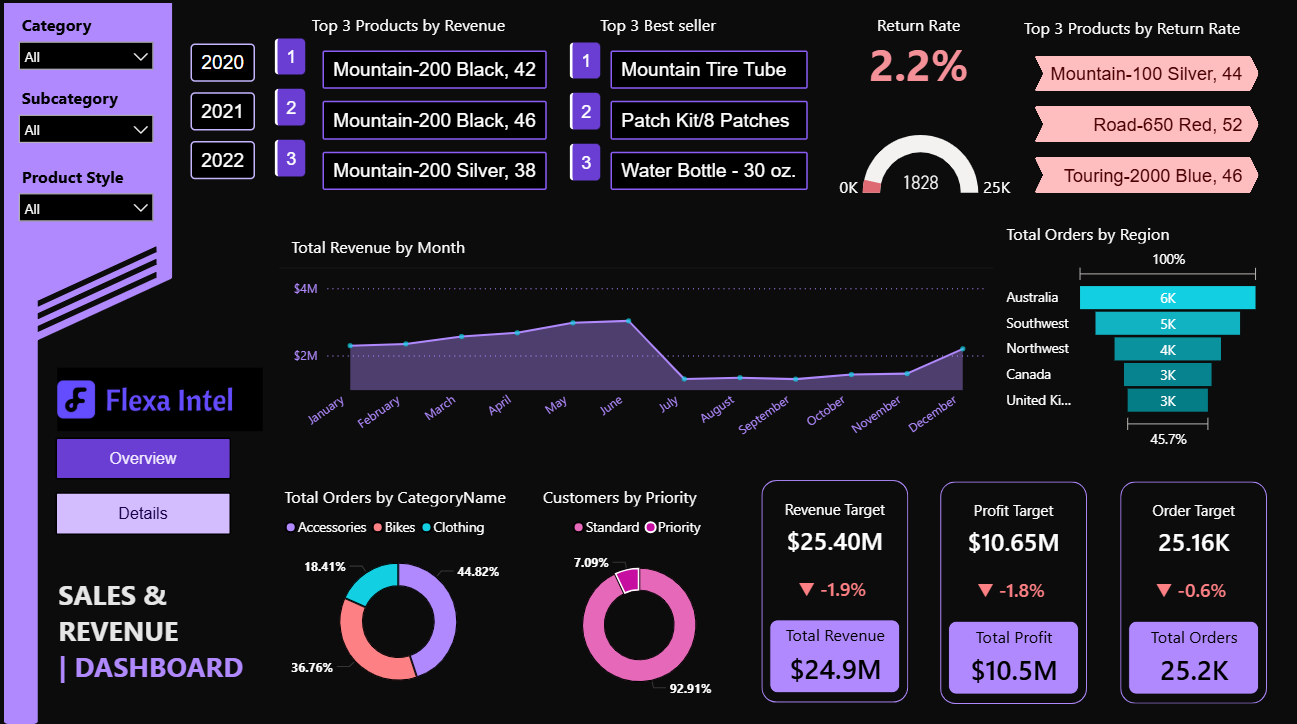 Free Sales & Revenue
Sales & Revenue Dashboard – Key Insights (Full Year 2022)
1.1k
 $18Sales & Revenue
CRM Microsoft Power BI Dashboard Template
0
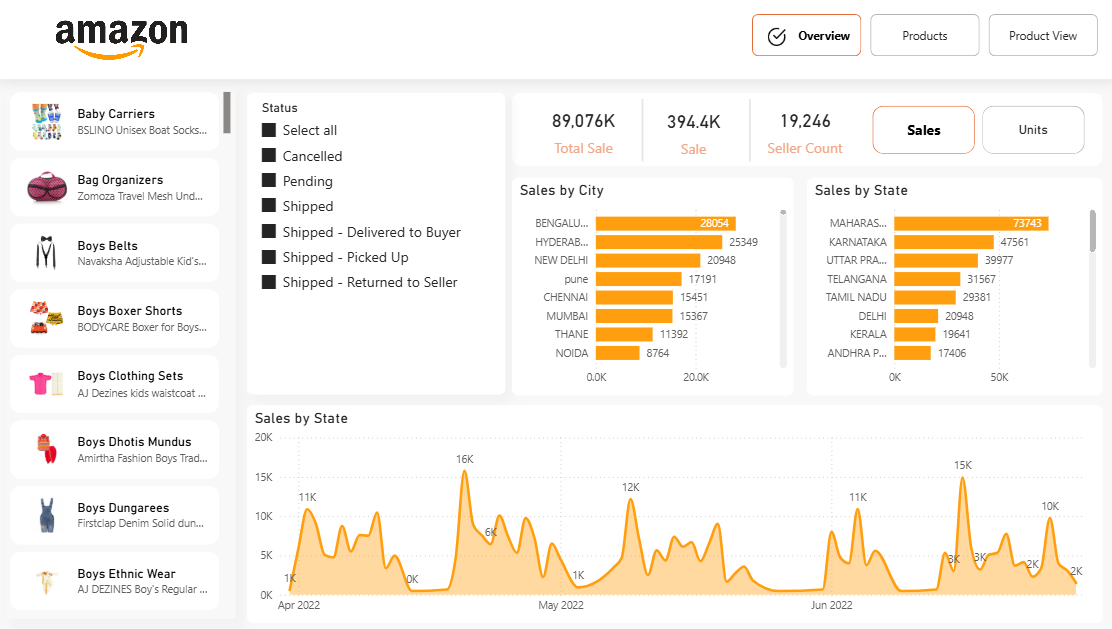 Free Sales & Revenue
Power BI Amazon India E-Commerce Sales Dashboard Template (Free PBIX Download)
90
If you find this website helpful, share it with friends and colleagues to boost their Power BI skills and work efficiency!
Like this site? Share it