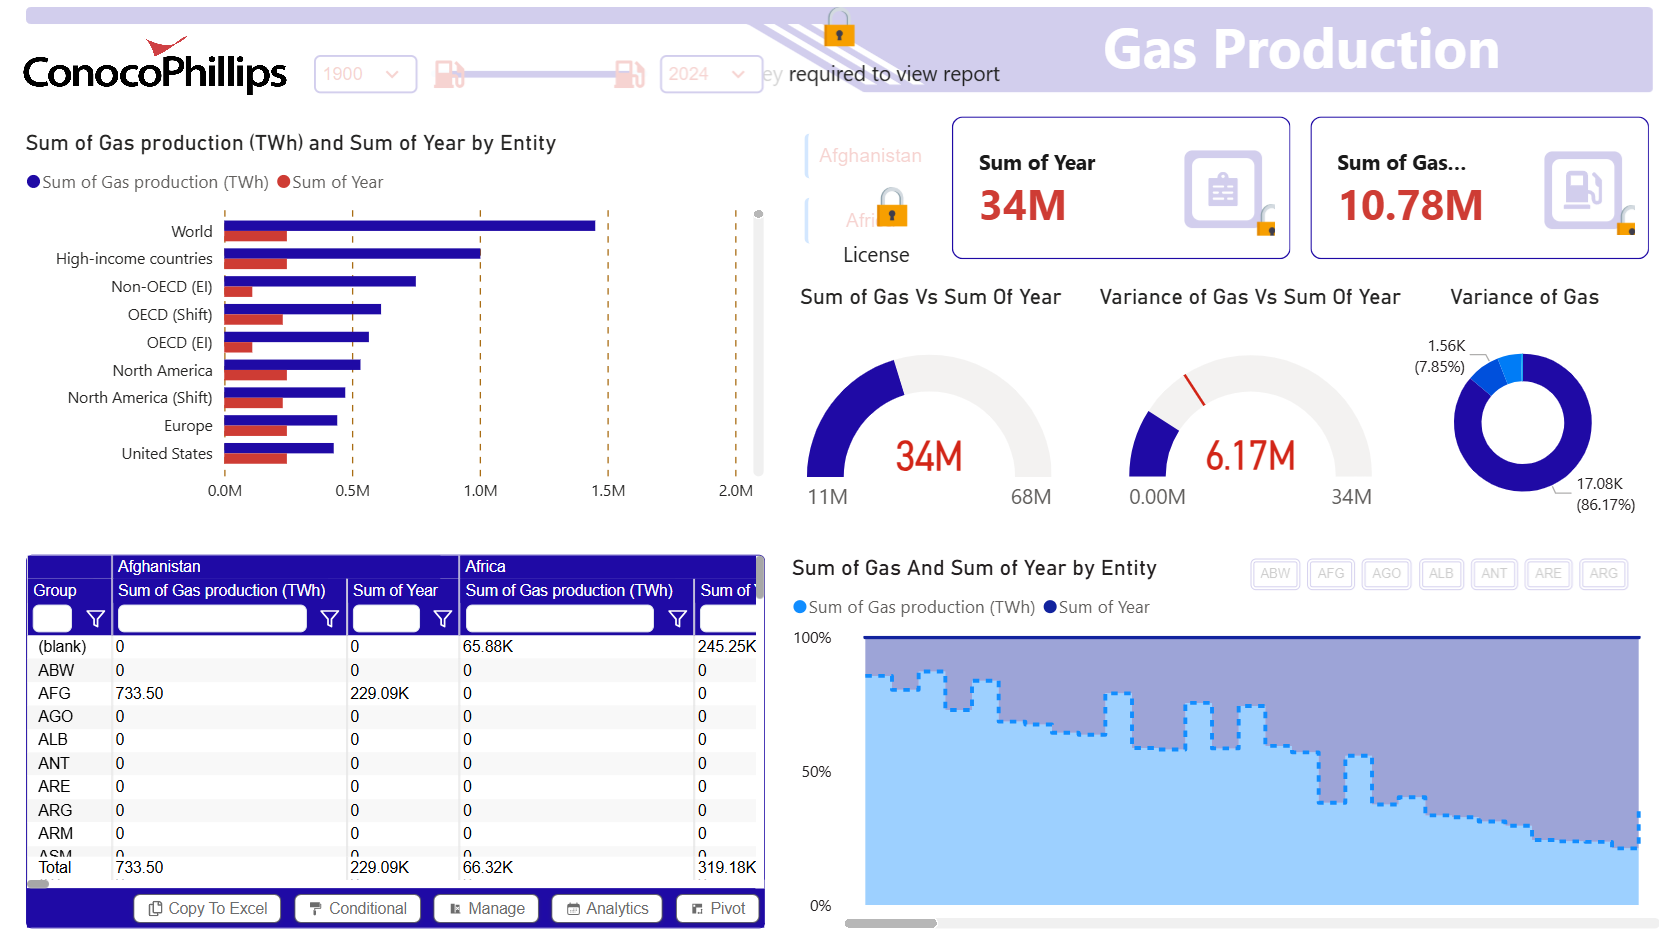
ConocoPhillips Gas Production Dashboard – Key Insights (1900–2024)
692 Downloads
Description
High-Level Summary
- Total Gas Production: 10.78M TWh (terawatt-hours) over the period.
- Sum of Year: 34M – likely cumulative reporting years or a normalized metric across entities.
- Variance Metrics:
- Positive variance: +34M (current benchmark).
- Negative variance: –6.17M.
- Net variance: +1.56K (7.85%) and +17.08K (86.17%) in different views → overall positive trend in recent or selected segments.
Production by Entity/Group
- World total leads by far.
- High-income countries – strong second.
- Non-OECD (Emerging), OECD (Shift), OECD (Established), North America, North America (Shift), Europe, and United States follow in descending order. → Production heavily concentrated in high-income and developed economies, with the US and Europe prominent individually.
Regional/Entity Details (Table Highlights)
- Africa: Significant contributor with 66.32K TWh gas production.
- Afghanistan (AFG): 733.50 TWh (notable for a minor producer).
- Many small entities (ABW, AGO, ALB, etc.): Zero or negligible.
- Total subset: ~733 TWh gas production vs ~319K "Sum of Year".
Trend Insights
- Sum of Gas vs Sum of Year by Entity: Sharp decline from ~100% early 20th century to near 0% recently → reflects maturing fields, concentration in fewer producers, or normalization showing reduced output per entity over time despite global growth.
Key Takeaways
- Developed World Dominance: High-income countries, OECD members, North America, Europe, and the US account for the vast majority → gas production aligned with industrialized economies and infrastructure.
- Global Growth with Concentration: Cumulative 10.78M TWh is substantial, but the declining ratio over time indicates fewer entities dominating larger shares (e.g., US shale boom, Qatar, Russia not directly shown but implied in aggregates).
- Emerging Contributions: Africa and select countries like Afghanistan show meaningful output, but still dwarfed by developed regions.
- Positive Variances: Recent periods show production exceeding benchmarks (+7–86% in segments) → potential growth from efficiency or new fields.
- Historical Shift: Early 1900s had broader participation; modern era is far more concentrated.
Recommendations
- Supply Security: Diversify sourcing beyond high-income/OECD reliance by investing in stable emerging producers (e.g., Africa) to hedge geopolitical risks in North America/Europe.
- Transition Planning: With concentration in developed nations, accelerate LNG and renewable gas (biomethane, hydrogen) strategies to reduce exposure to regional disruptions.
- Opportunity in Variance: Capitalize on positive recent variances through technology transfers to boost output in underperforming but promising regions like parts of Africa.
- Data Access: Unlock full report for year-by-year granularity to identify specific growth drivers (e.g., US shale, Qatar LNG expansion).
Overall: Natural gas production remains overwhelmingly dominated by high-income and developed regions, with strong historical growth but increasing concentration over time – positive recent variances offer optimism, but highlight need for diversification amid energy transition pressures.
Other Templates
 Free Operations & Production
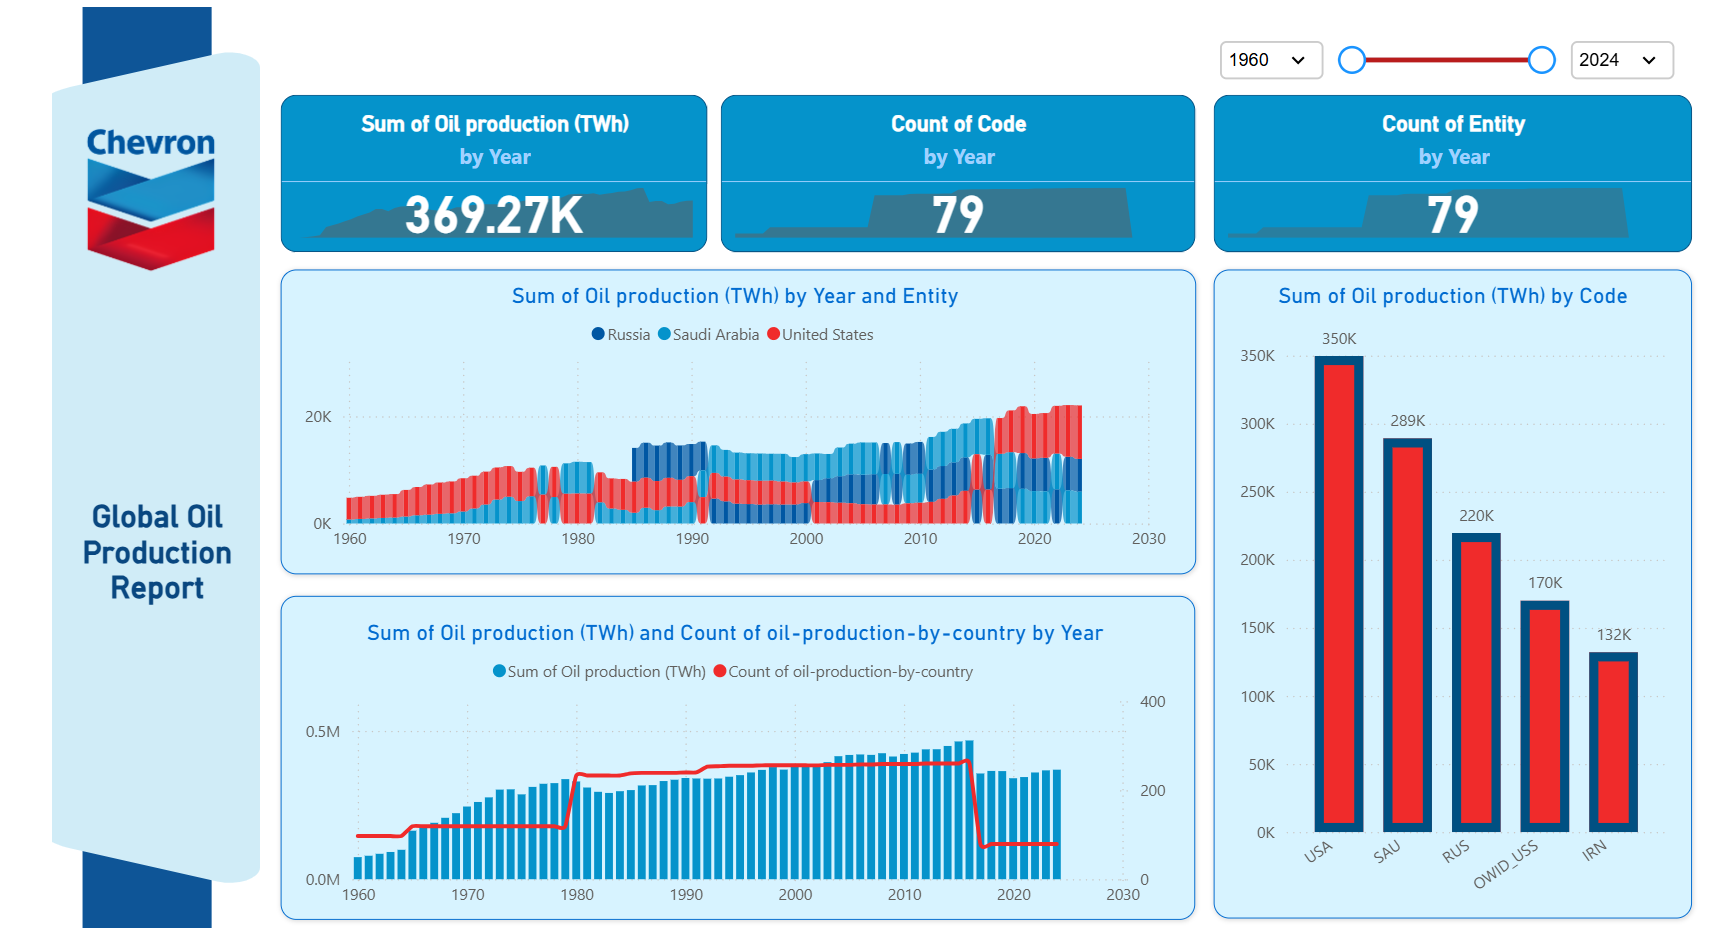
Global Oil Production Report
672
 Free Supply Chain & Logistics
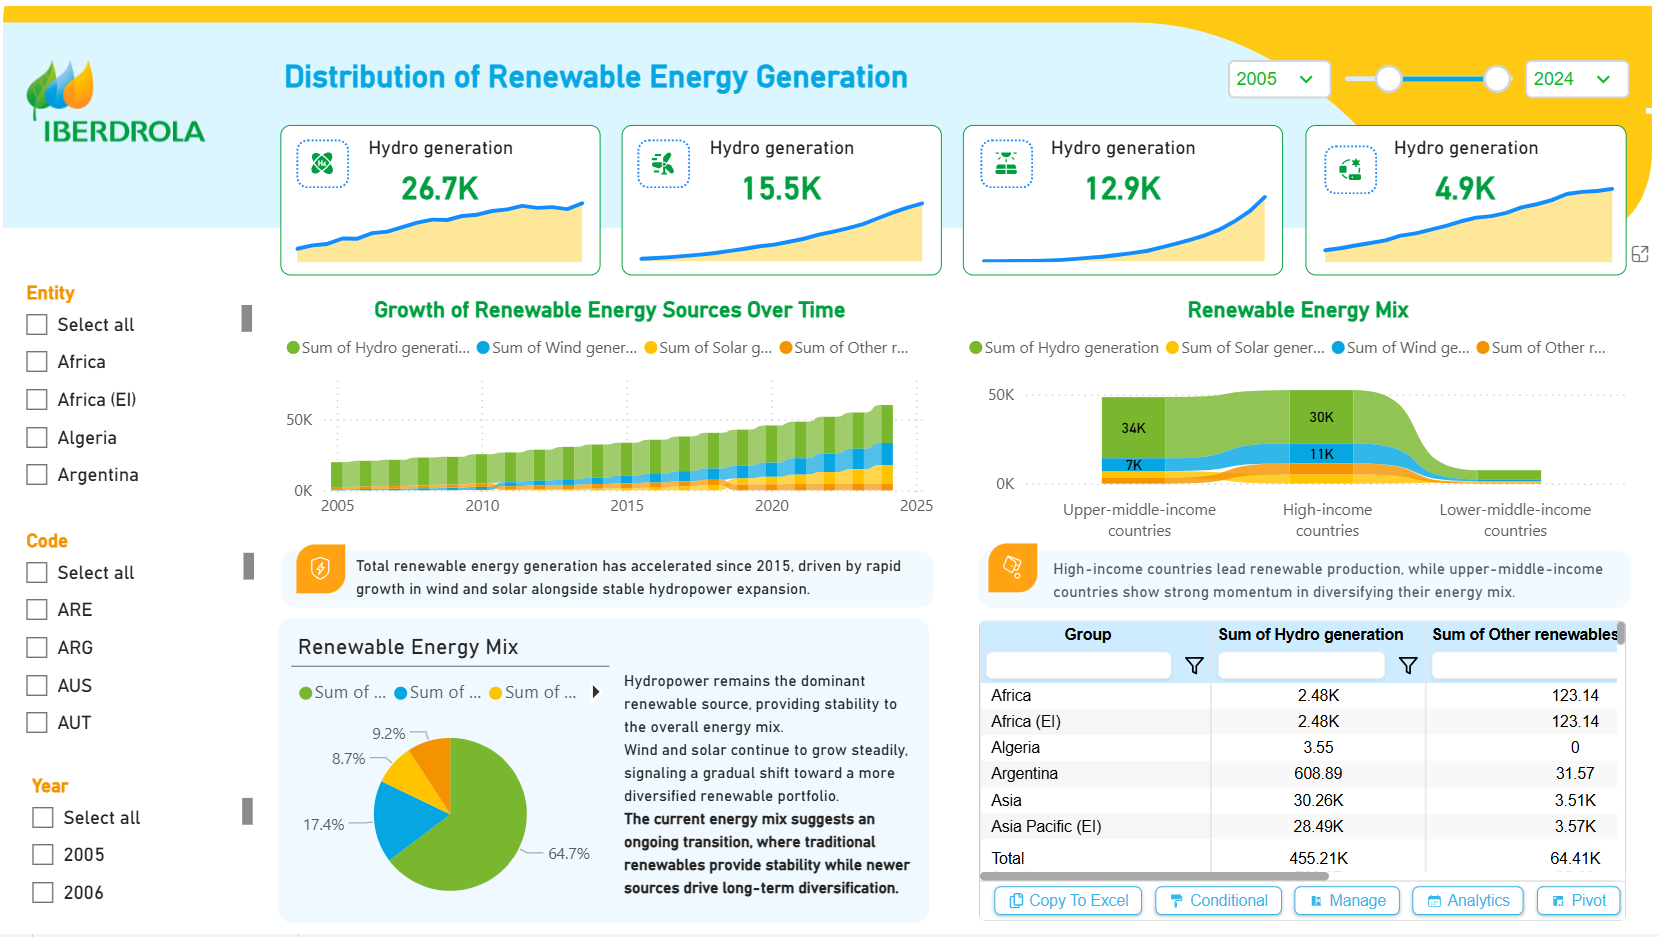
IBERDROLA Distribution of Renewable Energy Generation Dashboard – Key Insights (2005–2024)
968
 Free Operations & Production
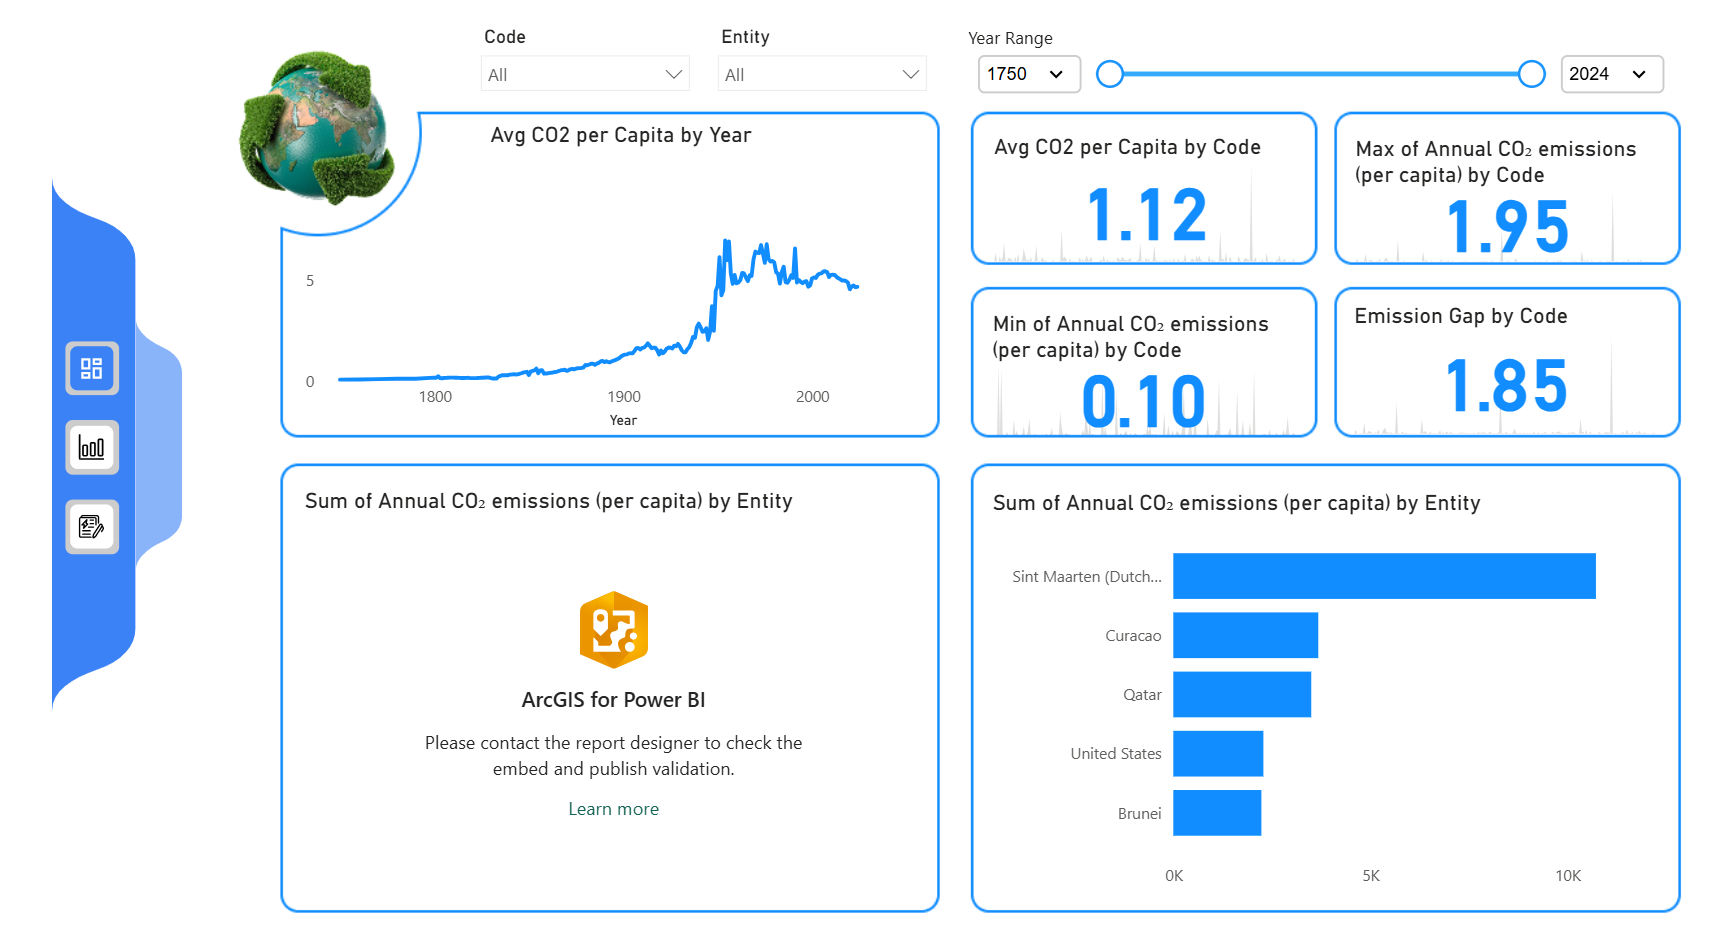
Global CO₂ Emissions Per Capita Dashboard – Key Insights (1750–2024)
541
If you find this website helpful, share it with friends and colleagues to boost their Power BI skills and work efficiency!
Like this site? Share it