Chevron Crude Oil Price Dashboard – Key Insights (2023–2025)
950 Downloads
Description
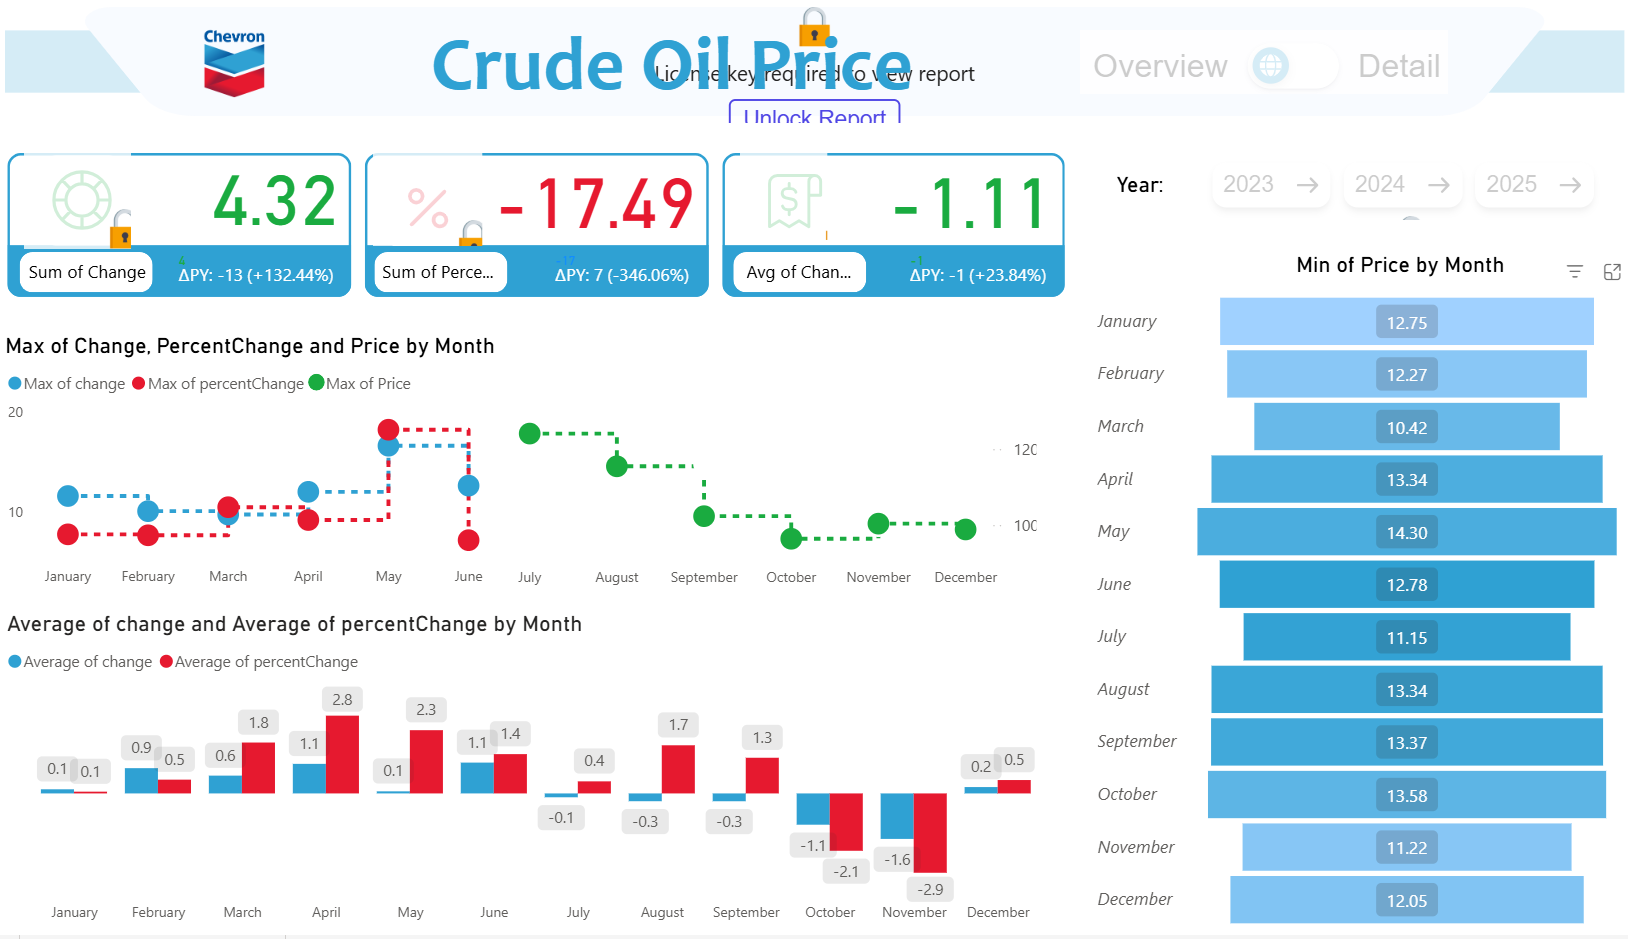
Overall Price Performance
- Sum of Change (ΔPY): +4.32 (Year-over-Year increase of +132.44% from previous period)
- Sum of Percent Change: –17.49% (significant YoY decline)
- Avg of Change (ΔPY): –1.11 (average monthly change of –23.84%) → Mixed signals: strong cumulative gain in absolute price change, but sharp percentage declines suggest high volatility and a downward trend in recent momentum.
Monthly Price Levels (Min of Price by Month)
- Highest: May – 14.30
- Lowest: March – 10.42
- Year-end trend: Prices declined toward December (12.05), with a notable drop in November (11.22) → Seasonal pattern with spring/early summer peak, followed by gradual softening through year-end.
Max Change, Percent Change, and Price by Month
- Largest positive price changes: Early months (January–May)
- Sharpest declines: Late year (October–December)
- Percent changes highly volatile, peaking positively mid-year but turning deeply negative in Q4
Average Change and Percent Change by Month
- Strongest positive average changes: March–May (~1.1–2.3)
- Deepest negatives: November (–2.9), October (–2.1), December (–1.6) → Consistent pattern of Q2 strength and Q4 weakness in both absolute and percentage terms.
Key Takeaways
- High Volatility: Extreme swings in both absolute (+132% cumulative) and percentage (–17.49%) changes indicate a turbulent market influenced by geopolitical events, demand shifts, or supply disruptions.
- Seasonal Cycle: Prices typically peak in spring/early summer (May high of 14.30) and weaken significantly in late fall/winter – classic pattern tied to driving season, refinery maintenance, and heating oil demand transitions.
- Downward Momentum in Late Year: Q4 consistently shows the largest negative changes, suggesting structural oversupply, weakening demand, or inventory builds at year-end.
- Mixed Recovery Signals: While cumulative change is positive, average monthly performance is negative – implying short-term rallies within an overall softening trend.
Recommendations
- Hedging Strategy: Lock in forward sales during Q2 peaks to protect against predictable Q4 declines.
- Inventory Management: Build strategic reserves in low-price late-year periods and draw down during high-price spring/summer.
- Monitor Macro Drivers: Track OPEC+ decisions, geopolitical risks, and global demand (especially China/Asia) as primary volatility sources.
- Scenario Planning: Prepare for continued high swings – stress-test operations for both $10 and $15+ price scenarios.
Overall: Crude oil prices exhibit strong seasonal behavior with spring highs and winter lows, overlaid on a volatile multi-year trend showing absolute gains but recent percentage weakness – vigilance on Q4 softening and macro risks remains essential.
Other Templates
 Free Operations & Production
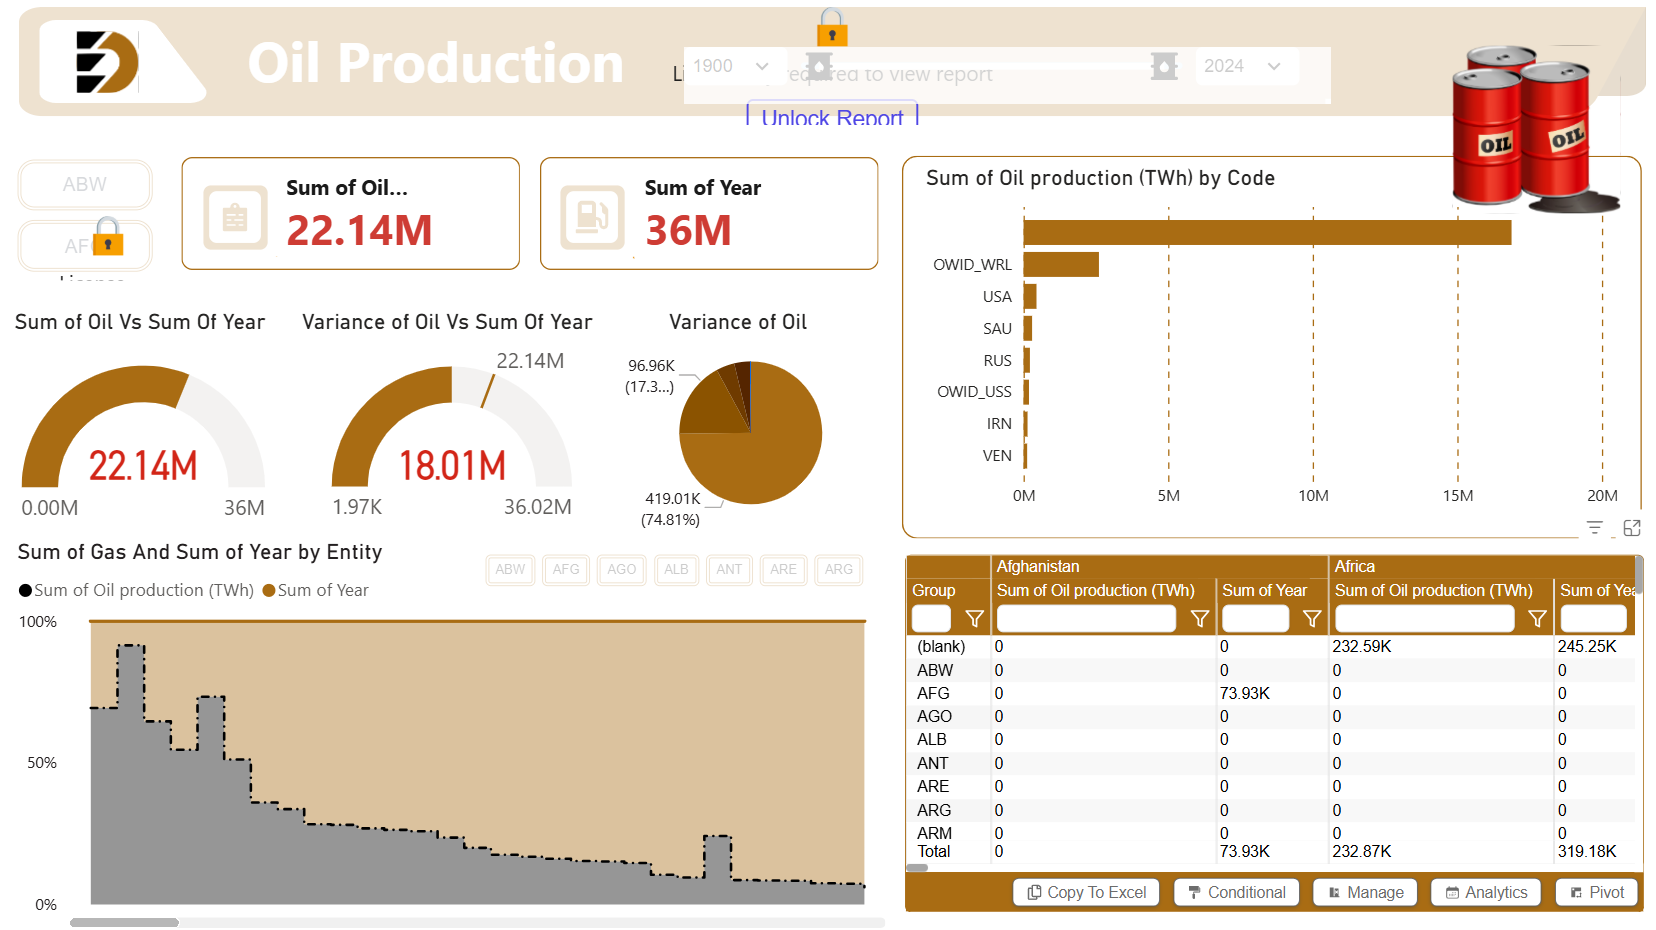
Oil Production Dashboard – Key Insights (1900–2024)
589
 Free Operations & Production
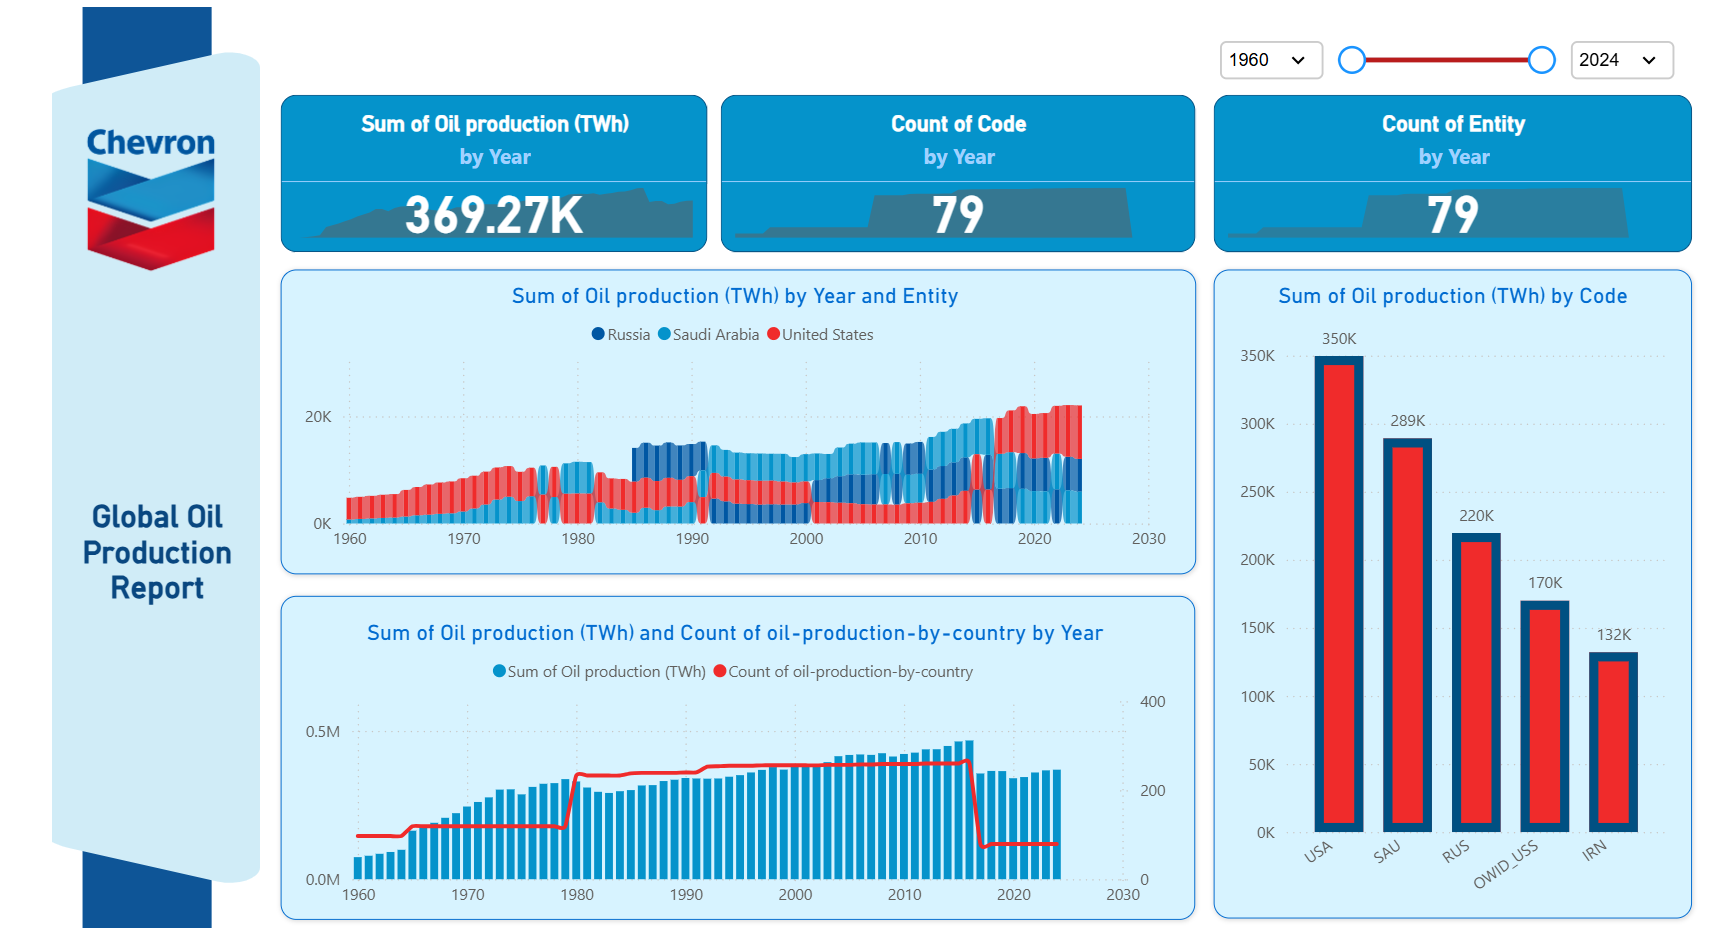
Global Oil Production Report
672
 Free Operations & Production
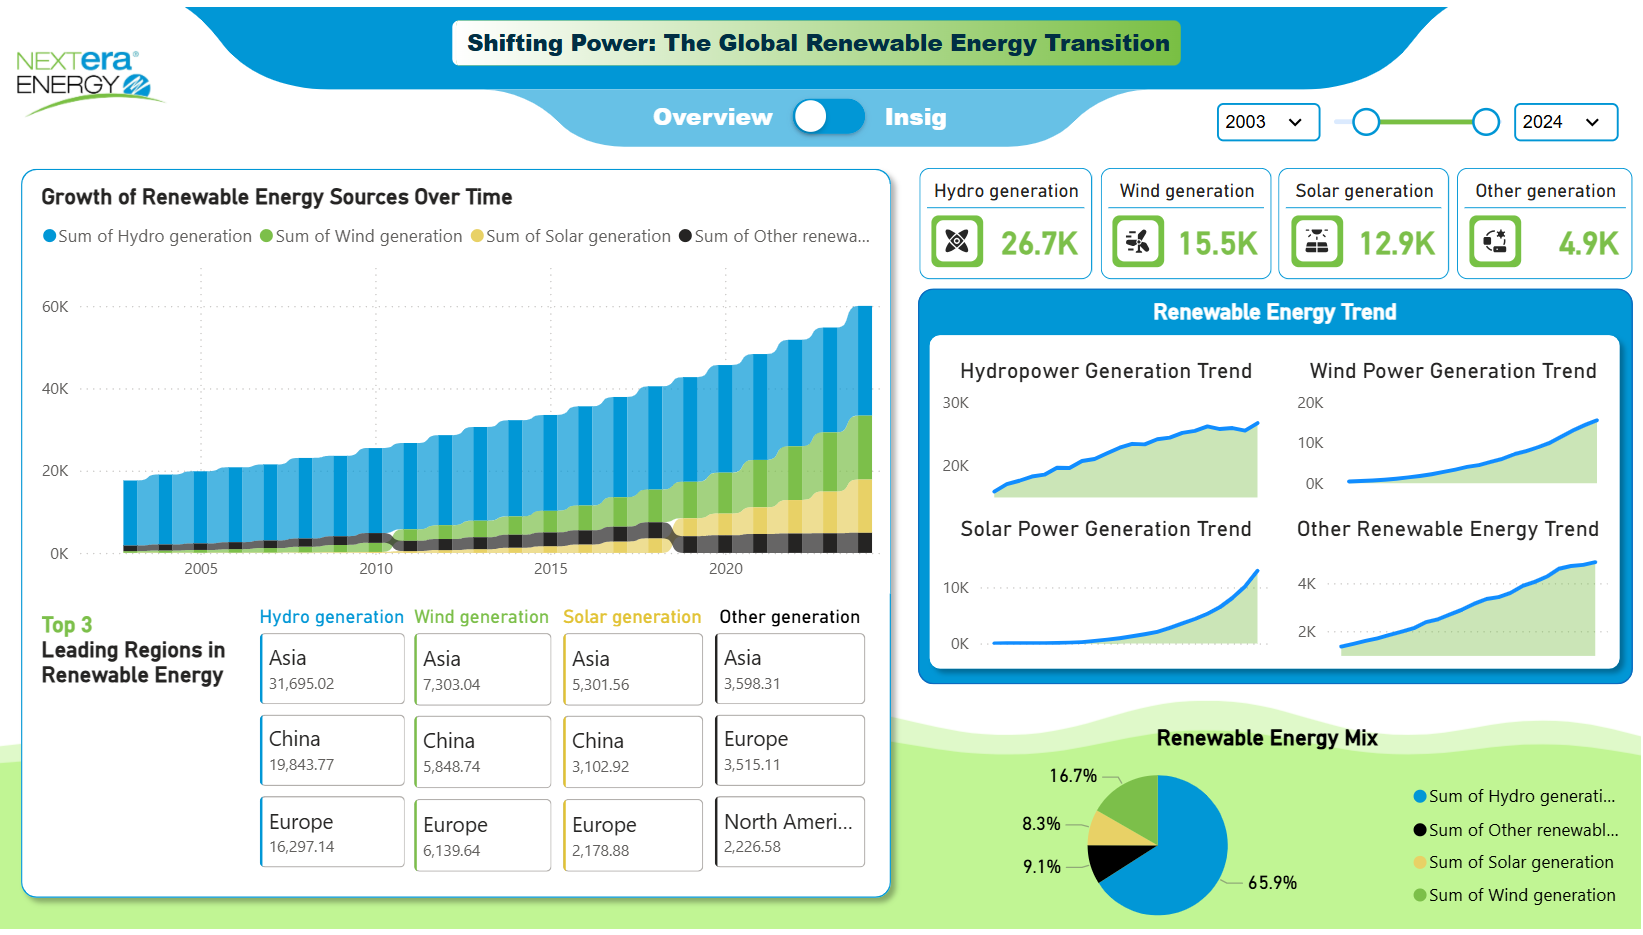
NextEra Energy: Shifting Power – Global Renewable Energy Transition Dashboard Insights (2003–2024)
927
If you find this website helpful, share it with friends and colleagues to boost their Power BI skills and work efficiency!
Like this site? Share it