BP Oil Pipeline Accidents: Key Patterns (2010–Present) – Key Insights
866 Downloads
Description
Overall Summary
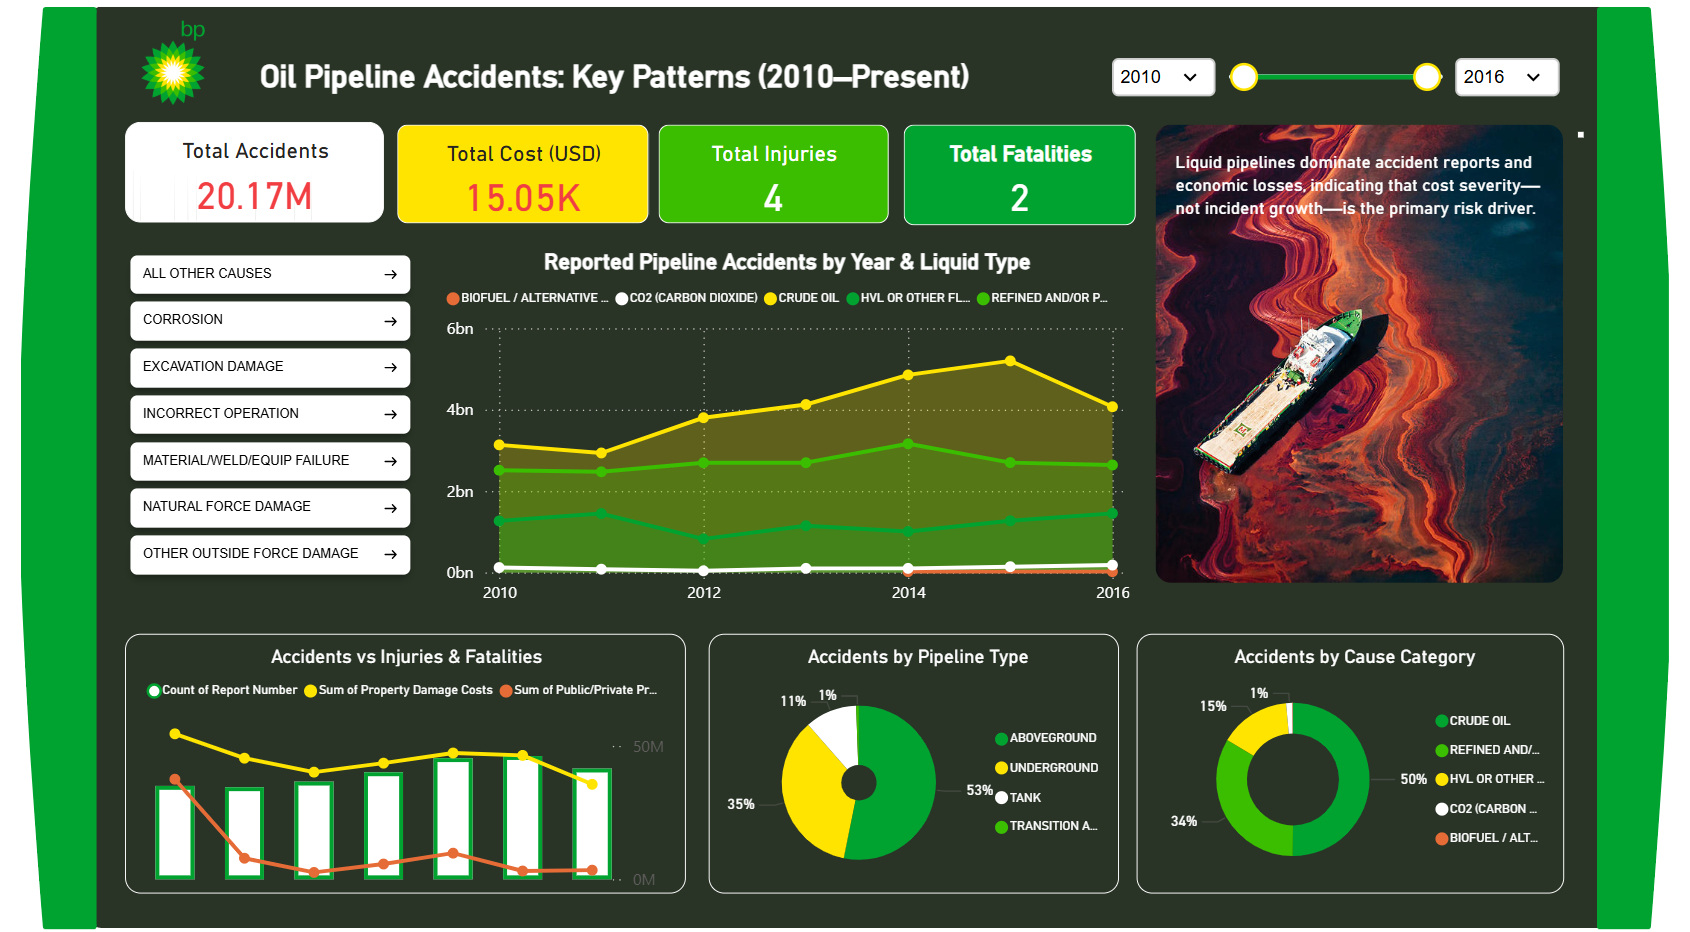
- Total Accidents: 20.17M (likely cumulative reported events or metric artifact; charts show volume in billions of units, possibly related to volume transported or incident reports).
- Total Cost: $15.05K (low aggregate – suggests minor incidents dominate).
- Human Impact: 4 injuries, 2 fatalities – very low.
- Key Insight: "Liquid pipelines dominate accident reports and economic losses, indicating that cost severity—not incident growth—is the primary risk driver."
Reported Accidents by Year & Liquid Type
- Refined and/or Petroleum Product (green) is the dominant category, peaking mid-period (~4–5bn units).
- HVL or Other Flammable/Toxic Fluid, Gas (yellow line) shows steady growth.
- Crude Oil (light green) and others remain lower.
- Total volume grew steadily from 2010, peaked around 2014–2015, then slightly declined.
Accidents by Pipeline Type
- Tank: 53% (largest share)
- Underground: 35%
- Aboveground: 11%
- Transition Area: 1% → Storage tanks and underground lines account for ~88% of incidents.
Accidents by Cause Category
- Refined and/or Petroleum Product: 50%
- HVL or Other Flammable/Toxic: 34%
- Crude Oil: 15%
- CO2 and Biofuel/Alternative: ~1% → Refined products in tanks/underground pose the majority risk.
Accidents vs Injuries & Fatalities
- Incident/property damage costs (yellow) peaked mid-period then declined.
- Public/private property costs (red) and report counts (green bars) followed similar pattern.
- Injuries/fatalities remained negligible throughout.
Key Takeaways
- Liquid Dominance: Refined petroleum products drive both volume and economic impact – focus prevention here.
- Cost Severity Over Volume Growth: While incident volume stabilized post-2015, severity (cost per event) is the ongoing risk – likely due to larger/more complex failures in remaining incidents.
- Tank & Underground Vulnerability: Over 88% of accidents occur in tanks and buried lines – harder to inspect and detect.
- Excellent Human Safety: Extremely low injuries (4) and fatalities (2) reflect strong safety culture, emergency response, and containment.
- Mid-Period Peak: Highest risk period was 2013–2015; subsequent decline suggests successful interventions (better monitoring, maintenance).
Recommendations
- Prioritize tank integrity programs and underground pipeline inspection technologies (e.g., smart pigs, leak detection).
- Focus risk mitigation on refined product handling and storage – the clear dominant category.
- Maintain investments in operator training, emergency response, and third-party damage prevention to preserve the outstanding human safety record.
- Analyze root causes of mid-period peak to ensure lessons are sustained and applied to prevent resurgence.
Overall: bp demonstrates strong progress in reducing incident volume and maintaining minimal human impact, with liquid (especially refined) products in tanks and underground pipelines as the primary ongoing economic risk – cost severity in remaining events requires continued vigilance on asset integrity.
Other Templates
 Free Operations & Production
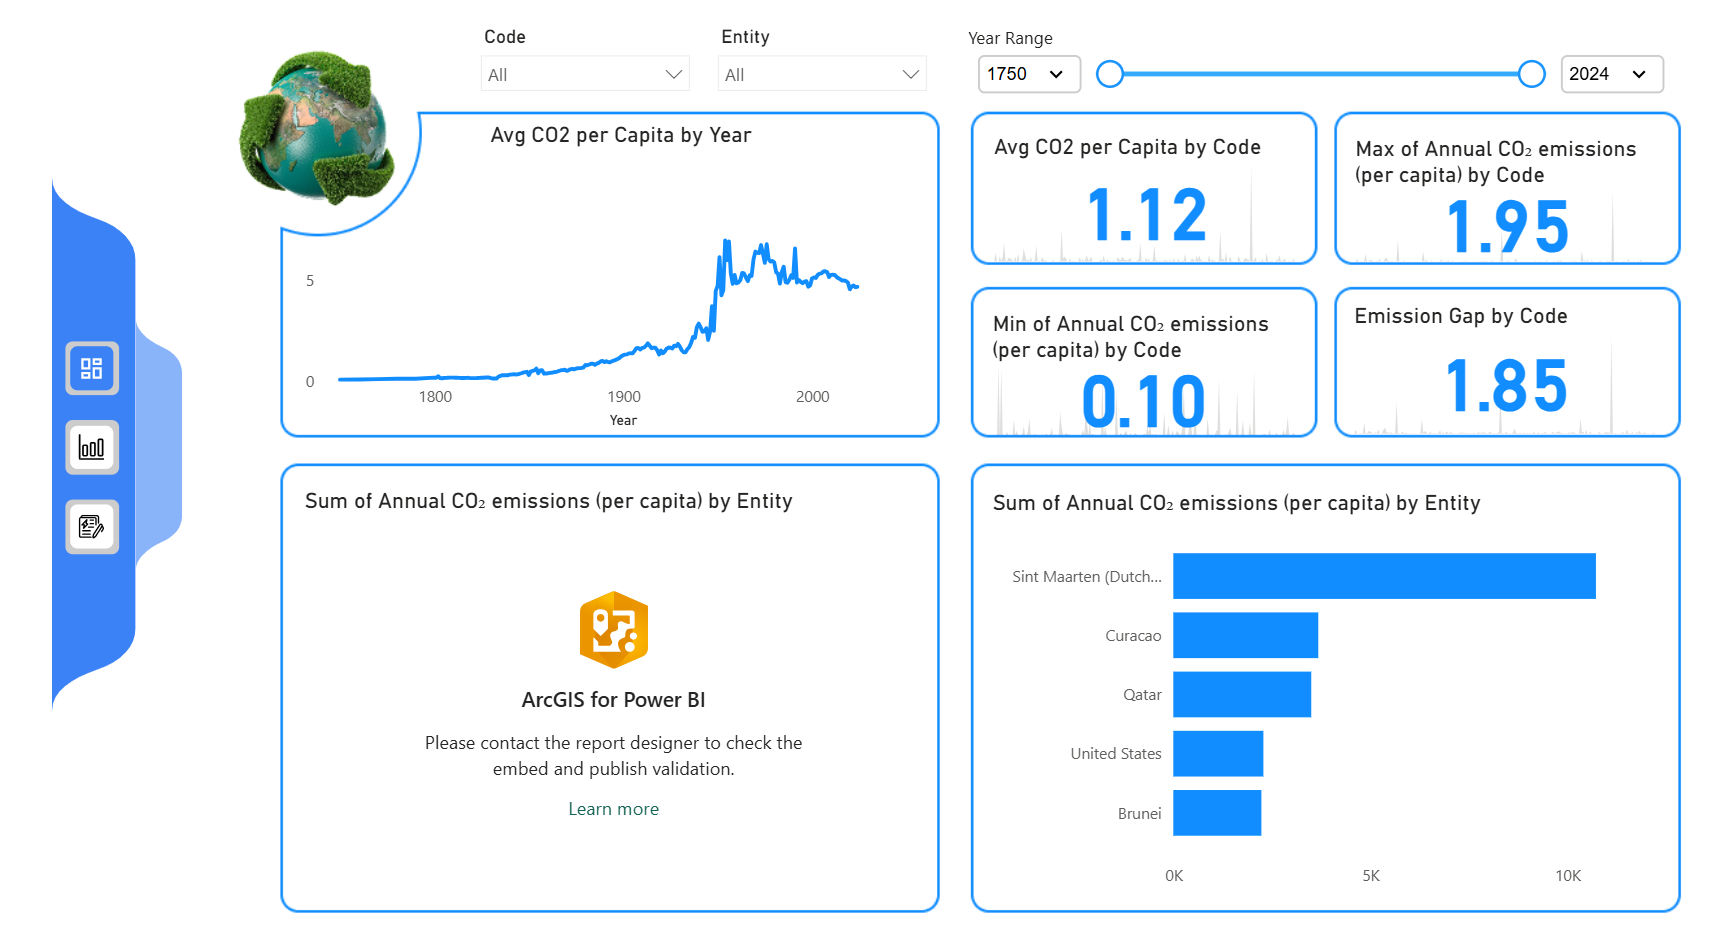
Global CO₂ Emissions Per Capita Dashboard – Key Insights (1750–2024)
541
 Free Sales & Revenue
AdventureWorks Global Sales & Customer Insights Dashboard
854
 Free Sales & Revenue
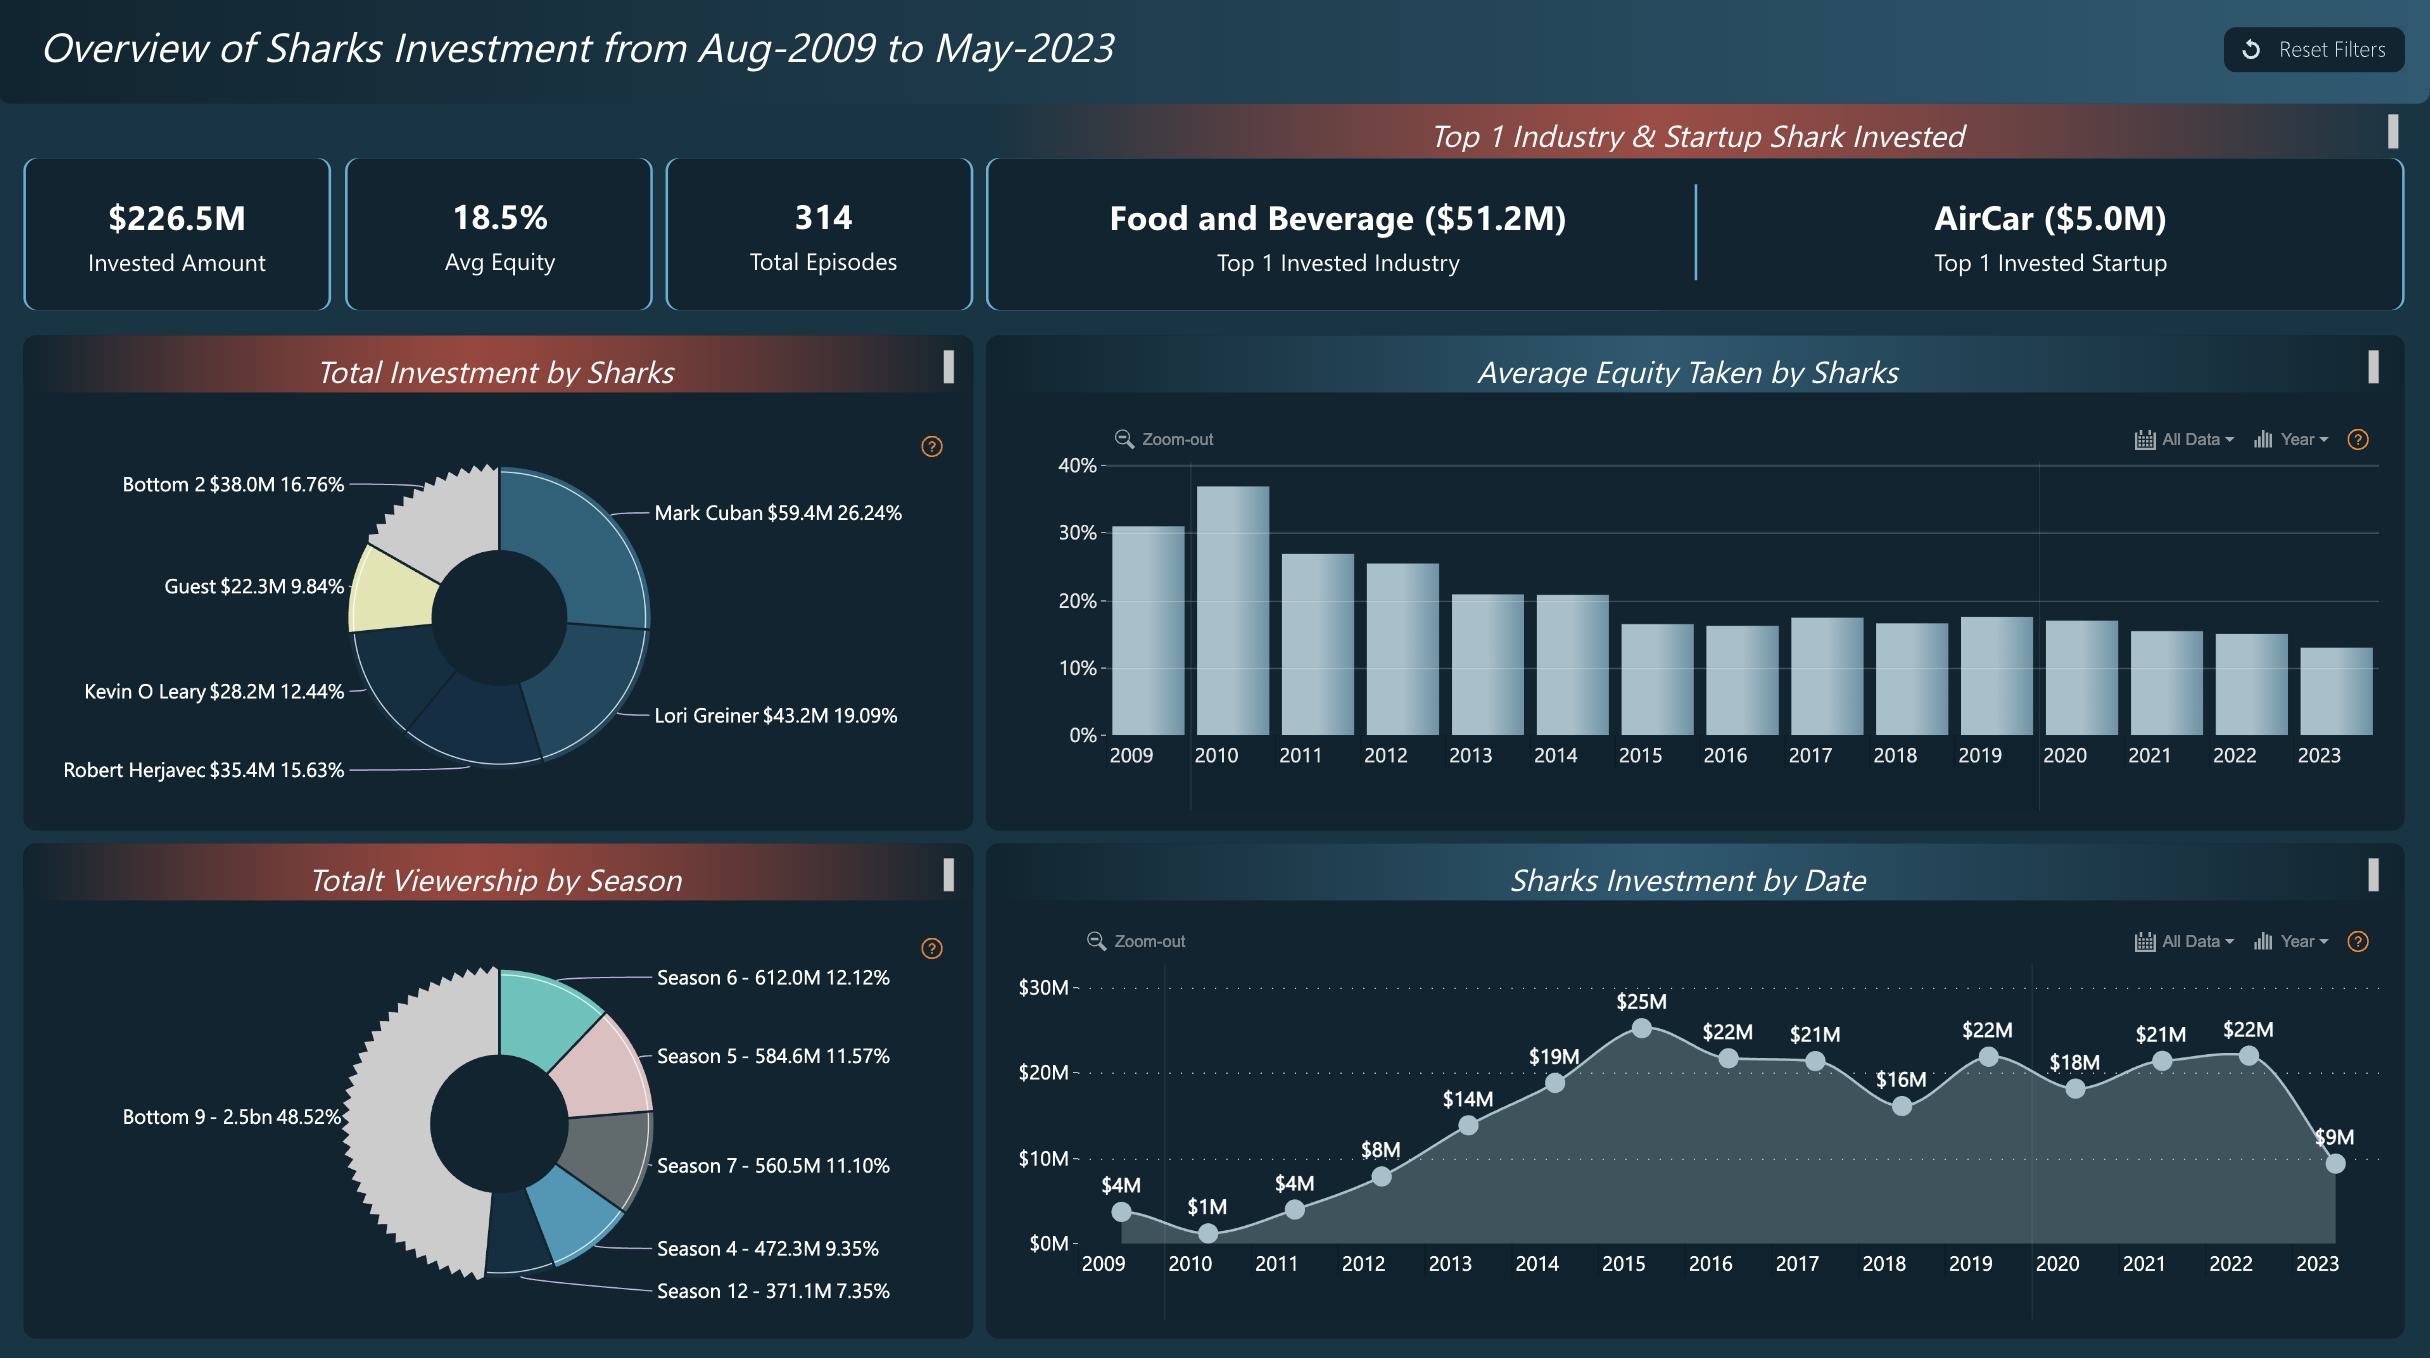
Power BI Shark Tank Investment Dashboard Template (Free PBIX Download)
67
If you find this website helpful, share it with friends and colleagues to boost their Power BI skills and work efficiency!
Like this site? Share it